There were no construction briefs posted on June or July.
Construction Jobs vs Construction Spending.
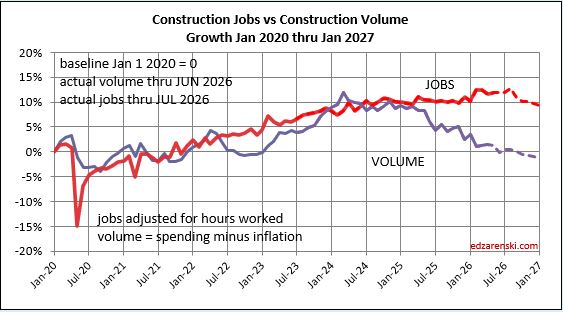
Jobs growth has been ahead of business volume growth for more than 2 years. This is added jobs cost without added volume, adds to building cost inflation. When construction jobs increase more then volume of work, productivity declines. It takes more jobs to put-in-place the volume of work. By this measure, construction productivity has declined in 20 of of the last 25 months.
Data Center construction spending – 4 of last 5 qtrs average spending increases at a rate over 3%/mo. Next 12 mo spending forecast +2%/mo to +3%/mo.
Even if Data Center construction spending were to stall right now with no more gains for 2026, but level spending thru year-end, we would finish the year up $66bil, or up 33%.
I’m forecasting Data Centers spending will increase at a rate of 3%/mo for 8 of the 9 next months. DC will not post a decline in annual rate in the next 36 months. DC spending gains will overtake Mnfg declines in 2027.
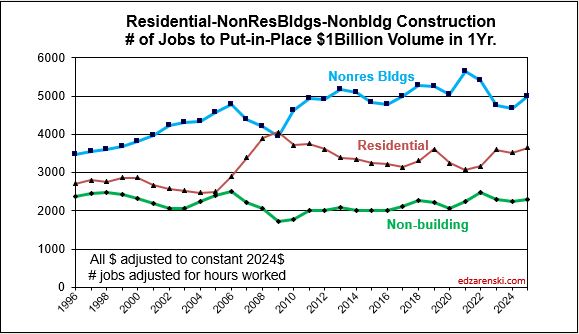
When you read a post about data centers adding construction jobs, for every $1billion in construction it takes an average of 4000 jobs for one year. Ex., a $10 billion data center needs an avg 40,000 jobs for 1 yr, or more like 10,000 jobs for 4 yrs. Jobs start slow. Peak is higher than avg.
It takes approx 4,000 (to 5000) construction jobs one year to put-in-place $ 1 billion of building construction. $50bil of data center bldg construction (excluding all computing equipment) will require 200,000 man years (4000×50) to complete construction. That’s 10,000 jobs 20 yrs or 20,000 jobs 10yrs or …
” $170 billion of AI data-center capacity has been blocked, stalled or canceled since 2024″ WSJ
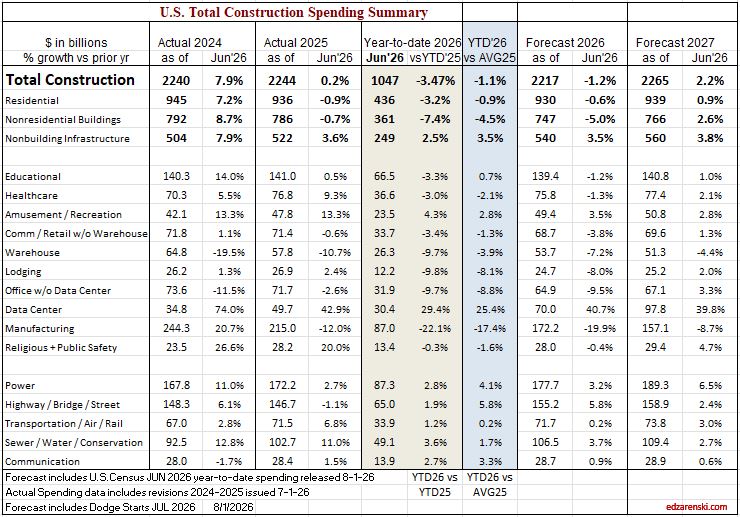
Manufacturing construction spending peaked at a rate of $250bil in Sep-Oct-Nov 2024. Spending has fallen in 15 of the last 19 months since peak, now at $175bil, and is expected to fall in 16 of next 18 months, down to $150bil. Manufacturing Construction Starts peaked in 2022. Starts are now only 40% of peak.
Changes to 2024 and 2025 Construction Spending issued July1. Little change to 2026 forecast but revs added $73bil to 2025 base, therefore all 2026 forecast percent growth went down. 2024 +55bil 2025 +73bil. Biggest revs to 2025 Rsdn +$14bil, Power +14b, Hlthcr +8b, DataCntr +8b Overall, biggest revs are to Data Centers, Mnfg and Healthcare
8/20/26 After this forecast was published, I discovered an oversight in my data entries. Residential spending for all years 2026 and later is reported in this forecast approximately $30 billion too high. That lowers the grand total for each year affected. It had no effect on Nonresidential Bldgs or NonBuilding Infrastructure.
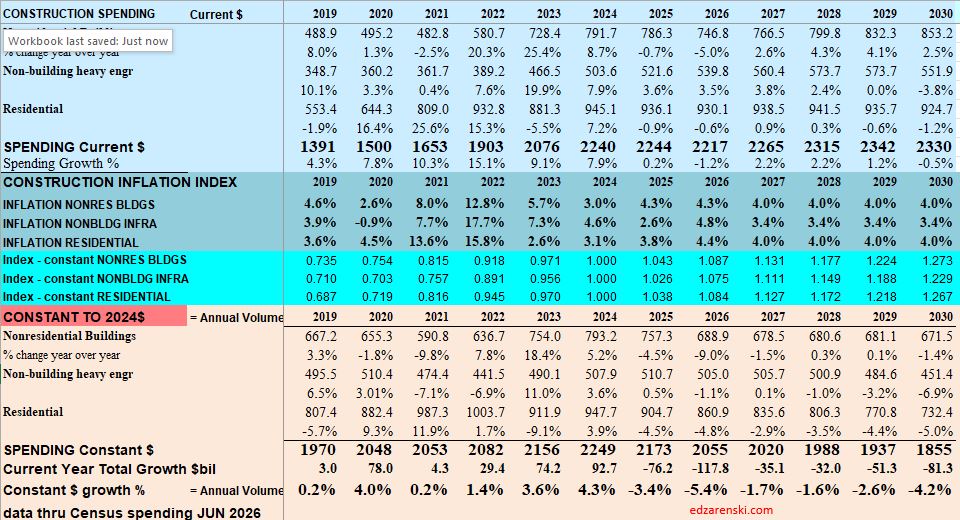
Construction Spending for 2026 is forecast at $2.217 trillion, down 1.2% from 2025. Inflation ranges between 4.3% (Nonres Bldgs) and 4.8% (Infra). Rsdn Inflation is at 4.4%. All sectors actual business volumes are being dragged down by inflation. 2026 Volume is forecast down 5.4%. A growing business must at least exceed added inflation.
If your total business revenues for 2026 increase less than 5.4%, your business is not growing.
for 2026, Data Centers gain +$20bil., Mnfg falls -$40bil.
If we use an avg of 4000 jobs per $1 bil spending per year, then DataCntr added 80,000 jobs while in Mnfg constr, -160,000 jobs ended. Office constr, 36,000 jobs ended. Highway constr 56,000 new jobs started.
Volume of construction work (spending minus inflation) has been falling for months, projected down 5.4% in 2026. We should see jobs follow, but jobs are up in 6 out of 7 mo so far in 2026, up a total of just under 1%. Volume is predicted to fall 10 of next 12 months. There is nothing in the data that would indicate volume is set to increase.
For 2026 nonresidential bldgs construction spending, Data Centers +40% +$20bil, Manufacturing -20% -$43bil. Nothing else even comes close to the impact these two have on overall spending, but also notice, a 40% gain in DC is not enough to offset a 20% decline in Mnfg.
Nonres spending in total is declining, in large part due to mega-spending on Mnfg Bldgs tapering to completion (spending peaked in Q3’24), creating large, but normal, annual declines. This may have the effect of offsetting gains in other nonres bldgs markets.
I posted this on my blog almost two years ago to explain the magnitude of the expected manufacturing construction spending taper decline. The decline from jobs ending is still greater than the growth from all added spending.
Construction should not be adding jobs now.

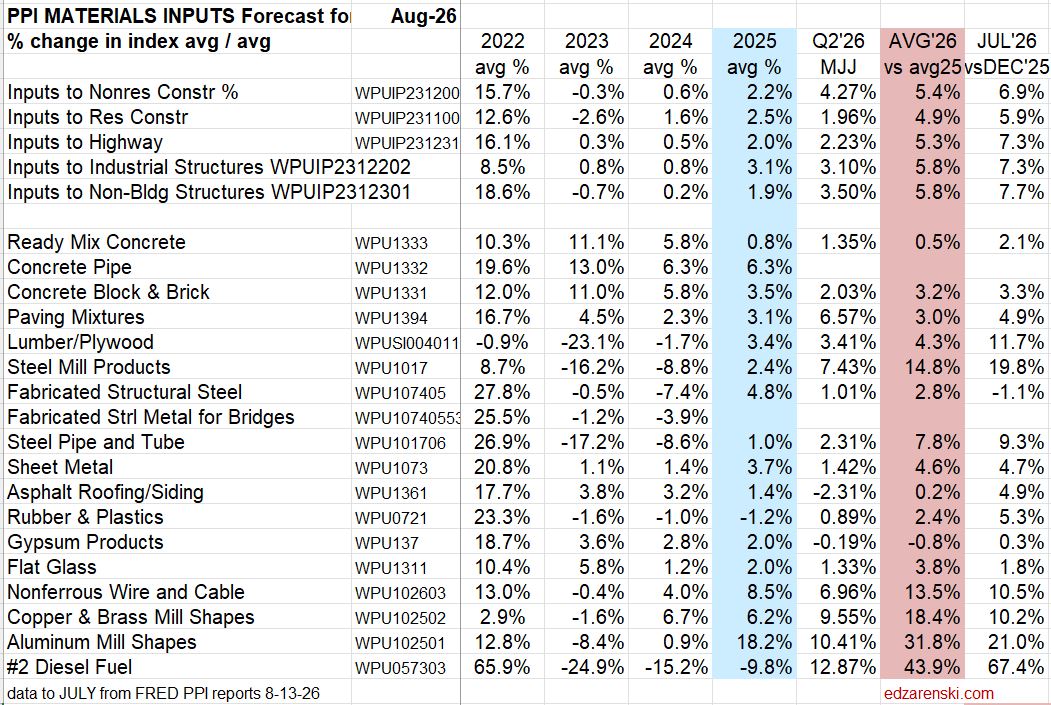
Construction PPI thru Jul
6.9% Inputs to Nonres Bldgs Constr
5.9% Inputs to Residential Constr
7.3% Inputs to Highway Constr
A few items Jul’26 vs Dec’25
67% Diesel
21% Aluminum Shapes
20% Steel Mill Products
11.7% Lumber/Plywood
10.5% Nonferrous Wire and Cable
9.3% Steel Pipe and Tube
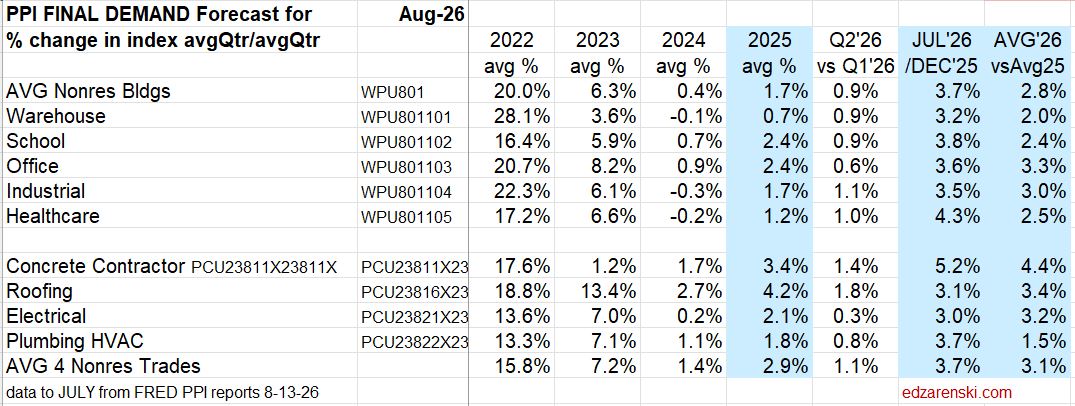
The PPI Final Demand (actual price as built) for Nonres bldgs and contractors is 3.7%. Inputs gives us a look at material pricing only. Final Demand includes material, labor, productivity and contractors overhead and profit. Unlike mtrl inputs, most of the Final Demand increase occurred in Jun-Jul.
When updating all my files this month, couldn’t help but notice several government (and some private) issued inflation indices not updated or abandoned. Structural steel for bridges, IHS Power plant, Concrete pipe, Mortenson Nonres Bldgs, FHWA Highway

