Summary 2016 Construction Spending
9-7-16
Total Construction Spending for July reached a seasonally adjusted annual rate (SAAR) of $1.15 trillion, level with June which was revised upwards by $20 billion or nearly +1.8%. Monthly spending always gets revised in subsequent months. This year every month but May, which remained nearly unchanged, has been revised upwards, by an average of +1.4% and as much as 3.4%. Monthly values are subject to revision for two months after the first release and once again in May of the following year.
This plot, Construction Spending vs New Starts Cash Flows, shows actual spending (SAAR) by sector through July 2016 and projected trends of spending out to July 2017.

Previously I wrote that we should expect a short duration downturn in spending occurring between January and March. The expected monthly spending cash flows that would be generated from uneven new starts over the last two years indicated that a slowdown in spending would occur during the first quarter 2016. As it turns out, first quarter spending was much stronger than expected, averaging $1.17 trillion SAAR, primarily due to outstanding results in February and March for residential spending. But then April and May experienced significant declines, dropping to an average of only $1.14 trillion SAAR, down almost 3% from Q1. Now with June and July spending both up 1% from the April and May lows, it looks like we may be past that short duration downturn.
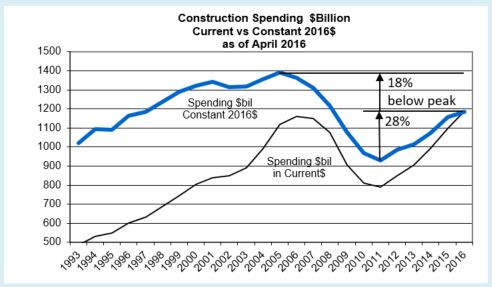
Total Construction Spending year-to-date (YTD) through July is up 5.6% over the same seven months 2015. Spending slowed in April and May from a 1st quarter average of $1.17 trillion that reached close to a 10 year high and falls just 4% short of the all-time high. However, it must be noted, that compares unadjusted current dollars, values of all dollars current in the year spent.
When comparing inflation adjusted constant dollars, all dollars adjusted to the same point in time, we can see 2016 spending is still 18% below the 2006 highs.
Total spending YTD through July is slightly ahead of what I predicted back in December, but it’s slightly below what I expected for May, June and July . I expect 2nd half spending to average above $1.2 trillion SAAR, but slightly lower than I originally forecast.
I’ve revised my 2016 spending forecast down slightly to total $1.190 trillion, up 7% from $1.112 trillion in 2015.
How does actual spending YTD compare to my prediction at the beginning of the year?
- Total predicted YTD through July $638.2b, actual YTD $647.7b (+$9.5bil, +1.5%).
- Residential predicted YTD $245.1b, actual YTD $259.2b (+$14.1bil, +5.8%).
- Nonresidential Bldgs predicted YTD $236.9b, actual YTD $228.1b (-$8.8bil, -3.7%).
- Non-building Infrastr predicted YTD $156.2b, actual YTD $160.5b (+$4.3bil, +2.8%).
Where are the revisions?
The single largest reduction in spending is in Nonresidential Buildings Manufacturing. Although there are other variances, that could account for the entire revision downward. Predicted construction starts for Manufacturing was lowered by nearly 35% after the initial start-of-year forecast was made.
Non-building Infrastructure spending increase is being supported by a 20%+ increase in power, which I didn’t expect. New starts for power projects have increased more than 20% since the initial forecast.
Residential construction had unusually large gains in February and March, almost all of that in residential renovations, offset only partially in April through July by declines mostly in new single-family housing.
Here’s my revised 2016 spending forecast based on YTD spending and new construction starts through July, compared to my prediction in December 2015.
- Total predicted Dec 2015 $1,206.2b, July 2016 $1,189.9b (-$16.3bil, -1.4%).
- Residential predicted Dec 2015 $473.8b, July 2016 $481.8b (+$8.0bil, +1.7%).
- Nonresdntl Bldgs predicted Dec 2015 $439.2b, July 2016 $410.9b (-$28.3bil, -6.4%).
- Non-bldg Infrastr predicted Dec 2015 $293.2b, July 2016 $297.3b (+$4.1bil, +1.4%).
Spending and construction starts are often confused by some analysts who refer to starts data as spending. Starts represent total project value recorded in the month the project begins. To determine spending activity, starts values must be spread out over the duration of the projects. Spending is dependent on cash flows each month generated from all previous construction starts. Cash flows expected based on Dodge Data construction starts are indicating a return to growth in spending in the 2nd half 2016. (See chart above Index Actual Construction Spending vs New Starts Cashflows).
Spending Breakout by Sector
Residential construction spending for July totaled a SAAR of $452 billion, remaining near level for the last four months. Residential spending YTD through July is up 6.5% over 2015. Spending slowed in April and May from a very strong 1st quarter average that reached close to a 10 year high. The current 3-month average is just 1% below the 1st quarter and is still at its highest since the 2nd half of 2007 but is 10% below the current dollar all-time high in 2006. I’m still expecting some upward revisions to June or July residential spending.
Residential spending just experienced the strongest three-year stretch of spending growth on record, up 60% in 2013-2014-2015. After taking out inflation, volume growth was only 31%, but that is still the strongest ever for three consecutive years. Spending growth in 2016 will reach only +9%. After adjusting for inflation that represents volume growth of less than +4%, the slowest in 5 years. New starts YTD (as reported by Dodge Data) although down from the 1st quarter, are still near post-recession highs. Starts from late 2015 and early 2016 will still be generating spending into early 2017. 2017 will repeat nearly identical to 2016. What we may be seeing is that it might be difficult to register another year of very high percentage growth in 2016 or 2017 because it is being measured against the 2015 10-year high. Another factor limiting very high growth may be a limited supply of labor to expand the workforce.
Total Nonresidential SAAR spending for July is $701 billion, down slightly from June, but monthly SAAR has varied only +/- 1% for the last six months. YTD spending compared to 2015 is up 5.1%. Nonresidential spending also slowed in April and May but is now up 1.5% from those lows. The current 3-month average is up slightly from the 1st quarter and is just 3% below the pre-recession 2008 current dollar high.
Nonresidential Buildings spending for July totaled a SAAR of $403 billion, down slightly from June but up 1.3% from the May dip. Spending YTD for nonresidential buildings through July is up 8.0% over 2015. The current 3-month average of $403 billion is up slightly from the 1st quarter but is still 9% below the peak in 2008.
Non-building Infrastructure spending for July fell to a SAAR of $289 billion, down only slightly over for the last four months. YTD spending through July is up only 1.3% over 2015. Spending began to slow in April and May and is now at the 2016 low. The current 3-month average is down 4% from the 1st quarter. However, spending on nonbuilding infrastructure reached an all-time high in the first half of 2014 and has remained near those highs through 2015 into the 1st quarter of 2016.
9-7-16
Public spending average for the 1st six months of 2016 is the highest since 2010 and is up 10% from the 2014 low point. YTD public spending is up 0.2% from 2015. All of Highway plus 80% of Educational makes up 55% of all public construction spending. The next largest markets, all of Sewage/Wastewater plus 70% of Transportation accounts for only 19% of public sending. All other markets combined make up less than 20%.
The biggest mover to total public spending this year is educational spending. Public educational spending is up only 4.0% YTD, but because it represents almost 25% of all public spending, it’s has a bigger net impact of +1.0% on moving the trend up than any other single public market. Public commercial spending is up 36.6% YTD but has only a 1% market share of public work. Highway and street is up 2.6% YTD. At 30% of total public that results in a net move of +0.8%. Office, public safety, power, sewage/waste disposal and water supply are all down YTD by a combined -5.3%. At a combined market share of 21% that nets a -1.1% reduction in YTD public spending.
Private spending is dominated by a 52% market share of residential work. At 6.6% growth that nets 3.4% growth in private spending. Several of the nonresidential building markets have high YTD growth (and/or a large market share of private work); lodging +30%, office +27%, Amusement +22%, commercial +10% and power +8%. These five markets combined represent 29% of private spending and combined are up +15% YTD for a net impact of +4.4% to private work.
For a base of reference, here’s a few points in spending history.
Total Construction Spending
- 8 years 1998-2005 up 77%
- 3 years 2003-2005 up 32%
- 3 years 2008-2010 down 30%
- 4 years 2012-2015 up 41%
Residential
- 8 years 1998-2005 up 133%
- 3 years 2003-2005 up 57%
- 3 years 2007-2009 down 60%
- 3 years 2013-2015 up 60%
Nonresidential Buildings
- 5 years 2004-2008 up 64%
- 3 years 2006-2008 up 45%
- 3 years 2009-2011 down 36%
- 2 years 2014-2015 up 25%
Non-building Infrastructure
- 7 years 1995-2001 up 56%
- 4 years 2005-2008 up 60%
- 3 years 2009-2011 down 8%
- 3 years 2012-2014 up 19%
