Construction Spending 2016 – Nonresidential Markets
9-8-16
Refer here to the Construction Spending 2016 Midyear Summary
Nonresidential Buildings
Nonresidential Buildings spending for July totaled a SAAR of $403 billion, down slightly from June but up 1.3% from the May dip. Spending YTD for nonresidential buildings through July is up 8.0% over 2015. The current 3-month average of $403 billion is up slightly from the 1st quarter but is still 9% below the peak in 2008.
How does actual spending YTD compare to my early 2016 forecast?
Nonresidential Bldgs predicted YTD $236.9b, actual YTD $228.1b (-$8.8bil, -3.7%).
Nonresidential Buildings spending for 2016 predicted in Dec 2015 $439.2b. Now with YTD data through July forecast spending for 2016 is $410.9b (-$28.3bil, -6.4%).
Total Nonresidential Buildings construction spending increased 9.7% in 2014 and 13.8% in 2015 and will grow 8.5% in 2016 and 6.3% in 2017.

Nonresidential Buildings Spending History
- 5 years 2004-2008 up 64%
- 3 years 2006-2008 up 45%
- 3 years 2009-2011 down 36%
- 2 years 2014-2015 up 25%
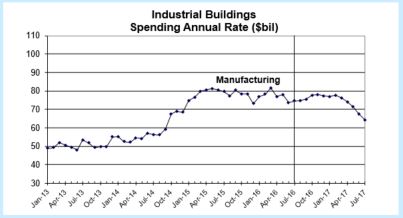
Manufacturing construction spending YTD is down 2.6% from 2015. However, that is because 2015 manufacturing construction spending reached all-time highs after record new starts in 2014, some of which will extend spending into 2017. 2016 is on track to reach the second highest year of spending on record, only slightly below 2015. Although new starts YTD in 2016 are down 75% from 2015, that will have most affect next year. A very large volume of starts in mid-2014 and early 2015 will generate spending extending into the 2nd half of 2016and early 2017. Total manufacturing construction spending for 2016 will finish 2% below 2015. Due to declining new starts in 2015 and 2016, spending in 2017 will drop more than 10%, and yet still be the 3rd highest year on record. Manufacturing construction represents 19% of total nonresidential buildings spending.
Office construction spending YTD is up 22% from 2015. Although new starts are currently down slightly from last year, starts are expected to grow 4% for 2016. Office starts have been strong since 2013. Vacancy rates peaked in 2010 and demand for office space has been increasing. A large component of office construction is data centers. Although we may see a few months of spending declines in late 2016, the large volumes of spending generated by several years of strong starts will keep total spending high. Office construction spending increased 23% in 2014 and 19% in 2015 and it will grow 23% in 2016 and 15% in 2017. Office construction represents 17% of total nonresidential buildings spending.
Commercial construction spending YTD is up 11% from 2015. Commercial new starts have been increasing slowly for the last 4 years. Spending will remain nearly flat for the next several months and is forecast to grow very slowly through mid-2017, then taper off slightly. Commercial construction had its biggest years in 2012-2013-2014 with growth of 11%, 12% and 18%. Total commercial construction spending for 2016 will finish 9% higher than 2015 and 2017 will grow 3% to 4%. Commercial construction represents 18% of total nonresidential buildings spending.
Lodging construction spending YTD is 29% higher than 2015. Lodging construction spending has exceeded the growth rate of all other markets. Starting in 2012 annual spending increased 19%, 25%, 24% and 30%. However, during that time lodging averaged only 5% of total nonresidential buildings spending. It now represents just under 7%. Total lodging construction spending forecast growth for 2016 is 25%. For 2017 expect spending growth of only 8%.

Educational construction spending YTD is up 4.8% from 2015. Educational buildings spending experienced the longest downturn of any market, declining for 5 consecutive years from 2009 through 2013. It has been slow to recover with 2015 showing the first real growth of only 4.8%. 2014 marked the beginning of the turn but registered growth of less than 1%. New starts posted 15% growth in 2014 and then slowed to only 4% growth in 2015. However, a large volume of those starts occurred in late 2014 and then again in early 2015. The timing of these starts generates a lot of spending in late 2016. I expect spending in the 2nd half 2016 to grow 5% over the 1st half. Total educational construction spending for 2016 will finish 8% higher than 2015 and 2017 will grow 9%. Educational construction spending is the largest component of nonresidential buildings representing 22% of total nonresidential buildings spending. Before the 5 years of declines it represented 30% of nonresidential buildings spending.
Healthcare construction spending YTD is up only 2.3% from 2015. Healthcare new starts since 2011 increased only in 2014. Spending may see some moderate declines in late 2016 before resuming slow growth in 2017. Changes and uncertainty in the healthcare climate are having a dampening effect on spending growth. Total healthcare construction spending for 2016 will finish only 2% higher than 2015 and 2017 will grow 3% to 4%. Healthcare construction represents 10% of total nonresidential buildings spending.
Amusement/Recreation construction spending YTD is up 10.1% from 2015. New starts were very strong in 2013 and 2014 and generated strong spending increases of 10% and 18% in 2014 and 2015. However, starts in 2015 declined slightly and 2016 starts to date have been flat. Spending through 2016 will remain strong but we will experience moderate declines in the 1st half of 2017. Total Amusement/Recreation construction spending for 2016 will finish 12% higher than 2015 but 2017 will grow only 2%. Amusement/Recreation construction represents 5% of total nonresidential buildings spending.

Non-building Infrastructure
Non-building Infrastructure spending for July fell to a SAAR of $289 billion, down slightly over for the last four months. YTD spending through July is up only 1.3% over 2015. Spending began to slow in April and May and is now at the 2016 low. The current 3-month average is down 4% from the 1st quarter. However, spending on non-building infrastructure reached an all-time high in the first half of 2014 and has remained near those highs through 2015 into the 1st quarter of 2016.
How does actual spending YTD compare to my early 2016 forecast?
Non-building Infrastr predicted YTD $156.2b, actual YTD $160.5b (+$4.3bil, +2.8%).
Non-building Infrastrusture spending for 2016 predicted in Dec 2015 $293.2b. As of July data forecast spending for 2016 is $297.3b (+$4.1bil, +1.4%).
Total Non-building Infrastructure construction spending increased 8.8% in 2014 but decreased 1.5% in 2015. It will grow only 1.2% in 2016 but then 9.6% in 2017.
Non-building Infrastructure Spending History
- 7 years 1995-2001 up 56%
- 4 years 2005-2008 up 60%
- 3 years 2009-2011 down 8%
- 3 years 2012-2014 up 19%
Power construction spending YTD is up 6.0% from 2015. Power new starts are erratic. Also some power projects are very long duration from start to finish. In 2012 starts totaled over $50 bil., in 2013 only $30 bil. and in 2014 less than $25 bil. In 2015 starts reached an all-time high of $56 bil. The power construction spending pattern for 2012-2015 was +30%, -4%, +18%, -16%. Many of the starts in 2012 supported 18% spending growth in 2014, yet not much of the record year of starts in 2015 supported spending in 2015. Although new starts in 2016 are forecast to drop by 30%, that’s still over $40 bil. and more than in 2013 or 2014. Part of the reason for a drop in spending in 2016 is the tailing off of projects that started in previous years combined with the fact that 2013 and 2014 were “lean” years. Cash flow of starts determines spending and it follows the erratic flow of starts. A very high volume of starts in early 2015 will generate spending extending out through 2019. I’m forecasting total power construction spending for 2016 will finish only 1.2% higher than 2015 and 2017 will increase 7%. Power construction represents 32% of total non-building infrastructure spending.
Highway/Bridge/Street construction spending YTD is up only 2.5% from 2015. Some highway and street projects are long duration from start to finish. Although new starts in 2015 increased by 11%, that was significantly unbalanced with two very high months of new starts in the 1st quarter and below average starts for almost the entire 2nd half of 2015 and the 1st half of 2016. The very high months have starts with much longer duration so do not add significantly to monthly spending, they spread the spending over a longer period of time. Spending has declined in 8 out of the last 12 months. I’m expecting declines in 6 out of the next 12 months. Yet the plus months will still carry both 2016 and 2017 to spending growth. I’m forecasting total highway/bridge/street construction spending for 2016 will finish 4.5% higher than 2015 and 2017 will increase 8%. Highway/Bridge/Street construction represents 32% of total non-building infrastructure spending.
Transportation/Air/Rail construction spending YTD is down 2.4% from 2015. YTD spending is 9% lower than what I had predicted in my early 2016 forecast. There is a disconnect between where Dodge reports transportation starts and how U S Census reports transportation spending, so it is difficult to directly relate the two. I’m forecasting total transportation construction spending for 2016 will finish 2.5% higher than 2015 and 2017 will increase 6%. Transportation construction represents 16% of total non-building infrastructure spending.

