1-7-17
This is my initial forecast for 2017. Census final revisions to Oct., Nov. and Dec. 2016 spending will not be posted until February, March and April. I will then update the 2017 forecast to reflect better input. Then, with the June 1, 2017 release of spending, Census will post revisions to all 2016 spending. The 2016 record will then be updated.
2-1-17 Updated to include Dec 2016 data
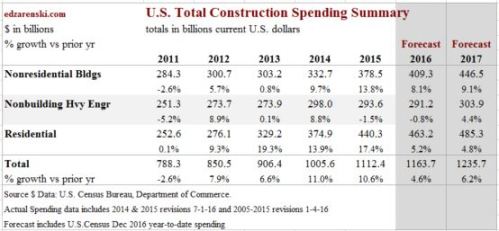
Total construction spending in 2017 will reach $1,236 billion supported by a 4th consecutive year of strong growth in nonresidential buildings. The monthly rate of spending will range from near $1.2 trillion in January to $1.3 trillion at year-end.

Nonresidential Buildings spending in 2017 will increase to $447 billion, 9.1% over 2016. The most recent 3-month average seasonally adjusted annual rate (SAAR) is $420 billion, only 5.5% below the peak of $444 billion in 2008. By midyear 2017 the SAAR will reach a new all-time high and it will finish the year near a SAAR of $460 billion. Office spending will lead 2017 with 30%+ growth. Commercial, Lodging and Educational markets are all expected to post strong gains over 10%.
For details on Nonresidential Buildings, See Behind The Headlines – Nonres Bldgs Construction Spending and Nonresidential Bldgs 2017 Forecasts Comparisons
Non-building Infrastructure, following two down years, will increase by 4.4% to $304 billion, due to growth in the highway and transportation markets. In the most recent quarter spending began to recover from 2016 lows posted in August and September. 2017 will be a record year for Infrastructure spending supported by spending generated from the Fixing America’s Surface Transportation Act and potentially the Water Resources Development Act.
For Non-building Infrastructure details see Infrastructure Outlook 2017
Residential will increase only moderately to $485 billion, adding 4.8% over 2016. That follows on three years of substantial growth averaging 17%/year. More than any other sector residential work is more dependent on new starts within the current year to generate spending, approximately two thirds of all spending within the year.

Office building new starts through August were up only 6% year-to-date but starts in September reached the highest in years. The 2016 starts finished at +37% providing the highest amount of work in backlog going back at least 8 years. Lodging starts in 2016 finished up nearly 40%, Healthcare up 20% and Amusement/Recreation up 35%.
Power project starts dropped 30% in 2016 but from the highest amount of starts on record in 2015. In addition, power had very strong starts in late 2014. All of those very strong starts in late 2014 and all of 2015 are still ongoing in backlog and will contribute to positive spending in 2017. Almost half of all the spending in 2017 is generated from projects that started in 2014 and 2015.

See Also 2016 Construction Spending 1-3-17
