1-12-16
This is a pretty straight forward analysis. If productivity is to remain the same, then jobs need to grow by the same percentage as volume. If volume grows faster, then productivity increases. If jobs grow faster, then productivity declines. Let’s have a look at the numbers to find out what’s been going on and where we might be headed. Spending forecasts will give the basis for predicting jobs growth.
A few weeks back I commented on a study published by Bureau of Labor Statistics on how many construction jobs would be created by 2024. BLS Says +790,000 Construction Jobs by 2024. Let’s Look Behind The Headlines. Now that I’ve completed updating spending and jobs data and developed a forecast for 2016-2017, I will show what has taken place over the last 4 years and what to expect for the next two years.
Here’s what we know.
Volume is not the same as construction spending. Spending is the number nearly everyone follows. Volume is spending minus inflation. I use composite inflation factors based on tracking numerous construction selling price indices.
In 2015 nonresidential buildings spending grew by 17%, but after inflation, volume grew by only 12%. Overall construction spending in 2015 grew by 11%. Total all construction volume grew by 8%. Annual construction inflation varies for residential, nonresidential buildings and nonresidential infrastructure.
For the four years 2012 through 2015 construction spending grew by 35% but after inflation volume grew by 21%.
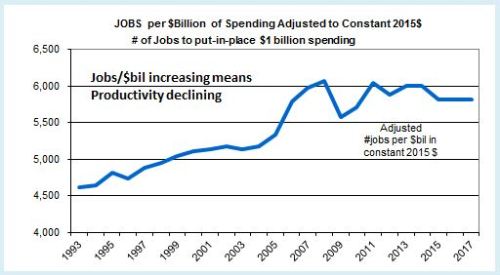
Work output grows by number of new jobs added and by any increase in total hours worked. For the four years 2012 through 2015 construction jobs increased from 5.5 million to 6.4 million, or 16%. In addition hours worked by the entire 6 million workforce increased by 2%. So effectively, total workforce output increased by 18%.
The last four years volume grew 21% and the effective number of jobs grew 18%. There was an increase in productivity over this four year period of 3%. An increase in productivity occurred because we put-in-place more volume than the (effective) number of jobs added.
Now we can ask the question, “How many construction jobs will be added in the next two years if we achieve the spending forecast?”
Let’s use what we know and apply it to the forecast.
I’m forecasting 10% spending growth in 2016 and 12% in 2017. I anticipate higher inflation than we have experienced in the last few years. After inflation, volume should grow 4% and 6%. So, total volume growth for the next two years is forecast 10%.
With rapid growth, I would expect productivity to decline slightly, but the last 4 years of growth showed a slight productivity gain, so let’s go with that. That means we will lower our estimate of jobs needed because some of the increased volume over the next 2 years will be supported with increased productivity.
Total volume growth for the next two years is forecast at 10%. If we follow the same pattern as the last 4 years, we may see an increase in productivity of 2%. So we need only an 8% increase in workforce output to put-in-place the forecast volume. The average number of jobs for 2015 is 6.4 million. An 8% increase in 2 years on the 6.4 million means we need to add 512,000 jobs in 2016-2017.
If we do not see gains or losses in productivity we need to add 10% to jobs, the same percentage jobs as we have volume growth. That would be 640,000 new jobs in 2016-2017.
As a result, based on this analysis expect a need of about 500,000 to 600,000 new construction jobs in the next two years.
For comparison, in 2014-2015, 601,000 new jobs were added. Then, spending grew 20% but volume after inflation was 12%. Jobs grew by 10%.
Jobs have increased more than 600,000 in two adjacent years only a few times. Any two years within 1996-1998 were over 600,000, also 83-84 and 93-94. The highest ever was 1998-99 when we added 770,000 new jobs, and that two year period had the same total jobs as 2014-2015. The only other recent high periods are 2004-05 added 700,000 and 2014-15 added 601,000.
Also, it’s easy to see now, had this been based on total spending increases for the two years rather than volume, the need would be 20+% or 1.0 to 1.2 million jobs, not just the 8% or 10% jobs growth used here. The last time jobs grew by more than 10-12% in two years was 1977-1978 at 18% and the highest growth ever was 770,000 jobs added in 1998-99, the only time over 700,000. So, as expected, 20+% growth and a million jobs in two years has never been reached.
BLS predicted construction will add 790,000 jobs over 10 years, the period from 2015 through 2024. In 2015 we’ve already gained 260,000 jobs so that would leave 530,000 new jobs expected over the remaining 9 years.
The spending forecast and past job growth patterns indicate that we will add far more jobs and much faster than is predicted by BLS.
Of course, another recession would alter this, but this is not based on another recession.

[…] to 20%, BUT construction volume will increase only 10%, most of that in 2017. In a previous post, “How Many Construction Jobs Will Be Needed” I predicted jobs will grow by 500,000 to 600,000, only about […]
LikeLike