The good news is 2016 construction spending will be up across the board, although growth will vary between the three major sectors, residential, nonresidential buildings and nonresidential infrastructure. This post is about how we will get there.
This plot shows a three year pattern of spending for nonresidential construction. The seasonally adjusted annual rate is plotted every month and the horizontal bars show the total average spending for each year.
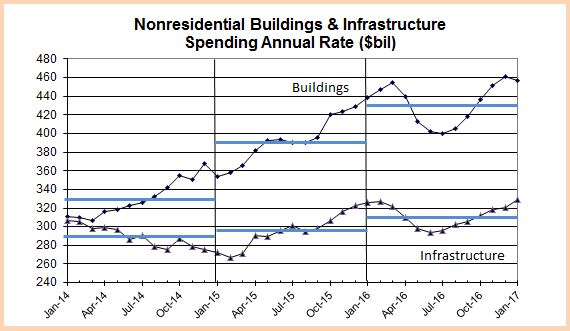
I often include a linear trend line in my plots because it’s good to be reminded of the long term direction and rate of growth rather than the monthly fluctuations. I’ve removed the trend lines from this plot to make a point. A fairly typical growth year shows spending finishing the year at a higher rate than when we started. The total spending for the year (shown by the horizontal bars) is the sum of the unadjusted monthly values, which is the same as the average of the monthly adjusted rates of spending. The plot above shows spending for buildings totals of $330 billion in 2014, $390 billion in 2015 and $430 billion in 2016.
If spending always occurred evenly we would see a smooth constant slope plot line indicating the rate of growth, sometimes punctuated with minor monthly declines but over the long term up at a constant rate. The plot for buildings shows a pretty constant growth pattern from March 2014 to March 2016. We see a few slight monthly dips and a flat spot in mid-2015, but overall fairly constant growth.
That will all change in 2016.
The plot shows both buildings and infrastructure will experience multi-month declines in 2016. By midyear both will dip so low that the year over year comparison will drop to near zero percent. Spending on buildings will drop more than 10% from the 1st quarter 2016 high to the midyear low. (edit 11-16. Most recent analysis is showing the nonresidential buildings peak and drop is moved out about 4 to 6 months. The plot above does not reflect this most recent analysis.) Infrastructure will drop in a similar pattern but not as dramatically. Both will resume growth and finish the year at or near the yearly high. Together these major sectors make up 60% of total construction spending with residential being the other 40%. The magnitude of these declines will be large enough to drag total construction spending down for the period, but it too will resume growth and finish the year well above where it started.
What causes that pattern?
Spending in any given month is the sum total contributed by all the projects that started and are currently underway. That includes spending from projects that started recently with foundations just coming out of the ground and also projects that started 18 to 24 months ago that are near completion and near ready for occupancy. Spending is affected by the pattern of starts recorded over the previous 24 months. Only if that pattern is even in growth will spending be even in growth.
Let’s make some assumptions for an example that should be easy to understand.
- All projects take 20 months to build.
- The construction budget gets spent at a constant rate of 5% per month.
Of course, reality never occurs as simple as that, but it makes for an easy to understand example. With these simple assumptions we know this about spending;
- Every month includes some spending from all starts over the previous 20 months.
- New starts in any given month contribute only 1/20th or 5% to total spending that month.
- Predicted spending 3 months out includes only 15% from new starts, 4 months out 20%, etc.
Now, back to reality.
Nonresidential buildings spending in 2016 includes projects that started all the way back to mid 2014. From April 2014 to April 2015, concentrated mostly in mid to late 2014, there were several instances where monthly starts exceeded the previous month by 50%-60%, then settled back. Those were great months and indicated a huge growth spurt in nonresidential building construction. We see that growth from early 2014 all the way up to a peak in early 2016. Nonresidential buildings spending experienced growth of 9% in 2014 and 19% in 2015, with 9% growth predicted for 2016.
We don’t typically see a seesaw pattern in spending from the starts when all the projects are ongoing at the same time, we see flatter and steeper rates of spending growth. The six biggest months from that period averaged more than 30% higher than the current rate of new starts growth. So we’ve had a pause in the rate of increase for new starts. We see the big affect on the spending pattern when a very large volume of spending from starts 18 or 24 months ago reaches completion and drops out of the current month spending. That is what will happen in 2016.
New 2016 nonresidential buildings starts is not the cause of a 10% dip in spending in 2016. It is the completion of a very large volume of starts from 2014 that will no longer be contributing a large share to monthly spending. That will work itself out by year end. But for those who do not look at the patterns that contribute to current spending it will create quite a stir. Three to five months of consistent declines in spending will look like the end of recovery in nonresidential construction. It is not the end.

