LINK to most recent articles on inflation 2019
11-17-2015
( Also See 1-31-2016 comments and chart on inflation )
Over the last 24 months work volume has increased and short-term construction inflation has increased to more than double consumer inflation. It appears construction inflation is already advancing faster than and well ahead of consumer inflation, which supports that consumer inflation is not an indication of movements or magnitude of construction inflation.
It is always important to carry the proper value for cost inflation. Whether adjusting the cost of a recently built project to predict what it might cost to build a similar project in the near future or answering a client question “What will it cost if I delay my project start by one year?”, whether you carry the proper value for inflation (which can differ every year) can make or break your estimate.
- Long term construction cost inflation is normally about double consumer price inflation (CPI).
- Since 1993 but taking out 2 years of recession (-8%), the 20-year average inflation is 4.2%.
- Average long term (30 years) construction cost inflation is 3.5% even with any/all recession years included.
- In times of rapid construction spending growth, construction inflation averages about 8%.
- Although inflation is affected by labor and material costs, a large part of the change in inflation is due to change in contractors/suppliers margins.
- When construction volume increases rapidly, margins increase rapidly.
- Construction inflation can be very different from one major sector to the other and can vary from one market to another. It can even vary considerably from one material to another.
In the 5 years of rapid growth in spending for nonresidential buildings from 2004 through 2008, nonresidential buildings cost inflation totaled 39%, or averaged ~8% per year.
In the 6 years of spending during the residential construction boom from 2000 through 2005, residential building cost inflation totaled 47%, or averaged ~8% per year.
Neither the producer price index (PPI) for construction inputs nor the CPI are good indicators of total construction cost inflation.
Some construction cost indices include only the cost changes for a market basket of labor and materials and do not include any change for margins. Those indices are not a complete analysis of construction cost inflation.
Construction cost inflation must include all changes related to labor wages, productivity, materials cost, materials availability, equipment and finally contractors margins. Margins are affected by the volume growth of new work and demand for new buildings. So be sure to verify what is included in any cost index you reference for real construction cost inflation.
For the last three years residential construction inflation has averaged 5.7% and nonresidential buildings inflation has averaged 4.2%. Nonresidential buildings cost inflation has increased for five consecutive years. Both are likely to increase next year since anticipated volume in both sectors will grow next year.
In my construction spending data set, which goes back to 1993, there were six years with greater than 9% spending growth. By far the largest spending growth years were 2004 and 2005, 11.2% and 11.5%. We are about to repeat that historic level of spending growth. I am predicting 2015 will finish with growth of 11.6% and 2016 will experience 11% growth.
(8-12-16) 2015 finished at 10.6% because 2014 was revised up. Construction spending for 2016 will probably finish closer to 8%.
I expect historic levels of growth in spending will be accompanied by inflation relative to historic high growth periods. Don’t expect long term average inflation in high growth periods. Don’t be caught short in your construction cost budgets!
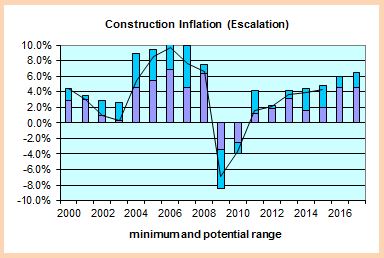
Graphic updated 1-8-16
The chart shows the low and high range of various independent nonresidential buildings construction actual cost indices. In 2015, the range of estimates was from 2% to 5%. The actual inflation came in at 4%. The plotted line is my result of where inflation actually ended up. A chart for residential construction would show much different values.
( Also See 1-31-2016 comments and chart on inflation )
