October housing starts released Nov. 18th didn’t come in as expected. The annual rate for October is 1,060,000 new starts vs 1,191,000 in September and 1,079,000 in October last year. BUT look a little deeper than just one month.
The last 4 months of starts have been pretty high, averaging 14% higher than the previous 4 months and 16% higher than the same 4 months last year.
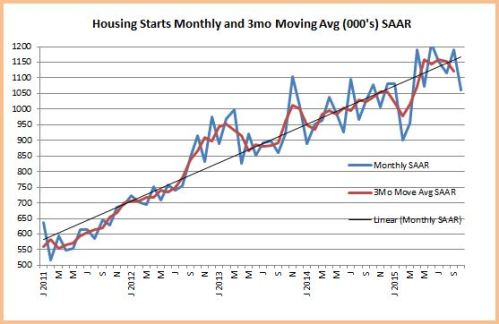
Take a look at this chart. Monthly starts periodically peak and dip erratically. Look at February 2015, the biggest dip in 5 years. But then notice it took less than 4 months for starts to come right back to the trend line and the trend remained intact. This is how the monthly housing starts data goes.
So don’t get too alarmed over one month of data. Now if this downward trend were to continue for several months, go ahead get concerned, but that hasn’t been the pattern.