1-16-17
tables updated 2-1-17
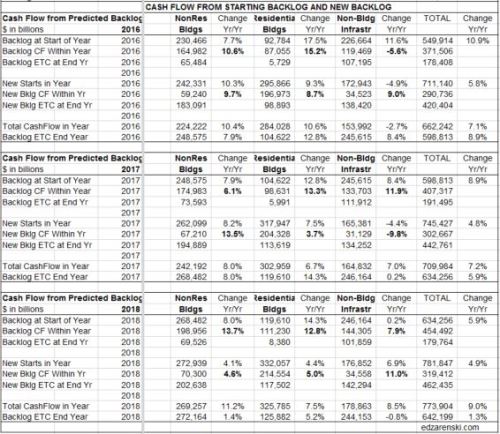
New Backlog is the total value of project revenues under contract that are about to start construction, or new starts. The entire value of a project is considered in backlog when the contract is signed. Projects booked in December 2016 or before are in backlog at the start of 2017. Simply referencing total backlog does not give a clear indication of spending within the next calendar year. Just because backlog is up going into a new year does not necessarily mean revenues will be up that year. You must understand some very important distinctions about backlog to determine how much revenue will occur within the next year.
Projects, from start to completion, can have significantly different duration. Whereas a residential home may have a duration of 8 or 9 months, an office building could have a duration of 18 to 24 months and a billion dollar infrastructure project could have a duration of 3 to 4 years.
Backlog at the start of 2017 could include revenues from projects that started last month or as long as several years ago. For a project that has a duration of several years, the amount in starting backlog at the beginning of 2017 is not the total backlog amount recorded for the project at its start date, but is the amount remaining to complete the project or the estimate to complete (ETC).
The only way to know how much of total backlog that will get spent in the current year and following years is to prepare an estimated cash flow from start to finish for all the projects that have started in backlog. Then add up the amounts from all projects in each month to find the cumulative cash flow in that month, or in that year.

Construction Starts provide the values entering backlog each month. Except for residential, new project starts within the year contribute a much smaller percentage to total spending in the first year than all the backlog ETC on the books at the start of the year. New residential projects contribute the most to spending within the year started because generally residential projects have the shortest duration. Residential projects started in the first quarter may reach completion before the year is over. New infrastructure projects generally have the longest duration and may contribute some share of project value to backlog spread over the next several years.
The distinction between backlog, backlog ETC and cumulative cash flow is necessary to predict spending. For example:
We start the year with $100 billion of residential projects in backlog and $100 billion of infrastructure projects in backlog. All of the residential projects could have durations of 12 months or less. Therefore residential spending could total $100 billion within the year. However, the infrastructure projects could have durations of 2 years, 3 years or 4 years. Spending from infrastructure backlog this year might total only $50 billion with $30 billion in spending occurring next year and $20 billion the following year. Although both sectors start the year with the same total amount in backlog, we can see the amount spent within the year is determined by the duration of the projects and the cash flow schedule.
Backlog totals may not be a good indicator of total revenue spending within the year. In fact, backlog could be up and total revenues for the year could end up lower than the previous year. Unless you have a clear picture of the types and duration of projects that make up the backlog, you will not have a clear picture of spending activity in the coming year.
See Also Construction Backlog 2017 3-21-2017
