Construction spending may reach historic growth in 2016.
There are currently six estimates available forecasting 2016 total construction spending ranging from 6% to 10% growth, with an average of 8.7%. My forecast is 9.7%.
Total construction spending, forecast to grow 9.7% in 2016, could reach a total 30% for the three years 2014-15-16. The only comparable periods in the last 20 years are 29% in 2003-04-05 and 27% in 2013-14-15.
The current nonresidential buildings construction boom could become an historic expansion. Nonresidential buildings spending is forecast to grow 13.7% in 2016. Added to 8.8% in 2014 and 17.1% in 2015, the three-year total growth could reach 40% for 2014-15-16. The only comparable growth periods in the last 20 years are 40% in 2006-07-08 and 32% in 1995-96-97.
For perspective, residential spending increased 46% in 2013-14-15, similar to only one comparable period in the last 20 years, 48% in 2003-04-05.
Non-building infrastructure projects, in two of the last three years have barely shown any gains entirely due to declines in power plant projects. This will repeat in 2016.
This is still the 1st or 2nd most active 3 year period of growth in construction in more than 20 years, and it’s already been ongoing since 2013-2014. With the forecast for 2016, spending growth could reach a new three-year high.
From the middle of Q1 2016 to the end of Q3 2016, total spending will post six to eight months at an annual growth rate of 20%, but due to the dips at the beginning and the end of the year, total 2016 construction spending will finish at 9.7% growth. Construction spending momentum is not yet losing steam. We may be seeing the effects of a few years of erratic growth patterns and a shift from more rapidly changing commercial and residential work to slower growth institutional work.
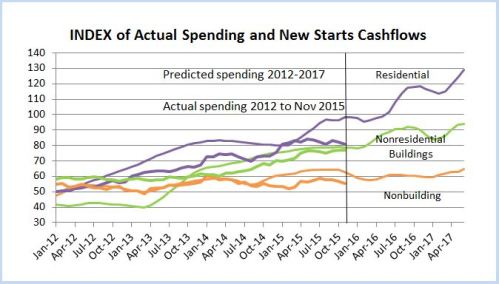
Residential spending will slow several percent early in 2016 before resuming upward momentum to finish the year with 12% growth, slightly less than growth in 2014 and 2015. Periods of low new start volumes need to work their way thru the system and this produces growth patterns with periodic dips. The upward momentum will carry into 2017.
Nonresidential buildings spending will slow moderately in the next few months before we see a 15% growth rate through the middle of the year, only to see another slowdown late in 2016. Major contributions are increasing from institutional work in educational and healthcare markets. Office, commercial retail, lodging and manufacturing will decline considerably from 2015 but still provide support to growth.
Infrastructure projects spending will decline over the next six months due to the ending of massive projects that started 24 to 42 months ago. There will be large advances in spending midyear before we experience another slowdown later in 2016. Following a 0.5% increase in 2015, spending will increase only 1.2% in 2016, held down by a 10% drop in power projects, the second largest component of infrastructure work.
Construction added 1.0 million jobs in the five years 2011-2015. 800,000 jobs were added in the last three years. To support forecast spending, jobs need to grow by 500,000 to 600,000 in 2016-2017. Growth in nonresidential buildings and residential construction in 2014 and 2015 led to significant labor demand which has resulted in labor shortages in some building professions. Demand in 2016-2017 will drive up labor cost and may slow project delivery.
Spending growth, up 35% in the four-year period 2012-2015, exceeded the growth during 2003-2006 (33%) and 1996-1999 (32%) which were the two fastest growth periods on record with the highest rates of inflation and productivity loss. Construction spending growth for the period 2013-2016 is going to outpace all previous periods.
Construction inflation is quite likely to advance more rapidly than some owners have planned. Long term construction cost inflation is normally about double consumer price inflation. Construction inflation in rapid growth years is much higher than average long-term inflation. Since 1993, long-term annual construction inflation for buildings has been 3.5%, even when including the recessionary period 2007-2011. During rapid growth periods, inflation averages more than 8%.
For the last three years the nonresidential buildings cost index has averaged just over +4% and the residential buildings cost index just over +6%, however, the infrastructure projects index declined. The FWHA highway index, the IHS power plant index and the PPI industrial structures and other nonresidential structures indices have all been flat or declining for the last three years. This provides a good example for why a composite all-construction cost index should not be used to adjust costs of buildings. Infrastructure project indices often do not follow the same pattern as cost of buildings.
Anticipate construction inflation of buildings during the next two years closer to the high end rapid growth rate rather than the long term average.
