2-2-23
Total construction spending in 2023 will increase only 4.2% over 2022. Nonresidential Buildings will lead construction spending in 2023 with a forecast gain of 18%.
The last two years, 2021 and 2022, total spending increased 8.5% and 10%. However, inflation in 2021 was 11% and in 2022 was 15%, both higher than spending. Real construction volume for the year is spending without the inflation. The volume of work completed in 2021 is 11% less than 2021 spending and in 2022 is 15% less than the total of 2022 spending.
The rate of construction spending in 2023 will be influenced predominantly by a 38% increase in new nonresidential building starts in 2022. In fact, even more meaningful, Nonres Bldgs new starts, in 2nd half 2022, averaged 68% higher than any other 6mo period in history. In recent years, new starts averaged $300 billion/year. In the 2nd half of 2022, starts averaged over $500 billion/year. Many of the projects peak spending will occur in 2023. Some will occur in 2024. Total spending forecast for Nonres Bldgs in 2023 is $616bil, an increase of 18.5% over 2022.
Growth in Manufacturing construction starts for 2022 far surpasses growth in any other market, up over 150%. Total new starts for the past 2 years is up over 400%. It will take at least a year to determine how much of that growth is an increase in total new construction and how much is an increase in capture of data in the starts survey.
Non-building starts for 2022-23 are forecast up 50%. Spending 2023-24 is forecast up 23%.
Non-building Infrastructure will post the 1st year of sizable gains since 2019, forecast at $400bil, up 9.6% in 2023. In 2022, Highway and Public Utilities posted strong gains of 9.0% and 16.5%, but those gains were offset by a 9.0% decline in Power. For 2023, Highway and Transportation recorded the strongest starts in five years. All markets post spending gains, with Highway up 12.0%, Transportation up 15.0% and Public Utilities up 11.5%.
See this discussion on Infrastructure and Jobs here
Infrastructure Constr Expansion – Not So Fast
Residential starts in 2021 were up +21% to what was then a new high. Starts peaked in the 1st half 2022 then started a decline in 2nd half 2022. By Q4’22, the rate of new starts dropped by 20%. Starts are forecast down 2% in 2023.
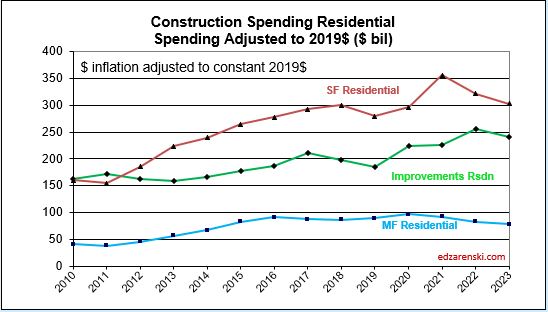
After three years of gains totaling 64%, expect residential spending to decline 6% in 2023. Single Family (47% of rsdn) spending peaked in April and since is down 20% in eight consecutive months. Multi-family (15% of rsdn) is up 11 consecutive months, now up 19% from January 2022. Reno/Rpr (38% of all rsdn) is up 25% for the year, but in the last five months, the rate of spending has fallen 15%. Only multi-family is currently trending up. 75% of all gains in multi-family occurred in the 4th quarter.
For the past 3 years, 2020-2022, Reno/Repair construction spending has gone up 1.26 x 1.16 x 1.25 = 1.8x, or 80%. Spending is currently down 17% from the peak in 4 of the last 5 mo. If the SAAR were to stall where it’s at now for the rest of 2023, spending will be down 10% for the year and will still be up 1.65x over last 4 years. Sure, it’s down, but it’s still high.
Residential spending grew 44% in the last 2yrs, but inflation was 30% of that 44%.
The annual rate of spending in all Nonresidential Buildings markets increased from Q1 to Q4 2022 and also Q4 spending in every market was higher than the average for 2022. Heading into 2023, nonresidential buildings markets start out the year with the annual rate of spending already 8% higher than the average 2022, and the trend has been up. The annual avg is usually much higher than Jan of the year, so I’d expect 2023 to come in higher. Although there are a few moderate dips in spending in some markets during the year, every market adds growth in 2023.

NOTE: The Census spending release on 2-1-23 is the 1st release to capture Dec data and therefore all months in 2022. The 3-1-23 release will revise both Dec and Nov. The 4-1-23 release will revise Dec. And the 7-1-23 release will revise any/all months needing further revision in both 2021 and 2022, sometimes with hefty changes. Historically, revisions are predominantly UP.
See Behind The Spending Forecasts
for a table showing the annual rate of spending for each market in the 4th qtr compared to the 2022 average. That’s the rate of spending starting out 2023.
Starting out the year with (Dec’22) an annual rate of spending already averaging 8% greater than 2022, coupled with 38% growth in new starts in 2022, much of which will be spent in 2023, produces the strongest year of growth in nonresidential buildings construction spending since 2007.
3-1-23 Surprises in the Census Construction Spending for Jan.
Nonres Bldgs January 2023 spending begins the year at a rate up 16% vs avg 2022 and up 23% YTD vs Jan 2022. Just one month ago the Dec. rate of nonres bldgs spending was only 8% higher than the average of 2022. This is Nonres Bldgs construction spending best start to the year since my records back to 2001. All indications are spending will increase throughout the year. I had forecast Mnfg in 2023 up 35% and total Nonres Bldgs up 18%. Now I have Mnfg up 40% and Total Nonres Bldgs up 20%.
If spending continues to increase at even a moderate pace, we could see the year end with Mnfg spending up 45% and total Nonres Bldgs spending up 25%.
- Mnfg starts Jan +54% ytd and +33% vs avg 2022.
- Comm/Rtl starts Jan +23% ytd and +18% vs avg 2022.
- Lodging starts Jan +42% ytd and +18% vs avg 2022.
- RSDN starts Jan -6% ytd and -5% vs avg 2022.
- Highway begins 2023 +16% ytd and +8% vs avg 2022.
- Power begins 2023 -5% ytd and +3% vs avg 2022.
- Transportation begins 2023 +10% ytd and +14% vs avg 2022.
Part of the Mnfg +54% can be explained due to the very low Jan’22. That evens out in Q4, when 2022 inflation jumped, so 2023 comparisons won’t be as high.
Below, the enlarged scale gives a better look at nonresidential Bldgs spending.

To fully understand the forecast it is necessary to discuss the impact of inflation. Construction spending includes inflation. Inflation adds nothing to business volume. Spending minus inflation gives volume. Growth, or decline, in business volume measures the actual activity growth in the construction industry. Spending measures the amount of revenue that exchanged hands to make it happen.
2-6-23 Current and predicted Inflation updated to Q4’22
- 2020 Rsdn Inflation 4.6%, Nonres Bldgs 2.4%, Nonbldg Infra -0.3%
- 2021 Rsdn Inflation 13.9%, Nonres Bldgs 7.6%, Nonbldg Infra 7.9%
- 2022 Rsdn Inflation 15.7%, Nonres Bldgs 12.3%, Nonbldg Infra 13.8%
- 2023 Rsdn Inflation 1.7%, Nonres Bldgs 4.2%, Nonbldg Infra 4.3%
Although input costs have been dropping and final demand (Nonres Bldgs) increases have been slowing, 2023 demand for nonresidential construction is going to post the largest annual spending increase ever recorded. This could reverse the trend in Nonres pricing and keep inflation higher for Nonres Bldgs.
Inflation adjusted volume is spending minus inflation. Volume of work (spending minus inflation) is what drives the need for jobs.
- Total volume for 2021 fell 1.9%, Rsdn +10%, Nonres Bldgs -13%, Nonbldg -8%.
- Total volume for 2022 fell 2.3%, Rsdn -1%, Nonres Bldgs +1%, Nonbldg -9%.
- Total volume forecast 2023 is flat at 0%, Rsdn -10%, Nonres Bldgs +13%, Nonbldg +4%.
Because 2022 inflation was so high (12% to 15%), the adjustment to 2022 spending resulted in much lower volume. In 2023, spending is forecast up 4.2% (compared to last year spending) and forecast inflation is 2% to 5%. 2023 inflation reduces spending far less than what occurred in 2022. Volume gets compared to volume the previous year. Therefore volume in 2023 shows an unusually large increase compared to volume in 2022.
SEE Construction Inflation 2023
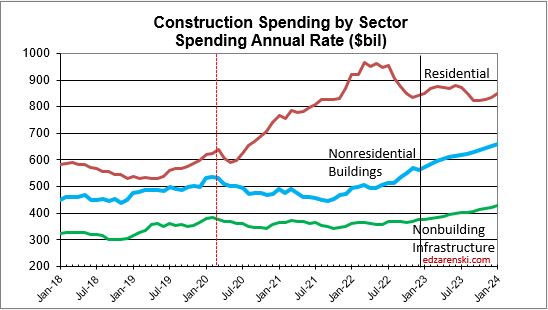
for the details of inflation costs, but here are plots of the same information as the two plots above, only difference being the plots above are Current$, dollars as reported in the current year as reported by Census, and the plots below are constant$, inflation $ has been removed. The plots below actually measure the real growth from year to year. For example, while the plot above shows residential growth in spending increased from $600 billion in Q1 2020, to $900 billion in 2022, the plot below shows most of that was inflation and after removing inflation, residential construction did increase in early 2022 but by Q1 2023 has dropped back to the same level it was at in Q1 2020.

Below, the enlarged scale gives a better look at nonresidential Bldgs volume.

Recent construction annual rate of spending is only 17% higher than March 2020, but overall total construction spending is up 30% for 2020-21-22. In that three year period there was 32% inflation, half of that in 2022. So, all of the 30% spending gain is inflation, there is no gain, (a slight drop of -2%) in volume for that three years. Residential spending increased more than 60% with rsdn inflation near 40%, so rsdn volume increased 20%. Rsdn jobs growth is near even on track with volume, but Nonres and Nonbldg jobs did not fall when volume dropped.Nonresidential had 10% volume decline in 2021. Nonres now has a volume deficit vs jobs, compared to at the end of 2019.
For a discussion of inflation effects on jobs growth visit this link where this chart will be discussed.
SEE Construction Spending – Volume – Jobs


Hi Chris,
One of the things we see in the PPI reports is Final Demand pricing finally catching up to material price cost increases. However, several indices do show slowing down from beginning of year to most current. The PPI indices most up-to-date values show a drop from 5% or 6% per quarter in the 1st half of the year to 3%/qtr in the 2nd half. RS Means dropped from 3.5%/qtr to less than 1%.Most indices do not hazard a guess at future Inflation. I’m expecting and carrying a big drop to 4% or 5% for 2023.
LikeLike
Hi Ed:
How is escalation being considered in the non-residental spending growth projections for 2023? ENR has very low increases over the last few months, which would seem likely to continue.
LikeLike