2-1-23
Initial Year end construction spending for 2022 is out today. This is when I compare my forecast for 2022 spending to all my prior monthly forecasts during the year AND I compare my midyear forecast prepared in May-June to the forecasts published at midyear in the AIA Consensus Construction Forecast. You can judge how I’ve measured up to forecasts thru the year.
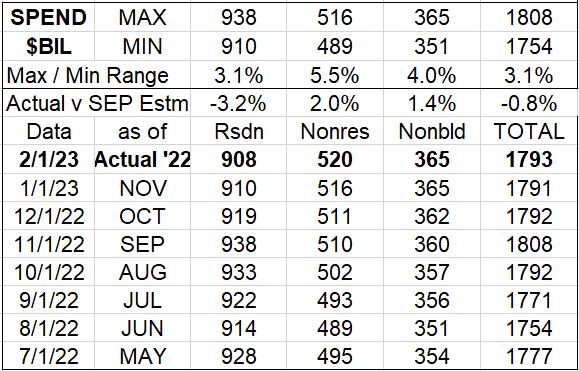
This 1st table shows just the sum total in each sector for each monthly forecast I produced during the year. This year was quite unique in that new construction starts for nonresidential work increased by 60% in the 2nd half of the year, a magnitude of increase never before experienced. No one could have predicted that.
In this table I compare the actual for 2022 to the September forecast. My data analysis of 20 years of input shows that a particular set of months through and including September has forecast the end of year spending within 1.5% for nonresidential and within 2% for residential. You can see with the initial data for 2022 that the Sept forecast was within 3.2% for residential and within 2.0% for Nonres Buildings. Nonbuilding Infrastructure came in under the 1.5% threshold.
This next table is shows my midyear forecast for total 2022 spending compared to the forecasts published in the AIA Midyear 2022 Consensus. I’ve highlighted in green the closest estimate to the actual end-of-year spending report. In red is the worst forecast at midyear. This is the 3rd consecutive year that I’ve beat all the forecasts in the AIA Consensus. In fact, looking back at 2015-2019 there are several other years in which I beat out the AIA Consensus estimates.

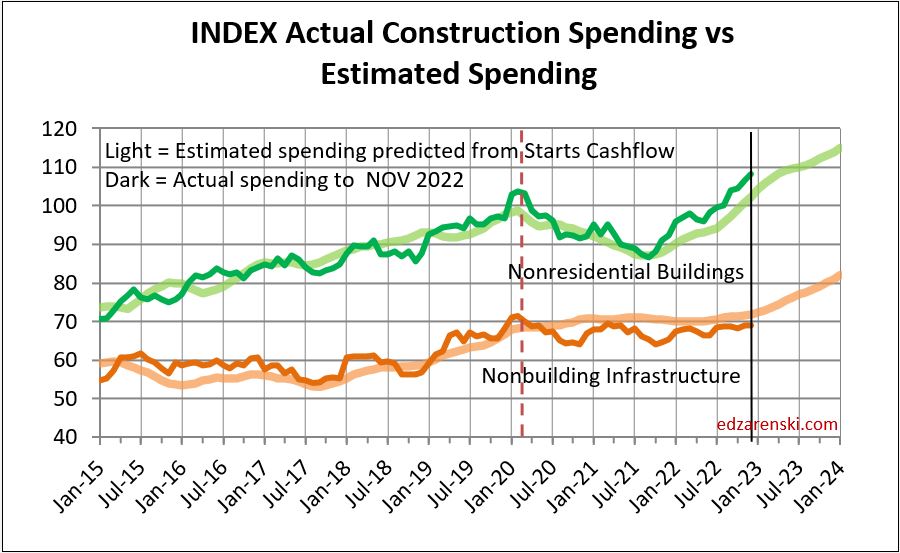
I’m including this next plot because it shows the accuracy of my nonresidential forecasts when comparing my cash flow forecast amount to the actual spending amount. It has proven to be pretty accurate over the years.

Amazing job as always Ed. I enjoy your thought and analysis.
LikeLike