Home » Behind the Headlines (Page 4)
Category Archives: Behind the Headlines

Job Openings – Behind the Headlines
Construction Job Openings – Behind the Headlines
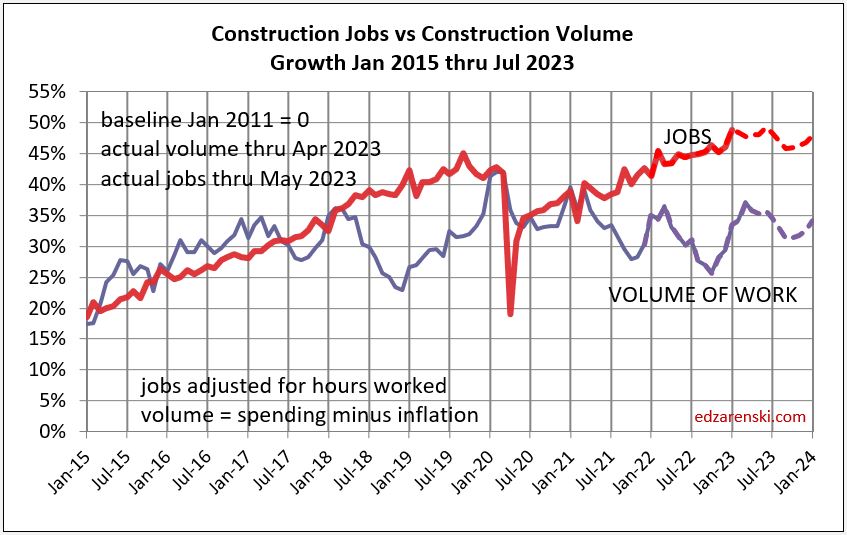
Recent data indicates ~ 300k job openings. Let’s look at support. To support those openings, there must be an equivalent added volume of work.
As we entered 2020, construction spending (in current $) was at a (then) all-time high of $1.530 trillion(t). Let’s set that point in time as the base and track growth since. Construction spending peaked in March 2023 at $1.970t and is currently at about $1.950t.
Volume growth in constant $ (constant $ = spending minus inflation) fell from $1.530t to $1.350t in Oct’22, has since returned to $1.450t as of June. So real volume growth is up off the bottom, but is still $80t or 5% below 2020. It is forecast to fall $50t over the next 6 months and return to current level in mid-2024.
Jobs, as we entered 2020, stood at 7.600 million(m). Jobs rapidly fell to 6.500m but recovered most of that by Dec 2020. Jobs now stand at 7.970m, up 5% since Jan 2020.
So, let’s summarize the facts: Since Jan 2020, spending is now nearly equal, volume of work is down 5%, but jobs are up 5%. So, since Jan 2020, jobs have increased 10% in excess of volume of work to support those jobs.
By my calc, if we were to add 300k jobs, either today or over the next year, we would see jobs increase by another 4%. Jobs growth since Jan’20 would exceed volume growth by nearly 14%. You might argue that 300k openings are there to fill the void of jobs supporting the current workload, but jobs growth already exceeds volume growth by 10% in the last 3 years.
Anyone want to try to explain how job openings of 300k is supported by the data?


Note 1: Job openings as of July are closer to 400,000
Note 2: plots shows baseline back to 2020 and 2001. Baseline 2001 situation becomes worse. See prior post https://edzarenski.com/2023/08/05/midyear-23-jobs-outlook/ for plots to baeline 2011 and 2020.
Midyear ’23 Jobs Outlook
Construction JOBS continue to creep higher, even when volume is falling. From Apr’22 to Oct’22 jobs increased 1.5% but volume of work dropped 10%. Jobs and volume should track together as seen from 2011 to 2018. Since Oct’22, jobs are up only 2% while volume up 7%. Volume is catching up.
Jobs have been increasing at 3%/year, or approx 200k to 300k jobs per year. In Feb 2020 there were 7.6 million construction jobs. Now there is almost 8.0 million. The average for 2020 dropped 3% or 170k jobs. But we regained jobs at 2.5% growth in 2021, 4.2% in 2022 and so far over 2% in 2023. Now this is interesting, because we did not see an increase in average volume in 2021, 2022 or 2023. In total, jobs are up 4.8% since Feb 2020, while volume of work is down 4.7%.

Construction Jobs have been on an even rate of growth approx. 2.5% to 3% per year, even when volume is falling. Spending has been on a bumpy climb, but keeps climbing. Without inflation real volume of work overall since 2020 has not increased at the same rate as jobs.
Current July Jobs are up 1.5% since Dec.’22, up 3% vs the average for 2022. July will be pretty close to the average for 2023. As construction inflation slowed down (has been slowing since mid-2022), volume gained ground on jobs over the last 9 mo., but jobs since Jan 2020 are still 10% higher than volume.
Here’s a look at total jobs just since 2020
Why do jobs sometimes/often grow faster than volume to support those jobs? Some possibilities:
When inflation is unusually strong, business planners may misjudge growth. Planning jobs growth on inflated revenues that net much lower than expected volume may lead to misjudging jobs growth. Result is jobs growth faster then volume.
When volume is decreasing, firms may be reluctant to (or smart not to) let go jobs. See the period on the above plot from Mar 2022 thru Oct 2022. Vol dropped 10%, Jobs increased 2%. So, the calculation shows a big excess in jobs for that period, because volume growth doesn’t support it. Within the next six months, volume increased 7%, making up half the difference.
Here’s jobs vs vol in each sector.
Notice how Rsdn jobs barely declined in 2020, but Rsdn volume increased 10%. Did that set off cries of jobs shortage in Rsdn? Not so in Nonres.

In Nonres Bldgs, volume by 2021 had fallen below growth in construction jobs. The deficit reached its worst in 2022 but in the last 9 months volume growth far faster than jobs growth has evened the balance.

Nonbuilding construction volume fell to a deeper deficit than Nonres Bldgs. But we can see the gap closing as volume increases faster than jobs.
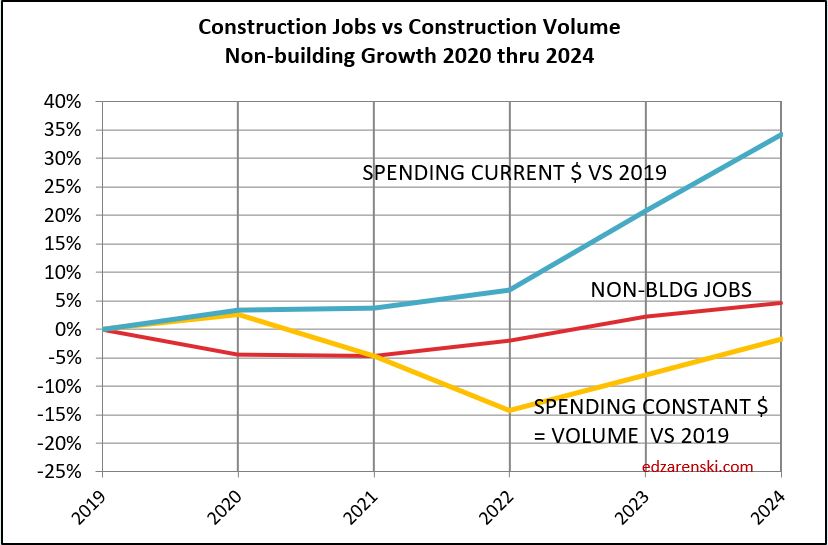
These above three sector plots go back to base 2019, showing how much percent change there has been since 2019. For a longer term look, here below is a plot of Nonresidential Buildings back to 2011. On this plot we can see jobs growth, when compared to 2011, for Nonres Bldgs, is above volume growth since 2017. The low point of volume was in 2021. 2022-2023 has posted the most rapid growth in many years. This closes the gap between Nonres jobs and volume, very helpful to the productivity outlook.

When splitting out jobs by sector we must always remember that some Nonres bldgs jobs actually work on constructing residential buildings (for ex., steel and concrete on a multifamily hirise) but remain counted as nonres jobs. Also, some undocumented workers may not be counted at all in residential jobs. That skews the data plots. But you can see that it would reduce the jobs in Nonres and increase the jobs in residential, improving both plots.
Construction spending data is indicating a slight dip in volume growth over the 2nd half 2023, but then leading into much stronger growth in 2024 in all sectors. Volume by Feb’24 is back to today’s level after falling 5%. I don’t expect jobs to decline with the drop in volume. Maybe slow down. I think at worst jobs hold steady for a few months before resuming 2.5%-3% annual growth later this year.

When jobs continue to increase while volume is dropping, that wrecks productivity. But sometimes volume increases rapidly while jobs grow steady at a 3% rate. Look at the period Oct’22 thru Jan’23. Jobs increased 2%, but volume quickly jumped 6%.

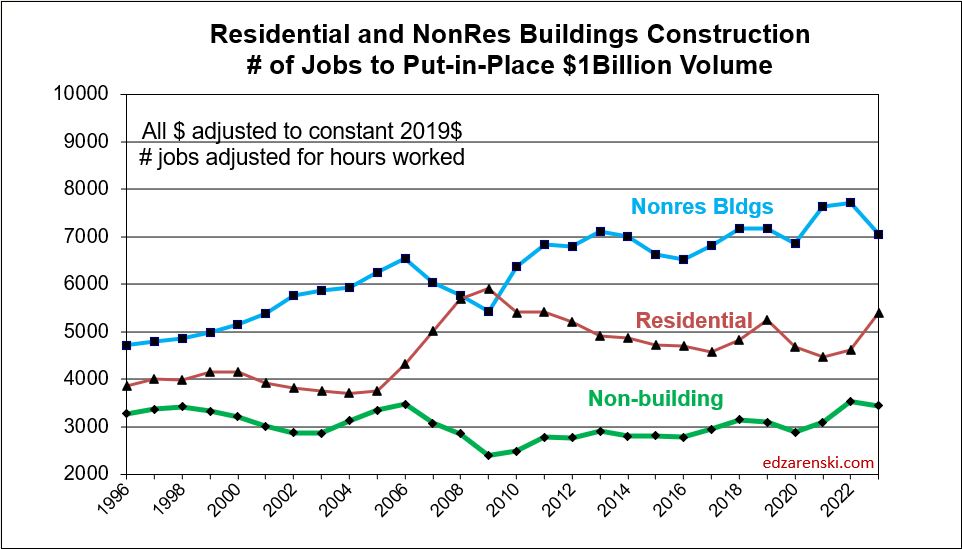
The number of jobs required to put-in-place $1 billion of construction in one year, as plotted below, about 5000 for residential, is the inverse of the plot above, the annual amount of $ put-in-place per job, about $200,000 for residential.
Who’s Forecast is Closest?
Twice a year, in January and July, The AIA Consensus Forecast is released. The AIA solicits Nonresidential Building construction spending forecast data from a number of firms and publishes the collected data. It can be helpful to compare the forecasts to current actual data. This provides some clues as to which forecasts are in the ballpark and which just don’t seem to be on track with reality.
The following table presents the AIA 2023 Consensus Forecasts published in January. Alongside the AIA Forecasts is my forecast, Construction Analytics 2023 beginning of year nonresidential buildings forecast and the Actual year-to-date spending published by Census. The ytd values are not much different than the current forecast for the year. The values highlighted in green are those that are closest to the current ytd. and expected forecast for the year.
Just one example to highlight forecast performance, more than half of the forecasts submitted to the AIA Consensus for Manufacturing were 10% or less for all of 2023. The current year-to-date spending for manufacturing is up 83%. My current forecast for the year is 67%.
The AIA January Consensus forecast had Nonresidential Buildings up 5.8% for the year. Construction Analytics forecast was 15.8%. The current ytd is 30%.

The Midyear 2023 AIA Consensus will soon be published. I would expect to see some drastic revisions to some of the input forecasts to catch up to actual spending. Construction Analytics will publish a midyear forecast after the July 1 Census data release that includes the revisions 5 years back. FWIW, Construction Analytics midyear forecast, for the last 3 years, has come closest to the actuals for the year in more markets than any firm’s forecast included in the AIA Consensus. As you can see in the table above, it’s looking pretty solid that Construction Analytics beginning of year 2023 forecast also comes closest to forecast for the year. Closest comparison is made to my current 2023 forecast, in table below, so there is room for change. Year-end actual might not hit my forecast, so… Anyway, the percent increase in 2023 forecast shouldn’t change much with July data, so it’s a preview of my midyear forecast.
On July 1st, the Census will release the construction spending data for May. Along with that, they will revise data back 5 years. Usually, the biggest revisions are to last year. The revisions can sometimes be large enough to sizably change the percent growth within a market from year to year.
This following table shows YTD and my current forecast for 2023 and 2024. Discussion of the forecast is in the preceding post. Construction Data Briefs JUN 2023

Construction Data Briefs JUN 2023
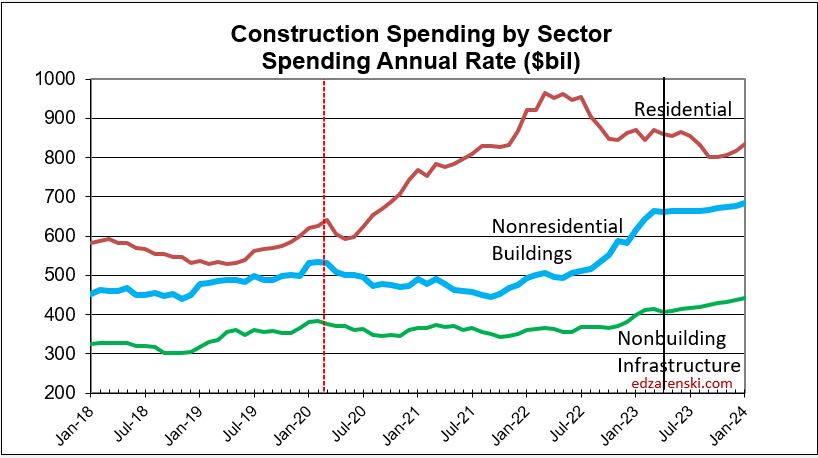
Nonresidential Buildings spending is leading Construction spending growth. For the first four months of 2023, total construction spending year-to-date (ytd) is up 6.1%. Nonresidential buildings spending is up 30% ytd compared to the same four months 2022, the fastest rate of nonres bldgs growth in over 20 years. Nonbuilding spending ytd is up 11%. Residential spending peaked in March 2022. Since then the annual rate of residential spending has dropped 11%.
SPENDING FORECAST
Total Construction Spending in 2023 is now forecast to reach $1,915 billion, an increase of 6.4% over 2022.
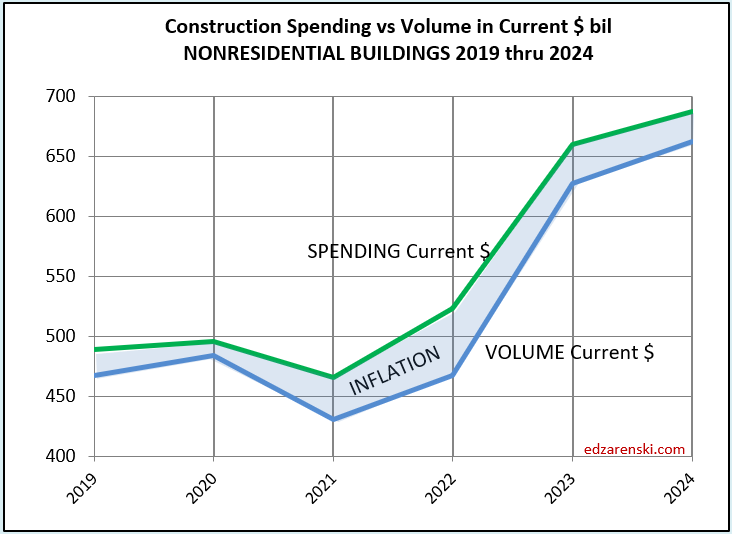
Nonresidential Buildings spending in 2023 is now forecast at $660 billion, an increase of 26.2% over 2022.
Construction Spending through April is up 6.1% ytd. Spending is forecast to finish 2023 up 6.4%.
Total construction spending for 2023 is on track to increase +6.4%. Residential -8.1%, Nonres Bldgs +26.2%, Nonbldg +14.4%.
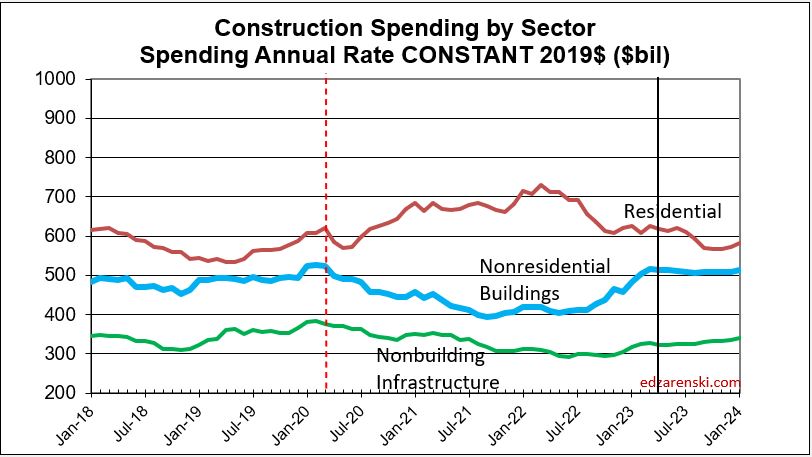
SPENDING BY SECTOR CURRENT $ AND INFLATION ADJUSTED CONSTANT $
In 2023, it’s Nonresidential Buildings leading growth. In 2024, it will be Nonbuilding Infrastructure leading spending growth. Both are expected to grow greater than the inflation index.
See also Construction Spending Outlook – Feb 2023
STARTS
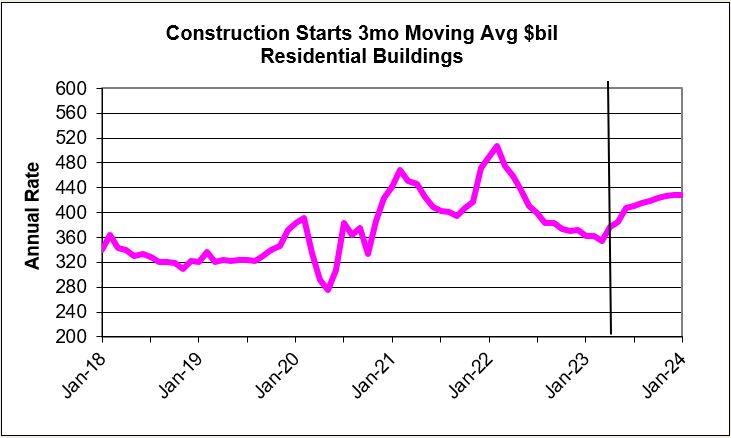
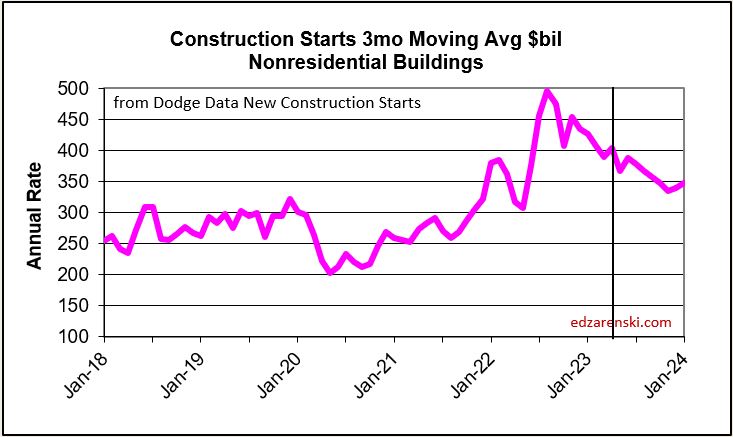
The rate of construction spending in 2023 will be influenced predominantly by a 40% increase in new nonresidential building starts in 2022. In recent years, new nonres bldgs starts averaged $300 billion/year. In the 2nd half of 2022, starts averaged over $500 billion/year. Many of those projects will have peak spending in 2023. Some will occur in 2024.
Residential construction (Dodge) starts posted the five highest months ever all in the 1st 6 months of 2022. In the second half of 2022, residential starts fell 15%. In Jan and Feb 2023, starts dropped another 20% below 2nd half 2022. Starts are now down 25% in 12 months.
Nonresidential Bldgs starts in 2022 posted the largest ever one-year increase in new nonresidential buildings construction starts, up 40%. Starts were also up 15% in 2021. Nonres Bldgs new starts in the 2nd half 2022, averaged 67% higher than any other 6mo period in history.
Growth in Manufacturing construction starts for 2022 far surpasses growth in any other market, up over 150%. Office is up 33% (datacenters), Healthcare up 23%, Comm/Rtl up 30% (warehouses). Warehouse stats have slowed and will hold Comm/Rtl down the next two years. Nonresidential buildings starts in 2023 decline in most markets, but 2023 will still be the 2nd highest year for total Nonres Bldgs starts.
Non-building starts increased more than 100% in July 2022. The 2nd half 2022 was up 50% over 1st half 2022. For 2022, Highway is up 25%, Transportation up 45%, Power up 30% and Public Works up 15%. Starts for 2023 are forecast up 15%. For 2023, every market is forecast up double digits.

Current $ Spending, Inflation and Volume
SEE Construction Inflation 2023
Inflation adjusted volume is spending minus inflation, or to be more accurate, spending divided by (1+inflation). Inflation adds nothing to volume growth. The following table shows spending, inflation and volume (spending without inflation) for each year. All $ are current to the year stated. The values in this table are not indexed to a constant value year. This simply shows business volume in any given year is not as high as spending would indicate. When inflation is positive, volume is always less than spending by the amount attributed to inflation.

Spending during the year is the value of business volume plus the inflation on that volume. When inflation is 12%, volume plus 12% = total spending. Revenue is generally measured by spending put-in-place during the year. In 2022, Nonresidential buildings inflation was 11.9%, so business volume was 11.9% less than spending, or less than revenue. Residential volume was 15.5% less then spending.

SPENDING TOTAL CURRENT $
VOLUME CURRENT $ = SPENDING MINUS INFLATION
CONSTANT $ = VOLUME OVER TIME
Overall Construction Spending is up 25% in the 38 months since the onset of the pandemic, but, during that same period inflation increased 31%. After adjusting for 31% inflation, constant $ volume is down 4%. So, while the plot on the left shows three years of increases in spending, the actual change in business volume is still down and has not yet returned to the pre-pandemic peak in Feb-Mar 2020.
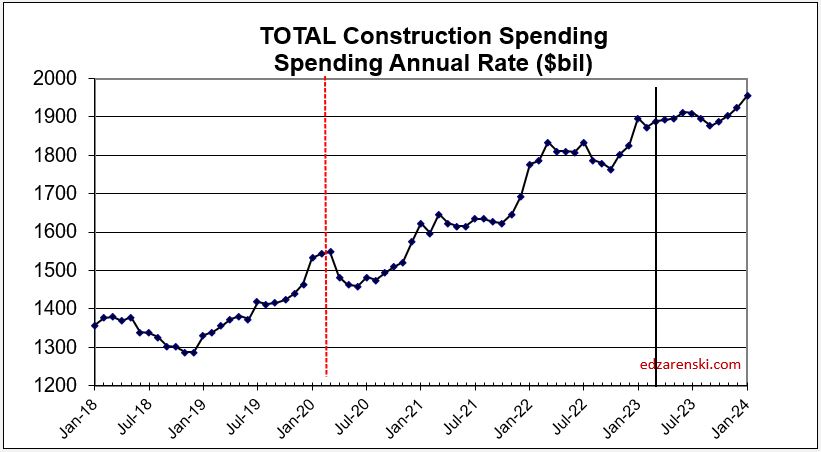
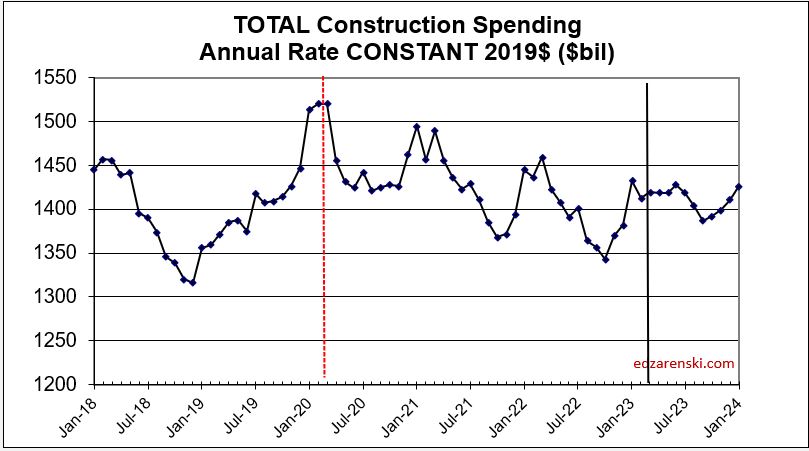

NONRESIDENTIAL SPENDING (CURRENT $) AND VOLUME (CONSTANT $)
Nonresidential Buildings spending in 2023 is forecast at $660 billion, an increase of 26.2%, or $137 billion.
In 2022 we realized the largest ever one-year increase in new nonresidential buildings construction starts, up 40%. Starts were also up 15% in 2021.
The AIA Consensus Construction Forecast, December 2022 predicts only a 5.8% increase in spending for nonresidential buildings in 2023. My beginning of year forecast for comparison was 15.8%. My current forecast is +26.2%. The current year-to-date spending through April is up 30%.
We began the year with record new starts indicating an increasing spending rate. The monthly rate of spending is up 12 of the last 14 months, has increased for 6 consecutive months and is up 20% in the last 6 months. The rate of spending is predicted to increase 10 out of 12 months in 2023, a total increase of 11% over the year. Barring any unforeseen negative occurrence, the trajectory in the rate of spending is increasing.
Year-to-date nonresidential buildings spending for Apr is up 30%. This is driven by Manufacturing, up 84% ytd, but also supported by Lodging up 40% ytd and Commercial/Retail up 23% ytd. Every nonresidential building market except Public Safety (up only 8%) is up greater than 10% ytd.
Nonresidential buildings spending fell 17% from March 2020 to Sept 2021, then increased 48% from Sept 2021 to Apr 2023. Currently, as of Apr 2023, spending is 24% higher than the pre-pandemic peak in Feb 2020. But nonresidential buildings inflation over that same 36 months increased 27%. Business volume in constant $ actually fell 25% from Feb 2020 to Sept 2021, and hit a secondary low in mid-2022. Since then, the actual change in business volume has increased 31%, but that still leaves volume nearly 2% lower than the pre-pandemic high.
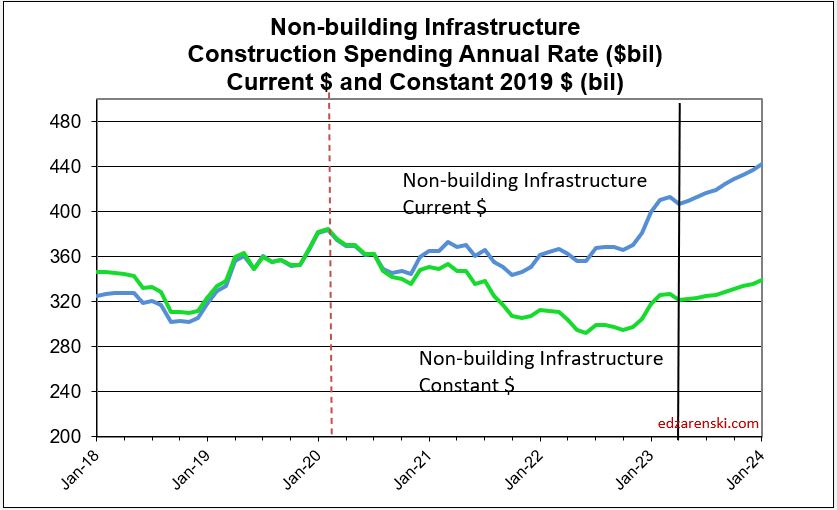
Non-building Infrastructure spending for 2023-24 is forecast up 25%, up $50 billion/year for two years. Non-building Infrastructure will post the 1st year of sizable gains since 2019, forecast at $418bil, up 13.5% in 2023. In 2022, Highway and Public Utilities posted strong gains of 9.1% and 16.6%, but those gains were offset by a 8.7% decline in Power. For 2023, Highway and Transportation recorded the strongest starts in five years. All markets post spending gains in 2023, with Highway up 26%, Transportation up 6% and Public Utilities up 18%.
Non-building Infrastructure spending is up 6% since Feb 2020. After adjusting for 27% inflation, constant business volume is down 16%.

RESIDENTIAL SPENDING SF-MF-RENO CURRENT $ AND CONSTANT $
Residential starts are forecast down or flat in 2022 and 2023. Spending grew 44% in the last 2yrs, but inflation was 30% of that 44%. With no growth in starts forecast for 22-23, spending will struggle to keep up with inflation. Residential spending is forecast to fall 8% in 2023. Most of the decline is single family. Single family is down 24% over 12 consecutive down months. Multifamily is up 24% over the same 12 months. But, it’s not an even swap. There’s 3x more spending in SF than in MF. Renovations gained 25% in 2022 but spending varies +/- 10% throughout the year. Midyear there is potential for 6 consecutive down months that could send residential spending down another 7% before year end.


DOES VOLUME OF WORK SUPPORT JOBS GROWTH? or, Can jobs growth support volume of work?
Jobs should track volume, not spending growth. Volume = spending minus inflation. Volume is down, although now increasing, while jobs are up. Nonres Bldgs volume, in constant $, fell 25% from Feb 2020 to Sept 2021, and hit a secondary low in mid-2022. Since then, the actual change in nonres bldgs volume has increased 18%. Yet nonres bldgs jobs increased only 3.5%. That still leaves volume nearly 10% lower than the pre-pandemic high. If the same production levels ($ put-in-place per worker) as 2019 were to be regained, theoretically, nonresidential volume would need to increase 10% with no increase in nonresidential jobs. For now, productivity is well below that of 2019.
Nonresidential Buildings spending in 2023 is forecast at $660 billion, an increase of 26.2%, or an increase of $137 billion in 2023. Non-building Infrastructure spending for 2023-24 is forecast up 25%, up $50 billion/year each year.
Normally, it takes 5000 jobs to put-in-place $1 billion in one year. So an add of $100 billion in 2024 would need 500,000 new jobs. 2023 would need 750,000 new jobs.
If we were to grow the labor force to meet the newly identified workload added from new starts, we would need to double the prior maximum rate of construction jobs growth. Normal growth is about 250,000 jobs per year and maximum prior growth is about 400,000. The workload discussed above would require 750,000 + 500,000 new jobs back to back. That’s an expansion of the industry by 15%, in an industry that normally grows 3%/yr. This industry can’t grow that fast. (Which means I need to account for over-capacity growth as a potential reduction in future forecast. You can’t increase spending that fast if you can’t expand the industry that fast).
My first thoughts were, Jobs may not be able to increase fast enough to put-in-place the forecast spending. This impediment needs to be accounted for and could reduce overall construction spending forecast over the next two years. The most likely markets where a reduction would occur are Manufacturing, Highway, Commercial/Retail and Office.
However this is what happened the past year. In the last 12 months, Mar’22 to Mar’23, nonres bldgs jobs are up 3.5%. Nonres Bldgs spending is up 21%, but after ~7% inflation, volume of nonres bldgs workload is up 14%. So, we have a 3.5% increase in jobs to accomodate a 14% increase in volume.
The last year has shown a huge increase in the volume of nonres bldgs work, without an equal increase in jobs. This shows the excess nonres bldgs jobs for the past three years is now absorbing new workload, (a 3.5% increase in jobs to accomodate a 14% increase in volume), without a cry of jobs shortages.
SEE more discussion on Volume and Jobs
here 2023 Construction Volume Growth
and here Infrastructure Construction Expansion – Not So Fast

Sample PP Slides for Economic Forecast Q2 2023
On Thursday morning May 25th, I will be presenting my Q2 2023 Construction Economic Forecast at Hanson Wade’s Advancing Preconstruction conference in Phoenix, AZ. Here is a selection of the slides cut from the full presentation.
The full presentation covers the data used in preparation of the full forecast, and it’s potential impact on the outcome, including Construction Starts, Backlog, Cashflow, Spending, Inflation, Business Volume, Jobs and Risk.
Hanson Wade’s Advancing Preconstruction conference is one of the largest, if not the largest, preconstruction conferences held in the United States. This is my 6th year presenting at AP.
The Next Forecast Challenge
The next big challenge in construction forecasting is to determine, Will Nonres Bldgs spending increase without an equal increase in nonres bldgs jobs? If so, by how much?
At the onset of the Pandemic, nonres bldgs jobs dropped 16%. Jobs have since recovered to down only 1% vs Feb 2020. Spending (bottomed in Sep 2021) fell 17%, but is now up 15% over Feb 2020.
But the key to this comparison is inflation, which, when subtracted from spending gives real volume growth. Inflation adds only to spending, it adds nothing to volume of work.
Nonres Bldgs inflation was 2.4% in 2020, 8.2% in 2021 and 11.9% in 2022. Total Nonres Bldgs inflation from Feb 2020 to Mar 2023 is 26%.
Since the onset of the Pandemic, Nonres Bldgs spending is up 15% but after inflation volume is down 8%. During that time jobs are down 1%. That’s now over three years that jobs exceed volume of work. Let’s look at more recent data.
In the last 12 months, Mar’22 to Mar’23, nonres bldgs jobs are up 3.5%. Nonres Bldgs spending is up 21%, but after ~7% inflation, volume of nonres bldgs workload is up 14%. So, we have a 3.5% increase in jobs to accomodate a 14% increase in volume.
The last year has shown a huge increase in the volume of nonres bldgs work, without an equal increase in jobs. This shows the excess nonres bldgs jobs for the past three years is now absorbing greater workload, (a 3.5% increase in jobs to accomodate a 14% increase in volume), without a cry of jobs shortages.
What’s the real magnitude of this difference in percent growth, a 10.5% increase in volume over jobs. Well that 10.5% increase in volume is $50 billion worth of construction put-in-place. Not delayed, not canceled, put-in-place. With no equal increase in jobs. So the existing jobs put this work in place. $50 billion in one year would normally require 250,000 jobs to put-in-place. Or by using overtime and working the existing workforce longer hours to get it done, the entire nonres bldgs workforce of 3.5 million would need to work 10 hour days 5 days a week to put that much extra work in place. Well, BLS reports hours worked changed by less than 1 hour/week.So, it wasn’t accomplished with added jobs and it wasn’t accomplished with overtime.
Some regular readers here could probably point back to a half dozen articles over the last few years in which I describe nonres bldgs volume levels had dropped but jobs had not. I mentioned before that existing jobs could and probably would absorb some of the growth. That could occur if there were a need to backfill volume to support the existing workforce.
The forecast for Nonresidential Buildings spending in 2023 is +20%. After 6% inflation, volume is forecast +14%. Jobs will not increase by 14%. Jobs have never increased more than 5% and normal is 3.5%. A 14% increase is equivalent to 500,000 jobs, just to support the growth in nonres bldgs. 500,000 jobs is double the normal annual rate of growth for all construction jobs. Nonres Bldgs is is only 33% of all construction
So the questions for the forecaster are these, 1) do we break the mold for construction jobs growth and add half a million jobs, and exceed all known indicators on construction jobs growth?, 2) Will volume vs jobs grow similar to the previous year, volume up 14% and jobs up 3.5%?, or 3) Does nonres bldgs volume growth slow down to a rate of growth more in-line with jobs growth?
I’m heavily leaning to #2, volume will exceed jobs growth. Some of the added work in the near future will be absorbed by the current workforce, but the workforce has already absorbed a great deal in the past year. Also I do think I’m partly leaning towards #3, volume growth will slow to less than currently predicted, although not nearly to the low level of historical jobs growth. I don’t expect jobs growth to exceed historical maximum of 5% annually, 175,000 nonres bldgs jobs. I do expect volume growth will exceed jobs growth, but by much less than in this past year. I do expect to extend the forecast spending out to a further date.

2023 Construction Volume Growth
Construction volume is spending minus inflation. If we want to know whether business is growing, we need to look at spending without inflation, or volume of business.
Volume is what dictates the need for jobs.
If an apple this yr cost 50c, and last yr it cost 40c, the revenue changing hands has gone up 10c or 25%. Volume of business changing hands has not changed, it’s still only one apple.
Inflation adds nothing to the volume of business.
For 2021 and 2022, total construction spending increased 8.5% and 10.6%. But, inflation was 11% and 15%. In both years, inflation was higher than spending. First, subtract inflation from the total spending. That’s gives the dollar amounts for the Spending w/o Inflation Current $ table. Then volume growth can be compared year to year. Volume growth calculation is Vol this yr/Vol last yr, but first, it is dependent on each individual year spending minus inflation.

Volume each individual year is calculated as spending minus inflation. But growth in Volume from yr to yr is Vol this yr/Vol last yr., so is often different than growth in spending.
The volume of construction work completed in 2021 ($1.467tril) is 11% (avg inflation 2021 less than 2021 spending ($1.626tril)
The volume of work completed in 2022 ($1.574tril) is 15% less than 2022 spending ($1.798tril)
So, while Spending growth is 1.798/1.626 = 10.6%, Volume growth is 1.572/1.467= 7.2%.
The table above shows Current Spending and Current Volume. It is not indexed to a common point in time. The table below is Constant Spending which represents Volume indexed to a point in time, in this case 2019. The percent change year to year is what is plotted in charts below.
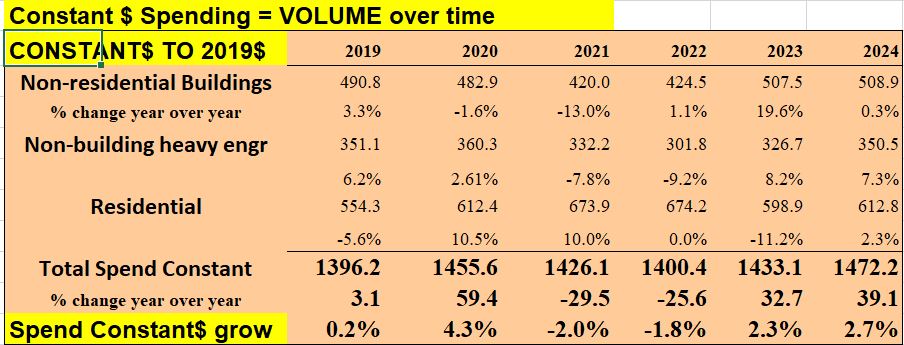
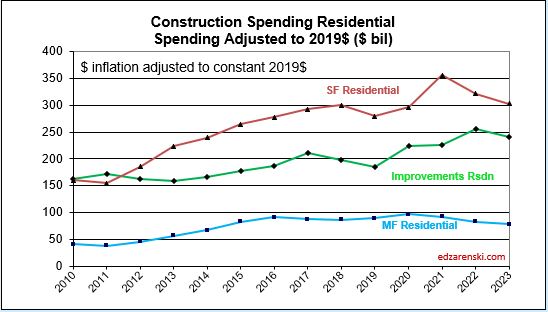
All the plots below show spending, volume and jobs. Current $ in 2010 are not the same as current $ in 2023, so all $ are indexed to the same constant point in time, constant $, so they can be compared. Constant $ then shows the cumulative growth from that point in time.
This plot shows the cumulative change in Total All Spending, Volume and Jobs since Jan. 1, 2020. From 2019 to 2022, Spending is up 29%, Volume is up only 18% and Jobs are up only about 2%. Below are plots that show the differences in jobs and volume growth for each sector.

Residential 2022 spending is = $900bil. Inflation is 15%. Without inflation, residential volume is up $780bil. Residential spending in 2023 is forecast at $850bil. If residential inflation for 2023 comes in low, say at 4%, then w/o inflation residential volume in 2023 would be $820bil. 2023 spending would be 6% lower than 2022, but volume is 5% higher. All due to the huge bite that 15% inflation took out of 2022 spending.


Recently, residential jobs have been holding relatively close to volume. In 2019 and 2022 they were even. That is not the case for the rest of construction.
Nonresidential Buildings and Non-building Infrastructure constant $ volume since Jan. 2020 is down about 15%. Note how jobs dropped about 5%. This, not residential, is what is driving the deficit of volume shown in the Total All plot above. The major growth forecast in Nonres Bldgs and Non-bldg in 2023 and 2024 should help offset some of the difference.
Both Nonres Bldgs and Non-bldg have (or had) a very large number of jobs not supported by volume. This could be contractors holding on to their labor in a slack period so they have the labor when needed. The volume growth in these sectors would indicate a needed jobs growth that far exceeds the ability of the construction industry to add jobs. Those jobs could potentially absorb a lot of the anticipated growth in the spending forecast.


The current excess of jobs could absorb a lot of the volume growth. In 2020-2021, jobs increased about 2% but volume of work decreased 20% to 25%. These should move in tandem, not in opposition. The data counters the narrative of jobs shortages. In these two sectors, jobs had reached the highest ever excess jobs over volume. This does not address the alternative, skills shortages. But the data seems to indicate there could be a lot of bodies that could take on a large amount of growth in the volume of work.
From Q4’21 to Q1’23, Nonres Bldgs volume increased 25%, $100 billion. Nonres Bldgs jobs increased 4%, 140,000 jobs. A $100 billion add in one year is equivalent need to 500,000 jobs, and yet the workforce added only 140,000 jobs. The rest of the work was absorbed by the current workforce. I expect the volume growth over the next two years will increase much faster than jobs growth. That would be very good for the construction industry.

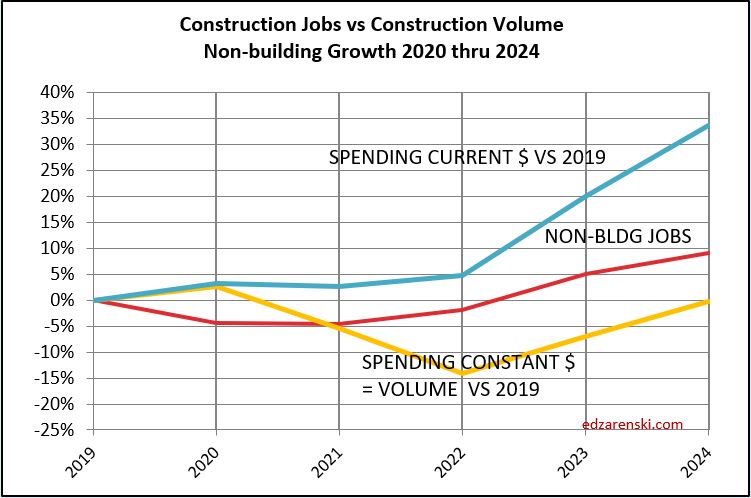
The volume growth in these sectors would indicate a needed jobs growth that far exceeds the ability of the construction industry to add jobs. The most jobs ever added in the last 50 years is just over 400,000. The average jobs added in the last 12 years is 225,000 (excluding the 230k lost in 2020) and the most in one year in the last 12 years is 320,000. It’s reasonable to assume the industry can add 300,000 to 400,000 jobs a year.
We either accept that we can’t add enough jobs to support increasing the workload by that much or we can’t add the anticipated workload in the forecast.
If we accept the forecast volume growth over the next two years, we simply could not add enough jobs in one or even two years to accommodate all the volume of work forecast. Both the Nonres Bldgs and Non-bldg plots above show a steep incline in the volume of work added, but not nearly as steep an incline in the number of jobs added. This can be correct only if a large percentage of the work added is absorbed by the current workforce. The alternative is that much work can’t be added that fast.
2023 volume growth is $250 billion, mostly nonresidential buildings. It takes 5000 jobs a year to put-in-place $1 billion. Forecasting that growth is put-in-place over 2 to 3 years, that’s about $100 billion/year. That’s 500,000 jobs for 2 to 3 years, which means there is too much work added in a year. My current forecast does not reduce for this, yet.
An extension of this discussion is here The Next Forecast Challenge

Construction Spending Outlook – Feb 2023
2-2-23
Total construction spending in 2023 will increase only 4.2% over 2022. Nonresidential Buildings will lead construction spending in 2023 with a forecast gain of 18%.
The last two years, 2021 and 2022, total spending increased 8.5% and 10%. However, inflation in 2021 was 11% and in 2022 was 15%, both higher than spending. Real construction volume for the year is spending without the inflation. The volume of work completed in 2021 is 11% less than 2021 spending and in 2022 is 15% less than the total of 2022 spending.
The rate of construction spending in 2023 will be influenced predominantly by a 38% increase in new nonresidential building starts in 2022. In fact, even more meaningful, Nonres Bldgs new starts, in 2nd half 2022, averaged 68% higher than any other 6mo period in history. In recent years, new starts averaged $300 billion/year. In the 2nd half of 2022, starts averaged over $500 billion/year. Many of the projects peak spending will occur in 2023. Some will occur in 2024. Total spending forecast for Nonres Bldgs in 2023 is $616bil, an increase of 18.5% over 2022.
Growth in Manufacturing construction starts for 2022 far surpasses growth in any other market, up over 150%. Total new starts for the past 2 years is up over 400%. It will take at least a year to determine how much of that growth is an increase in total new construction and how much is an increase in capture of data in the starts survey.
Non-building starts for 2022-23 are forecast up 50%. Spending 2023-24 is forecast up 23%.
Non-building Infrastructure will post the 1st year of sizable gains since 2019, forecast at $400bil, up 9.6% in 2023. In 2022, Highway and Public Utilities posted strong gains of 9.0% and 16.5%, but those gains were offset by a 9.0% decline in Power. For 2023, Highway and Transportation recorded the strongest starts in five years. All markets post spending gains, with Highway up 12.0%, Transportation up 15.0% and Public Utilities up 11.5%.
See this discussion on Infrastructure and Jobs here
Infrastructure Constr Expansion – Not So Fast
Residential starts in 2021 were up +21% to what was then a new high. Starts peaked in the 1st half 2022 then started a decline in 2nd half 2022. By Q4’22, the rate of new starts dropped by 20%. Starts are forecast down 2% in 2023.
After three years of gains totaling 64%, expect residential spending to decline 6% in 2023. Single Family (47% of rsdn) spending peaked in April and since is down 20% in eight consecutive months. Multi-family (15% of rsdn) is up 11 consecutive months, now up 19% from January 2022. Reno/Rpr (38% of all rsdn) is up 25% for the year, but in the last five months, the rate of spending has fallen 15%. Only multi-family is currently trending up. 75% of all gains in multi-family occurred in the 4th quarter.
For the past 3 years, 2020-2022, Reno/Repair construction spending has gone up 1.26 x 1.16 x 1.25 = 1.8x, or 80%. Spending is currently down 17% from the peak in 4 of the last 5 mo. If the SAAR were to stall where it’s at now for the rest of 2023, spending will be down 10% for the year and will still be up 1.65x over last 4 years. Sure, it’s down, but it’s still high.
Residential spending grew 44% in the last 2yrs, but inflation was 30% of that 44%.
The annual rate of spending in all Nonresidential Buildings markets increased from Q1 to Q4 2022 and also Q4 spending in every market was higher than the average for 2022. Heading into 2023, nonresidential buildings markets start out the year with the annual rate of spending already 8% higher than the average 2022, and the trend has been up. The annual avg is usually much higher than Jan of the year, so I’d expect 2023 to come in higher. Although there are a few moderate dips in spending in some markets during the year, every market adds growth in 2023.

NOTE: The Census spending release on 2-1-23 is the 1st release to capture Dec data and therefore all months in 2022. The 3-1-23 release will revise both Dec and Nov. The 4-1-23 release will revise Dec. And the 7-1-23 release will revise any/all months needing further revision in both 2021 and 2022, sometimes with hefty changes. Historically, revisions are predominantly UP.
See Behind The Spending Forecasts
for a table showing the annual rate of spending for each market in the 4th qtr compared to the 2022 average. That’s the rate of spending starting out 2023.
Starting out the year with (Dec’22) an annual rate of spending already averaging 8% greater than 2022, coupled with 38% growth in new starts in 2022, much of which will be spent in 2023, produces the strongest year of growth in nonresidential buildings construction spending since 2007.
3-1-23 Surprises in the Census Construction Spending for Jan.
Nonres Bldgs January 2023 spending begins the year at a rate up 16% vs avg 2022 and up 23% YTD vs Jan 2022. Just one month ago the Dec. rate of nonres bldgs spending was only 8% higher than the average of 2022. This is Nonres Bldgs construction spending best start to the year since my records back to 2001. All indications are spending will increase throughout the year. I had forecast Mnfg in 2023 up 35% and total Nonres Bldgs up 18%. Now I have Mnfg up 40% and Total Nonres Bldgs up 20%.
If spending continues to increase at even a moderate pace, we could see the year end with Mnfg spending up 45% and total Nonres Bldgs spending up 25%.
- Mnfg starts Jan +54% ytd and +33% vs avg 2022.
- Comm/Rtl starts Jan +23% ytd and +18% vs avg 2022.
- Lodging starts Jan +42% ytd and +18% vs avg 2022.
- RSDN starts Jan -6% ytd and -5% vs avg 2022.
- Highway begins 2023 +16% ytd and +8% vs avg 2022.
- Power begins 2023 -5% ytd and +3% vs avg 2022.
- Transportation begins 2023 +10% ytd and +14% vs avg 2022.
Part of the Mnfg +54% can be explained due to the very low Jan’22. That evens out in Q4, when 2022 inflation jumped, so 2023 comparisons won’t be as high.
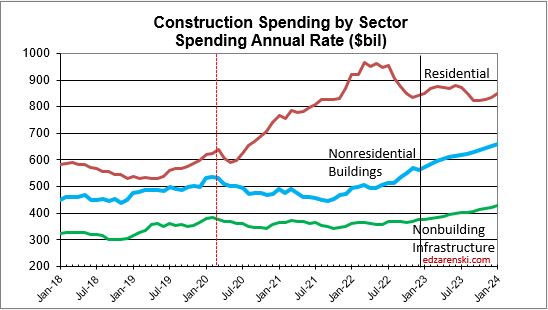
Below, the enlarged scale gives a better look at nonresidential Bldgs spending.

To fully understand the forecast it is necessary to discuss the impact of inflation. Construction spending includes inflation. Inflation adds nothing to business volume. Spending minus inflation gives volume. Growth, or decline, in business volume measures the actual activity growth in the construction industry. Spending measures the amount of revenue that exchanged hands to make it happen.
2-6-23 Current and predicted Inflation updated to Q4’22
- 2020 Rsdn Inflation 4.6%, Nonres Bldgs 2.4%, Nonbldg Infra -0.3%
- 2021 Rsdn Inflation 13.9%, Nonres Bldgs 7.6%, Nonbldg Infra 7.9%
- 2022 Rsdn Inflation 15.7%, Nonres Bldgs 12.3%, Nonbldg Infra 13.8%
- 2023 Rsdn Inflation 1.7%, Nonres Bldgs 4.2%, Nonbldg Infra 4.3%
Although input costs have been dropping and final demand (Nonres Bldgs) increases have been slowing, 2023 demand for nonresidential construction is going to post the largest annual spending increase ever recorded. This could reverse the trend in Nonres pricing and keep inflation higher for Nonres Bldgs.
Inflation adjusted volume is spending minus inflation. Volume of work (spending minus inflation) is what drives the need for jobs.
- Total volume for 2021 fell 1.9%, Rsdn +10%, Nonres Bldgs -13%, Nonbldg -8%.
- Total volume for 2022 fell 2.3%, Rsdn -1%, Nonres Bldgs +1%, Nonbldg -9%.
- Total volume forecast 2023 is flat at 0%, Rsdn -10%, Nonres Bldgs +13%, Nonbldg +4%.
Because 2022 inflation was so high (12% to 15%), the adjustment to 2022 spending resulted in much lower volume. In 2023, spending is forecast up 4.2% (compared to last year spending) and forecast inflation is 2% to 5%. 2023 inflation reduces spending far less than what occurred in 2022. Volume gets compared to volume the previous year. Therefore volume in 2023 shows an unusually large increase compared to volume in 2022.
SEE Construction Inflation 2023
for the details of inflation costs, but here are plots of the same information as the two plots above, only difference being the plots above are Current$, dollars as reported in the current year as reported by Census, and the plots below are constant$, inflation $ has been removed. The plots below actually measure the real growth from year to year. For example, while the plot above shows residential growth in spending increased from $600 billion in Q1 2020, to $900 billion in 2022, the plot below shows most of that was inflation and after removing inflation, residential construction did increase in early 2022 but by Q1 2023 has dropped back to the same level it was at in Q1 2020.

Below, the enlarged scale gives a better look at nonresidential Bldgs volume.

Recent construction annual rate of spending is only 17% higher than March 2020, but overall total construction spending is up 30% for 2020-21-22. In that three year period there was 32% inflation, half of that in 2022. So, all of the 30% spending gain is inflation, there is no gain, (a slight drop of -2%) in volume for that three years. Residential spending increased more than 60% with rsdn inflation near 40%, so rsdn volume increased 20%. Rsdn jobs growth is near even on track with volume, but Nonres and Nonbldg jobs did not fall when volume dropped.Nonresidential had 10% volume decline in 2021. Nonres now has a volume deficit vs jobs, compared to at the end of 2019.
For a discussion of inflation effects on jobs growth visit this link where this chart will be discussed.
SEE Construction Spending – Volume – Jobs

Look Back at 2022 Construction Spending Forecasts
2-1-23
Initial Year end construction spending for 2022 is out today. This is when I compare my forecast for 2022 spending to all my prior monthly forecasts during the year AND I compare my midyear forecast prepared in May-June to the forecasts published at midyear in the AIA Consensus Construction Forecast. You can judge how I’ve measured up to forecasts thru the year.
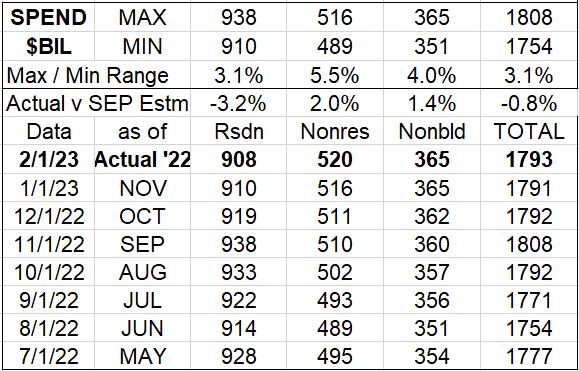
This 1st table shows just the sum total in each sector for each monthly forecast I produced during the year. This year was quite unique in that new construction starts for nonresidential work increased by 60% in the 2nd half of the year, a magnitude of increase never before experienced. No one could have predicted that.
In this table I compare the actual for 2022 to the September forecast. My data analysis of 20 years of input shows that a particular set of months through and including September has forecast the end of year spending within 1.5% for nonresidential and within 2% for residential. You can see with the initial data for 2022 that the Sept forecast was within 3.2% for residential and within 2.0% for Nonres Buildings. Nonbuilding Infrastructure came in under the 1.5% threshold.
This next table is shows my midyear forecast for total 2022 spending compared to the forecasts published in the AIA Midyear 2022 Consensus. I’ve highlighted in green the closest estimate to the actual end-of-year spending report. In red is the worst forecast at midyear. This is the 3rd consecutive year that I’ve beat all the forecasts in the AIA Consensus. In fact, looking back at 2015-2019 there are several other years in which I beat out the AIA Consensus estimates.

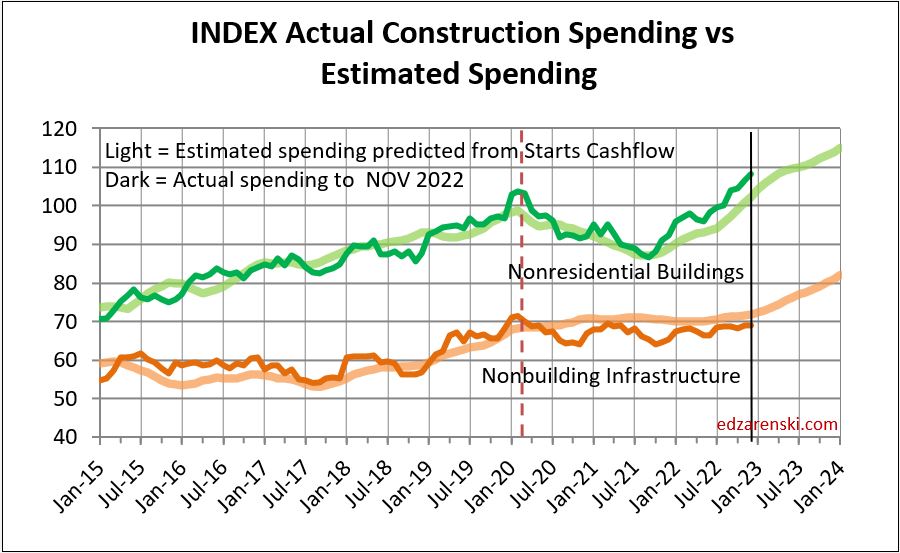
I’m including this next plot because it shows the accuracy of my nonresidential forecasts when comparing my cash flow forecast amount to the actual spending amount. It has proven to be pretty accurate over the years.
Behind The Spending Forecasts
2-1-23 Here’s a look at Nonresidential Buildings Construction Spending Forecasts for 2023. What’s Behind a Forecast?
Two things to look at when developing a forecast: What is the current rate of spending (SAAR), and what direction has it been moving?, and, What has been the recent activity in new starts (new contract awards)?
Most of the spending from new starts (all starts in total from Jan thru Dec) occurs in the year following the start. A reasonable spending estimate (across a large volume of work) is 20:50:30. So, for the sum total of all starts in the year, 20% gets spent in the 1st year (the year started), 50% the 2nd year and 30% the 3rd year. So approximately 50% of all new starts last year gets spent this year. The ratio can be much different from market to market. In other words, the most influential factor on the rate and trajectory of spending this year (barring something such as a pandemic or a recession) is starts from last year.
Here is my current baseline data:
- Construction spending for 2022 in the 2-1-23 release is $520 billion, up 11.6%
- Construction Starts (per Dodge) up ~38% in 2022, up 15% in 2021 and forecast down 10% in 2023.
- Current rate of spending (SAAR avg in Q4) is $560 bil, increasing $5bil-$10bil/month.
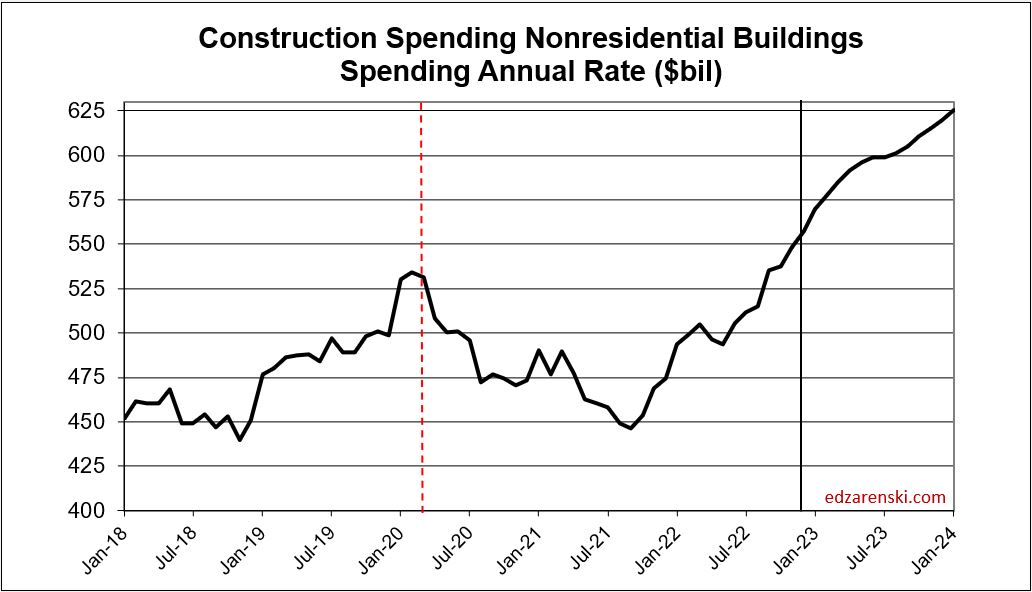
The increasing rate of spending makes sense, since starts were up so much in 2021 and 2022, and starts in the prior year is the greatest influence on rate of spending in the current year. Average nonres bldgs spending for 2022 is $520bil and the Q4 rate of spending is $562bil. The current rate of spending (SAAR in Dec) is 8% higher than the 2022 total spending and is increasing.
If something happened to stall spending right now at the current rate, it is at an annual rate of $562 billion, 8% higher than the average from 2022. So, as we begin 2023, with no forecast for a downturn, we could expect 2023 total spending would be at a minimum 8% higher than 2022. Since the current rate of spending is increasing, we could reasonably expect 2023 spending will add to the 8% starting advantage. This is a solid starting point for forecasting 2023 since this is already on record.
I prepared this following table to show the starting annual rate of spending for all of the markets, in particular the nonresidential buildings markets. As of Q4 2022, or the starting point for 2023, we see a few markets are only 3% to 5% above the 2022 average and a few are considerably higher. Also included in this table is the percent growth in new starts in 2022 for each market.
Let’s use an example: The Educational market, in Q4, or as we begin 2023, has monthly spending at a rate 4.9% greater than 2022. Starts increased 8% in 2022, so there will be a slight to moderate increase to spending in 2023. If spending growth stalls at the current rate, it will finish 2023 at 4.9% over 2022. The only way it should fall to less than that in 2023 is for some decline in some months in 2023 to less than the current rate of spending in Q4. Since all markets have substantial new starts to feed 2023 spending, all markets should post spending in 2023 higher than Q4 2022.

The rate of spending in 2023, being influenced predominantly by a 38% increase in starts in 2022, is projected to continue increasing throughout 2023. The monthly cashflow of the starts $ from all previous years that still generate spending in 2023 is what determines the rate of change in spending. My forecast has nonresidential buildings spending increasing steadily from a rate of $570 billion in January to $625 billion in December.
What data supports my forecast? Spending is already, in Oct-Nov-Dec, 8% higher than the average for 2022, so we begin 2023 at a rate of spending up a minimum 8% higher than the average for 2022. The average for 2023 could fall below the current 8% IF we were to experience some unforeseen negative occurrence in the coming months. I don’t foresee that happening. In 2022 we realized the largest ever one-year increase in new starts, up 38%. Starts were also up in 2021, up 15%. The monthly rate of spending is up 12 of the last 14 months, has increased for 6 consecutive months and is up 10% in the last 6 months. The rate of spending is predicted to increase 10 out of 12 months in 2023, a total increase of 11% over the year. Barring any unforeseen negative occurrence, the trajectory in the rate of spending is increasing and 2023 spending will finish well above the 8% advantage starting at the beginning of the year.
My total forecast for Nonresidential Buildings spending in 2023 is $616 billion, an increase of 18.5% over 2022.
The AIA Consensus Construction Forecast, December 2022 predicts only a 5.8% increase in spending for nonresidential buildings in 2023. Five of the nine forecasts provided in the Consensus Forecast are below the 5.8% consensus average. Only two forecasts are higher than 8% which is the projected minimum growth as we begin 2023, as explained above. As we begin the year with data, as of December, already at a rate 8% greater than the average for 2022, and with record new starts indicating an increasing spending rate, how is a forecast developed lower than that? What’s behind those spending forecasts?
This article was updated on 2-2-23 from November data to December data for clarity and to include the table showing Q4 data. Overall, the premise has not changed.

