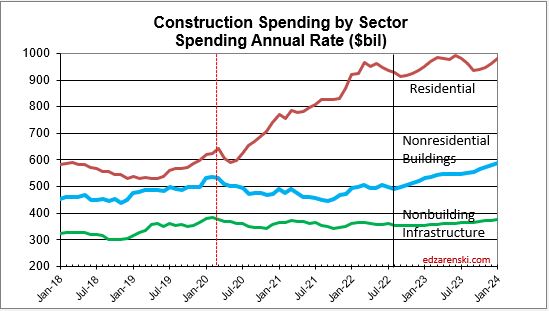
Construction Spending year-to-date thru August is up 10.9% and is on track to finish the year up 10.1%. Leading gainers for 2022 forecast are Manufacturing spending up 23%, Commercial/Retail up 17% and Residential with a 2022 forecast up 16%. Nonres bldgs are forecast up 7.8%. Nonbuilding Infrastructure is held to a forecast loss of 0.3% due to nearly a 10% drop in Power but offset by a 16% gain in Sewer/Water/Conservation.
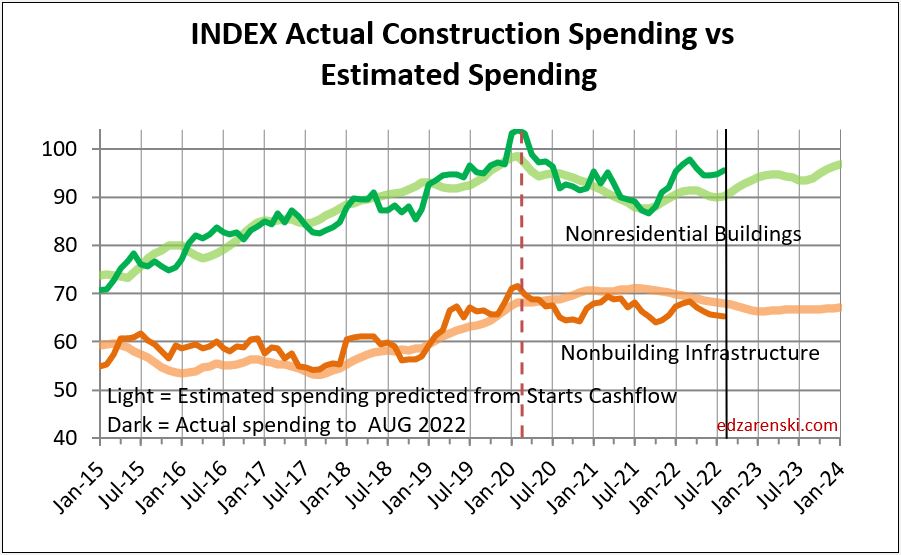
Every nonresidential building category thru August year-to-date inched closer to both my midyear forecast and my current annual forecast. This plot shows the spending forecast from starts cashflow vs actual spending to date. Starts cashflows do a good job of predicting spending.
Significant changes since my 9-1-22 forecast: Residential up $11bil 1.3%, Manufacturing up $6bil up 8%.
Residential construction spending is down 3.5% from the most recent peak in Mar 2022. It is on track to finish the year up 16%. Residential construction starts, $ as measured by Dodge, JJA 3mo avg is down 10% from the peak in the previous 3mo. But that peak qtr, MAM, is up 5% from the total in 2021 which was up 22% from 2020. Avg starts for the last 20 months has remained above the former high in 2005.
Nonresidential Buildings Construction spending is on track to finish the year up 8% powered by a 23% increase in Manufacturing spending and a 17% increase in Commercial/Retail spending. Nonresidential Bldgs new starts are projected to finish up 22% in 2022.
Total ALL Nonresidential construction spending, buildings and nonbuilding, is down 2.8% from the most recent peak in March 2022, but is up 5.2% year over year. Total Nonresidential spending is on track to finish the year up 4%, led by a 7.5% annual increase in Nonres Bldgs. but held back by a 9% drop in Power, 30% of the non-building total.
Spending took a downturn in April but this is expected to turn up after September. Most of the downturn is due to residential. By October all sectors are forecast to post gains.
The difference between these two plots is INFLATION, which adds nothing to the volume of work. The CONSTANT$ plot is like the volume of business that takes place. The Spending plot shows the $ that changed hands to conduct that business volume.
 Significant changes since my 9-1-22 forecast: Residential up $11bil 1.3%, Manufacturing up $6bil up 8%.
Residential construction spending is down 3.5% from the most recent peak in Mar 2022. It is on track to finish the year up 16%. Residential construction starts, $ as measured by Dodge, JJA 3mo avg is down 10% from the peak in the previous 3mo. But that peak qtr, MAM, is up 5% from the total in 2021 which was up 22% from 2020. Avg starts for the last 20 months has remained above the former high in 2005.
Significant changes since my 9-1-22 forecast: Residential up $11bil 1.3%, Manufacturing up $6bil up 8%.
Residential construction spending is down 3.5% from the most recent peak in Mar 2022. It is on track to finish the year up 16%. Residential construction starts, $ as measured by Dodge, JJA 3mo avg is down 10% from the peak in the previous 3mo. But that peak qtr, MAM, is up 5% from the total in 2021 which was up 22% from 2020. Avg starts for the last 20 months has remained above the former high in 2005.
 Nonresidential Buildings Construction spending is on track to finish the year up 8% powered by a 23% increase in Manufacturing spending and a 17% increase in Commercial/Retail spending. Nonresidential Bldgs new starts are projected to finish up 22% in 2022.
 Total ALL Nonresidential construction spending, buildings and nonbuilding, is down 2.8% from the most recent peak in March 2022, but is up 5.2% year over year. Total Nonresidential spending is on track to finish the year up 4%, led by a 7.5% annual increase in Nonres Bldgs. but held back by a 9% drop in Power, 30% of the non-building total.
Spending took a downturn in April but this is expected to turn up after September. Most of the downturn is due to residential. By October all sectors are forecast to post gains.
Total ALL Nonresidential construction spending, buildings and nonbuilding, is down 2.8% from the most recent peak in March 2022, but is up 5.2% year over year. Total Nonresidential spending is on track to finish the year up 4%, led by a 7.5% annual increase in Nonres Bldgs. but held back by a 9% drop in Power, 30% of the non-building total.
Spending took a downturn in April but this is expected to turn up after September. Most of the downturn is due to residential. By October all sectors are forecast to post gains.
 The difference between these two plots is INFLATION, which adds nothing to the volume of work. The CONSTANT$ plot is like the volume of business that takes place. The Spending plot shows the $ that changed hands to conduct that business volume.


Thank you for the analysis. Are the dollars presented in this post adjusted for inflation so that percentages represent real volume changes?
LikeLike
All the data is reported current $. But I’ll add a comparison plot of the three sectors in constant $ inflation adjusted. Striking comparison.
LikeLike