Home » Estimating
Category Archives: Estimating
Construction Briefs Apr 2025
Tariff actions are not yet reflected in Feb PPI Inputs or PPI Final Demand index. Still early. Also remember, PPI does not include imports or tariffs on imports. When we do see movement in the PPI, it reflects domestic pricing decisions following on tariffs.
Lutnick: “Foreign goods may become a little more expensive, but domestic goods do not.” FALSE see next par.
PPI Excludes Imports/Tariffs. The 2018 steel tariffs of +25% applied on imported steel. However the 2018 PPI data shows that the cost of ALL DOMESTIC steel mill products (of all types) produced in the US increased 18% in 2018, after the steel tariffs were imposed.
If tariffs, for example, affect only 10% or 20% of products used in the industry, then the PPI shows us the domestic producers reaction to tariffs, which gets applied to the other 80% to 90% of product. For instance all steel is not imported, so not all steel will experience a tariff. The point here is that tariffs impact pricing decisions on all domestically produced products, not just the imported products. Consumers pay the price.
Impacts on Construction Inflation and Spending (guesstimates).
2021 inflation was 8%-14%. 2022 it was 12%-17%. Could 2025 repeat 2022? Yes. Will it? ??? I guess it hits 6%-10%.
I’m guessing some projects contributing to 2025 spending will be canceled/postponed. So maybe spending drops 5% from here, to zero growth. Construction spending annual growth is normally in the range 4% to 10%. 2025 and 2026 were both forecast at 5% to 7%. No doubt some projects will be canceled or mothballed. So the next 3 yrs spending gets reduced, and cost gets increased.
I’m beginning to think one of the first issues we have to deal with is supply shortages. All types of imported products are not going to be available, and there aren’t enough domestic products to replace them. This will add delays and cost to building projects.
Yeears ago, when I was a construction cost estimator, a major client would run numbers on a proposed new building project. If it couldn’t balance a ROI in 7 yrs, project would not move forward. As cost to build increases, it becomes harder to hit ROI. This supports that some projects may be canceled or postponed.
- Construction – What to Watch
- Cost to build going up
- Cost to finance is up
- Product availability in question
- Product delivery schedule delays
- Margins pressured
- Small/Midsize firms squeezed
- Labor let go/disappearing
- Projects in planning, delayed
- Project ROI not met
- Projects planned, canceled
Virginia has the largest concentration of Data Centers in the U.S. Virginia is projecting energy shortages due to the extreme demand DCs put on power grids. If you don’t build out the energy grid, the data centers put too great a demand on the current grid. “There are six states in the United States where data centres already consume over 10% of the electricity supply, with Virginia leading at 25%.” https://www.iea.org/reports/energy-and-ai/understanding-the-energy-ai-nexus
In the Q1 pre-tariff outlook, Data Center spending (SAAR), began the year 16% above the avg of 2024, is steadily climbing at 1.5% to 2%/mo., and sometimes more, is now up 22% vs avg 2024. By midyear the rate of spending will be up 28%. Data Center spending increased 45% in 2023 and 56% in 2024. Forecast for 2025 +37%. Obviously, this could get reduced if/when some projects get canceled.
The New Albany (Ohio) project, projected worth $1bil, is one of the two announced DC projects that have been halted https://www.nbc4i.com/news/local-news/licking-county/microsoft-pulls-out-of-licking-county-projects/
What if: A 10%/yr reduction in forecast new Data Center starts in 2025 and 2026 would result in reduced Data Center construction spending by -3% in 2025, -7% in 2026, -7% in 2027 and -3% in 2028.
What if: A 10%/yr reduction in forecast new Data Center starts in 2025 and 2026, combined with a 10% cancelation of 2024 starts, would result in reduced Data Center construction spending by -8% in 2025, -10% in 2026, -8% in 2027 and -3% in 2028. A 10% drop in Data Center spending is $4bil/yr.
It is not clear if the two halted projects mentioned in the article above were already committed construction starts or future proposed starts.
The Fed Chair just said what every credible economist, every economics textbook, and every empirical study shows: Tariffs reduce output and raise prices. – Justin Wolfers, Econ professor at Michigan, Senior fellow, Brookings and PIIE.
Let’s not forget what initiated growth in new manufacturing facilities. New manufacturing building contract starts over the last 3yrs is just over $600bil. Normal starts without government investment would be about $300bil over 3yrs. About $100bil of spending growth over the 3 years is inflation, leaving the remainder of about $200bil in spending growth attributed to government investment. All that began, and most of it got spent, under the previous administration. https://www.forbes.com/sites/courtneyfingar/2024/12/12/manufacturing-jobs-boom-arrives-too-late-for-biden-to-benefit/
Whenever we get an unusually large increase in new construction starts and spending, the tapering off of those projects leads to a decline on the tail end. Mnfg new starts peaked in 2022-2023. We are entering the period of the manufacturing construction spending taper. Mnfg spending has fallen slightly in 4 of the last 5 months. The forecast for 2025 is down -10%.
Microsoft has announced a pullback in spending on new Data Centers. Reduced demand negates need for new facilities, kills expansion plans, lowers new construction forecast, decreases jobs growth in construction. Mothball if partially built factory, not only expensive for owner, but also negative impact to contractor’s forecast revenues.
Whenever there’s a devastating natural disaster, causing destruction to homes, property and infrastructure, the supply of contractors, laborers and materials stays the same while demand skyrockets from victims trying to rebuild. Contractors generally pick more profitable projects over less lucrative ones.
In the Construction Analytics Outlook Feb 2025 report I said, “Don’t be surprised if 2025 construction jobs growth slows a bit. Jobs are slightly ahead of volume growth, particularly in the Non-building Infrastructure sector.”
Construction gained 19k (+0.2%) jobs in Feb, BUT total hours worked declined 0.3%. Total jobs have increased but Hrs worked has gone down the last 5 months. We’ve posted minor jobs gains in both Jan and Feb, and yet unemployment has gone up from 5.2% in Dec to 7.2% in Feb.
The March jobs report shows only minor gains in the # of jobs. We’ve added only 24,000 new jobs in the 1st quarter, the slowest 1st qtr jobs growth in 13 years (except for 2020, Covid). But hours worked in March increased by 1.5%. That acts on the entire 8.3 million workforce and is equivalent to adding 128,000 more jobs.
The jobs numbers reported April 4th cover the period from Feb15-Mar15. There are not yet any impacts from tariffs reflected in the jobs numbers.
We may see the term “force majeure” come up a lot in the near future. And if construction contracts don’t have a force majeure clause, there may be a lot of contractors in trouble.
My guess is if the people of Greenland take a vote to Join the United States, it would be 99-1 No. Of course, they would say “No, thank you.” As they so eloquently put it, “We’re not assholes.”
Tariffs Create Unknown Costs to Construction
Assessing the impact of tariffs on the cost of construction accurately has now become a nearly impossible task. Tariffs can be on PARTS used in the manufacture of goods. Who (architect?, engineer?) will identify which parts included in which products used in the building are subject to tariff? Is only 10% of the whole product subject to tariff?
For example, look at something simple like light fixtures. The shell, the ballast, the reflector, the shade, the lamps or the wiring could be made in China. Who’s job will it be to identify where parts are made? How much is the cost of the part in question? Who now estimates the share of tariff increase on those parts to determine tariff impact on cost of manufacturing the entire light fixture?
Expand that issue to a pump assembly with valves and pressure gauges. Who identifies which parts in the pump assembly come from what country? How does an estimator determine the cost of manufacturing the pumps, valves and gauges and determine what fraction of total cost has a tariff?
This will inevitably lead to inflation, but it will be hidden inflation, hard to determine if a manufacturer’s price increase for a product is substantiated. This is not like the tariff on mill steel, a 25% tariff on mill steel which represents 25% of final structural steel bid, which represents 10% of the building cost.
At the conceptual or schematic design phase of construction, all the products are not even identified. And the project start date might be a year or two years out. It can’t possibly be determined with certainty what factor should be carried to cover cost increases due to tariffs.
Inflation factors and contingency factors will need to increase to cover known unknown costs. This increases the share of the budget that is unidentified, always a contentious issue with owners. Then instead, identify the known tariffs, but the unknown value of end-cost, and carry as an allowance. Frankly with the margins general contractors or construction managers get for services on a large construction project, these unknown factors, if understated in cost factors or left unaddressed, could wipe out the total fee or profit for the job.
This is not a good position to be in, but I don’t yet see how it would be any different.
PS Here we are in Feb. 2025. I wrote this six years ago. https://edzarenski.com/2019/08/01/next-level-of-tariffs-will-be-unknowns/

Construction Inflation & PPI 2025 updated 10-17-25
11-13-25 See new post Construction Inflation 2025 Update Nov. for all new index tables and plots update dates vary from July, Aug to Q3.
10-17-25 Residential Index reduced and minor reduction in Nonres Bldgs Index, see notes in Construction Analytics Building Cost Indices and Reference Indices. The tables and plots included data only thru July.
9-3-25 Updated PPI tables and plots to JULY data issued 8-15-25.
5-15-25 all ppi DATA UPDATED TO APR
2-21-25 All new data updated to Q4. A major change with this new data / plots, is the change in the base date from 2019 to 2024. These index tables / data cannot be mixed with prior issues. Now using base 2024 = 100 in all data / plots included here. Percents yr/yr or mo/mo don’t change, the indexes change.
To properly adjust the cost of construction over time you must use an Actual Final Cost Inflation Index, otherwise called a selling price index. General construction cost indices and Input price indices that don’t track whole building final cost do not capture the full cost of escalation in construction projects.
Spending Must Be Adjusted by Inflation
Usually, construction budgets are prepared from known “current” costs. If a budget is being developed for a project whose midpoint of construction costs is two years in the future, you must carry in your budget an appropriate inflation factor to represent the expected cost of the building at that time. Why the midpoint? Because half the project cost occurs prior to that point and half occurs later than that. Actually, the midpoint of spending is 50-60% into the schedule, but the calculation to the midpoint of schedule is close. So, the average inflation for the project includes early contracts that have less inflation than average and also later contracts that would have more than the average inflation. Construction inflation should always be calculated from current cost to midpoint of construction, or in the case of using historical data and converting an older actual cost to a future budget, from midpoint to midpoint.
Any time a construction project is delayed or put on hold to start at some future date, construction cost inflation must be calculated and added to the previous budget to account for the unanticipated cost increase due to the delay. Of utmost importance is using appropriate cost indices and forecasting future cost growth to account for the difference in original budget and revised budget.
Besides the estimator’s need to accurately reflect future expected cost, inflation is an important aspect of the company business plan. Typically discussed in tandem with spending, inflation has an impact on tracking and forecasting company growth. All spending includes inflation, but inflation adds nothing except $ signs to the overall growth. For example, in a year when company revenues (spending) increase by 10%, if inflation is 6%, then total business growth is only 4%. To accurately calculate growth, and the need for labor to support that growth, spending must be adjusted by the amount of inflation.
Since 2011, Nonres Bldgs inflation is 4.8%, Residential is 5.4% and Non-bldg is 3.9%. But those averages include the unusually high inflation years of 2021 and 2022. Without those two years, since 2011, average inflation for Nonres Bldgs is 3.8%, Residential is 3.8% and Non-bldg is 2.4%.
2025 Inflation Forecast, Nonres Bldgs +4.0%, Residential +4.7% and Non-bldg +4.0%.
5-15-25 2025 Inflation Forecast, Nonres Bldgs +4.4%, Residential +5.0% and Non-bldg +4.3%.
Types of Construction Inflation Indices
General construction cost indices and Input price indices that don’t track whole building final cost do not capture the full cost of inflation on construction projects.
Consumer Price Index (CPI), tracks changes in the prices paid by consumers for a representative basket of goods and services, including food, transportation, medical care, apparel, recreation, housing. The CPI index in not related at all to construction and should not be used to adjust construction pricing.
Producer Price Index (PPI) for Construction Inputs is an example of a commonly referenced construction cost index that does not represent whole building costs. The PPI tracks material cost inputs at the producer level, not prices or bids at the as-built level.
Engineering News Record Building Cost Index (ENRBCI) and RSMeans Cost Index are examples of commonly used indices that DO NOT represent whole building costs yet are widely referenced by construction firms and estimators everywhere to adjust project costs. Neither includes contractor margins.
It should be noted, there are far fewer available resources for residential inflation than for nonresidential inflation.
One of the best predictors of construction inflation is the level of activity in an area. When the activity level is low, contractors are all competing for a smaller amount of work and therefore they may reduce bids. When activity is high, there is a greater opportunity to bid on more work and bids can be higher. The level of activity has a direct impact on inflation.
To properly adjust the total cost of construction over time you must use actual final cost indices, otherwise known as selling price indices.
Selling Price is whole building actual final cost. Selling price indices track the final cost of construction, which includes, in addition to costs of labor and materials and sales/use taxes, general contractor and sub-contractor margins or overhead and profit.
Construction Analytics Building Cost Index, Turner Building Cost Index, Rider Levett Bucknall Cost Index and Mortenson Cost Index are all examples of whole building cost indices that measure final selling price (for nonresidential buildings only).
Residential inflation indices are primarily single-family homes but would also be relevant for low-rise two to three story building types. Hi-rise residential work is more closely related to nonresidential building cost indices.
Producer Price Index (PPI) Final Demand Indices are an example of construction cost indices that represent whole building costs. Final Demand PPI, or Selling Price, represents contractors bid price to client. Includes labor, material, equipment, overhead and profit. Labor includes change in wages and productivity.
PPI Final Demand Indices should not be referenced monthly. These are quarterly indices. Every three months (Jan, Apr, Jul, Oct) BLS performs an update survey to correct the PPI Final Demand indices. For more than two years, in most quarters, about 80% to 90% of the change in the index for the quarter was posted in the update month. In some quarters, growth is flipped from negative to positive. And still in other quarters the correction month doubles or halves the rate of growth. There is no way to determine how much occurred in the update month or a previous month, but the update # along with the two previous months will get too the correct end-of-qtr index.
January is an update month. PPI Final Demand for Jan index basically includes the correction for Nov and Dec. Therefore, the index should NOT be compared mo/mo. There is only one of three months that the index is known for certain to be accurate, the update month. Compare qtr/qtr, but make sure to use the defined months, the correct update month with two previous months. For ex., (Jan+Dec+Nov) / (Oct+Sep+Aug). Those are the defined quarters. (I don’t make the rules).
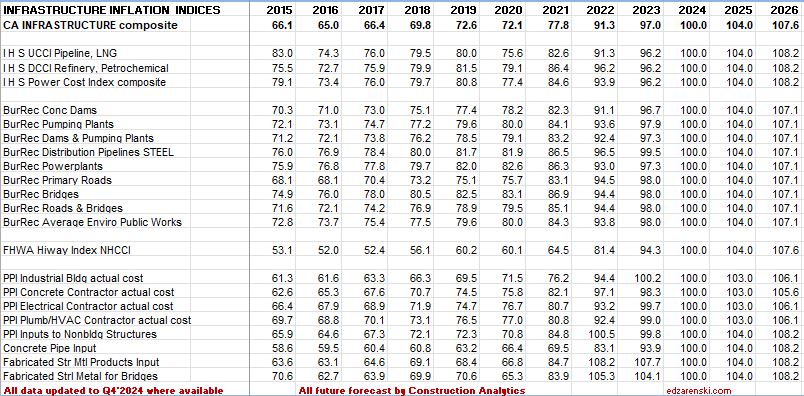
Refer to National Inflation Indices for comparison to several national selling price indices or various Input indices. National reference indices are useful for comparison. Few firms project index values out past the current year, therefore all future projections in these tables are by Construction Analytics.
Construction Inflation History
Post Great Recession, 2011-2020, average inflation rates:
Nonresidential buildings inflation 10-year average (2011-2020) is 3.7%. In 2020 it dropped to 2.5%, but for the six years 2014-2019 it averaged 4.4%. In 2021 it jumped to 8%, the highest since 2006-2007. In 2022 it hit 12.8%, the highest since 1980-81.
Residential 8-year average inflation for 2013-2020 is 5.0%. In 2020 it was 4.5%. In 2021 it jumped to 14% and then in 2022 reached 15.8%. the highest on record.
30-year average inflation rate for residential and nonresidential buildings is 4.1%. But when excluding deflation in recession years 2008-2010, for nonresidential buildings the long-term average is 4.7% and for residential is 4.9%.
For Non-bldg Infrastructure the 30-year average is 3.6%. When excluding deflation in the recession years 2008-2010, Non-bldg long-term average inflation is 3.9%.
All of these long term averages went up in recent years because instead of including 1991-1994, at 2%/yr, we are now including 2021-2024, at 7%/yr to 8%/yr. All long term and short term inflation rates went up.
Since 2011, Nonres Bldgs inflation is 4.8%, Residential is 5.4% and Non-bldg is 4.3%.
- Long-term construction cost inflation is normally about double consumer price index (CPI).
- In times of high construction spending growth, nonresidential construction annual inflation averages about 8%. Residential has gone as high as 10%.
- Nonresidential buildings inflation (prior to 2021-2022) averaged 3.7% since the recession bottom in 2011. Six-year 2014-2019 average is 4.4%.
- Residential buildings inflation (prior to 2021-2022) reached a post-recession high of 8.0% in 2013 but dropped to 3.5% in 2015. It has averaged 5.3% for 8 years 2013-2020.
- Although inflation is affected by labor and material costs, a large part of the change in inflation is due to change in contractors’ and suppliers’ margins.
- When construction volume increases rapidly, margins increase rapidly.
- Deflation is not likely. Only twice in 50 years have we experienced construction cost deflation, the recession years of 2009 and 2010. That was at a time when business volume went down 33% and jobs were down 30%.
Historically, when spending decreases or remains level for the year, inflation rarely (only 10% of the time) climbs above 3%. Avg inflation for all down/flat years is less than 1%. That did hold true in 2020 for both Nonres Bldgs and Non-bldg Infra. It also held true in 2023 for Residential. It did not hold true in 2021 or 2022. In 2021, spending was down for nonresidential buildings and flat for non-building. Inflation for both was over 8%.
Differences in Tracking Period
Be careful when referencing YTD growth. YTD can be the growth so far this year, that is, growth compared to December of the prior year, or it can be YTD currentyr/YTD lastyr. Neither represents the growth from the avg of the previous year, which becomes the historical value. Both are useful during the year to judge trends. The average growth for the year accounts for all the peaks and valleys within each year and and is the value carried forward into the index tables and charts.
Also, use caution when referencing Dec/Dec growth. An example of the difference between Dec/Dec tracking or year over year, and annual average tracking, is Steel Mill Products which was down 28.7% Dec22/Dec21, but the annual average for 2022 is still up 9.0% from the average 2021. In fact, the three years 20-21-22 show Dec/Dec combined inflation is +71%, but the annual averages for those same three years shows total inflation growth of 87%. Annual averages should be used to report inflation.
PPI Excludes Imports and Tariffs
When assessing or tracking the pricing effect of tariffs on construction materials, keep in mind that the Producer Price Index (PPI) does not include imports (imports are not produced in the US), so therefore, does not include tariffs. See items 4 and 24 in the FAQ provided by the Bureau of Labor Statistics. Construction PPI changes reflect pricing decisions domestic producers make on domestic products in reaction to tariffs on imported products. Tariffs have big impact on domestic prices.
BLS explanation of method and definitions
The price change we see in the PPI for construction materials reflects the domestic material prices of ALL other domestically produced materials used in the industry. While tariffs may affect only 10% of products used in the industry, the PPI shows us the domestic producers reaction applied to the other 90%.
For example: The 2018 steel tariffs of +25% applied only on imported steel, affected only 30% (the imported share) of steel used in US. However the PPI shows us that the cost of ALL DOMESTIC steel mill products (of all types) produced in the US increased avg 18% in 2018, after the steel tariffs were imposed. Prices of domestic steel receded somewhat, but the point is that tariffs caused a price increase also in domestic steel. The increase in PPI is domestic producers pricing response in reaction to tariffs. Tariffs impacted pricing decisions on all domestically produced products, not just the imported products. Consumers pay the price.
PPI Construction Materials Inputs Indices
See this post for August PPI update Construction Briefs Sept 2025
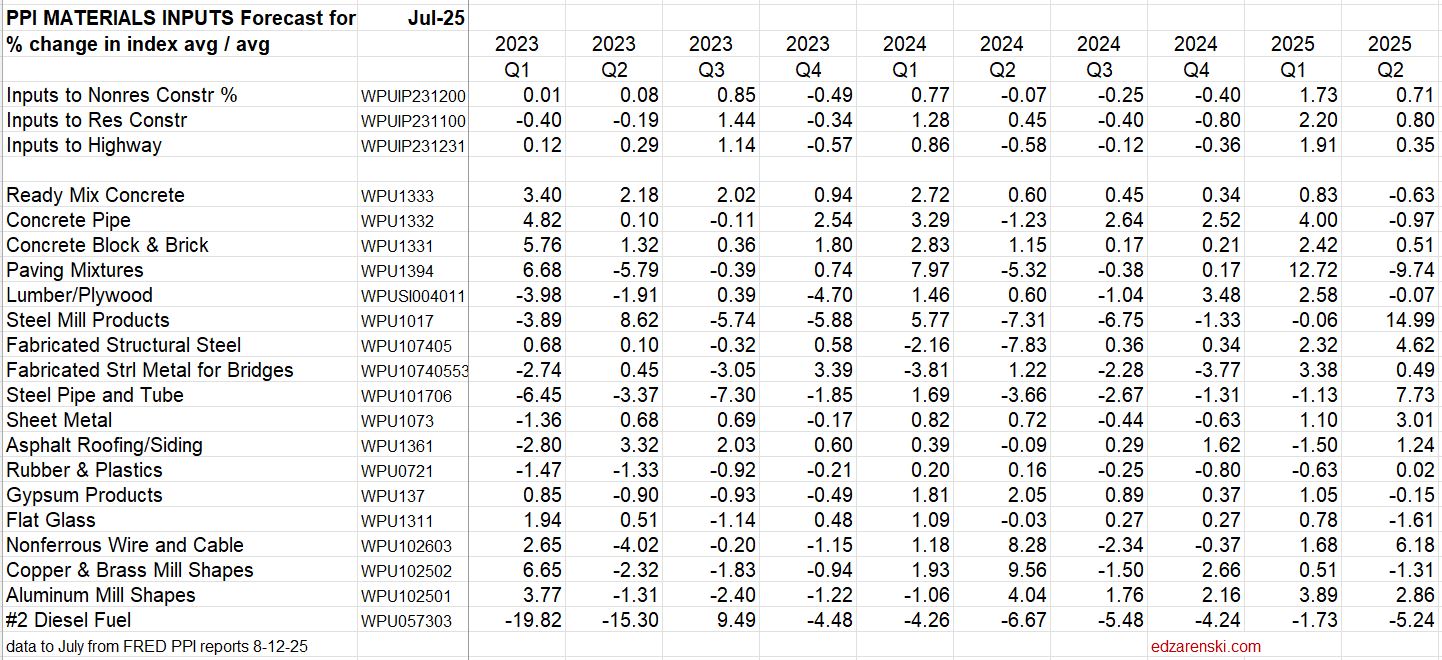
ALL PPI DATA TABLES UPDATED TO JUL 8-15-25
ALL PPI DATA UPDATED TO APR 5-15-25 PPI data INPUTS for the month of Apr: Paving Mixtures -9.5%, Steel Mill Products +5.8%, Steel Pipe & Tube +6.3%, Nonferrous Wire +3.7% YTD25/avg24: Concrete Pipe +8.5%, Paving Mixtures -8.5%, Lumber/Plywd +4.9%, Steel Mill Products +3.7%, Nonferrous Wire +3.5%, Diesel -10.8%. PPI data FINAL DEMAND Apr closes out Q1. Q1’25/Q4’24: Avg Nonres Bldgs +0.6%, School +0.4%, Healthcare +2.2% YTD25/avg24: Avg Nonres Bldgs +1.35%, School +1.4%, Office +1.6%, Healthcare +2.91%.
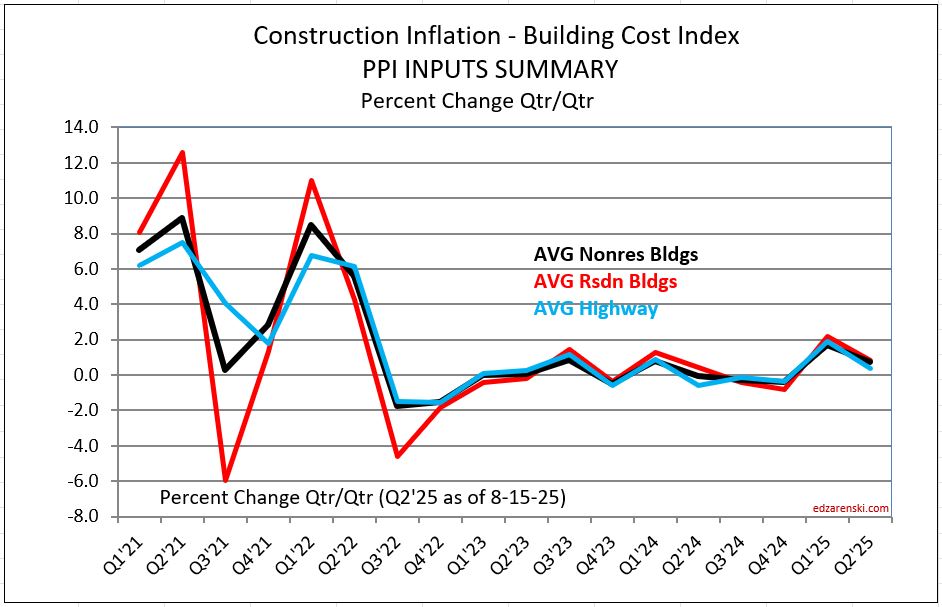
Inputs Table updated 2-15-25 Jan’25 Inputs are up, +0.8% to Nonres, +1.2% to Residential and 1.2% to Highway, the largest increases since Jan’24. The largest Input item increases in January are Paving Mixtures (up 14.6%), Diesel Fuel (up 3.6%), Concrete Brick, Block & Pipe (up 2.2%), Copper & Brass Shapes (up 1.9%) and Flat Glass (up 1%). Steel Pipe & Tube is down 1.3%. Both Lumber/Plywood and Fabricated Structural Steel are down 0.5% or less.


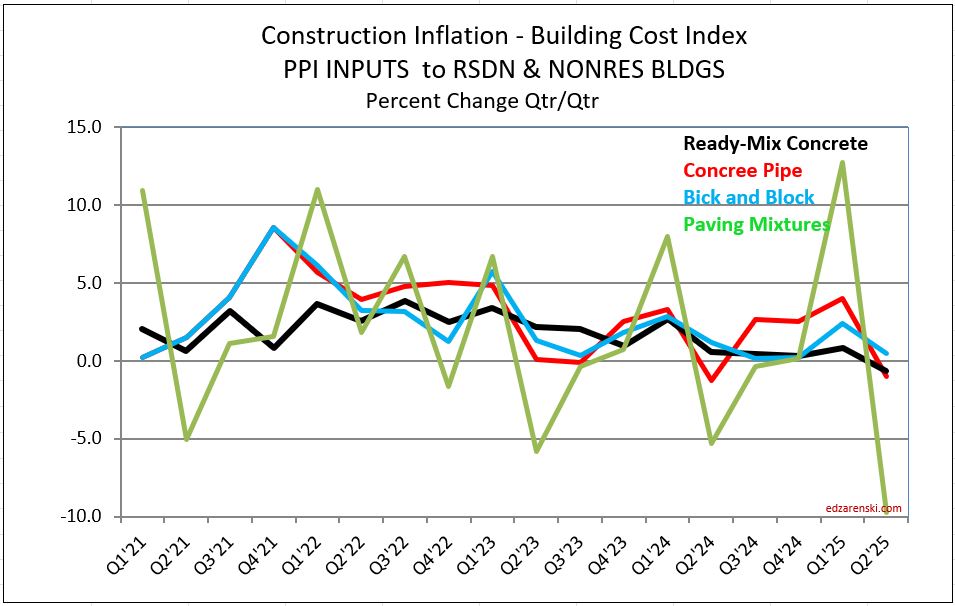

In the quarterly percent change table you can see the drop in Q3’22 and more in Q4’22, a sharp change in the rate of inflation. This shows up as expected in lower average of Inputs to Res and NonRes for 2023.
2-15-25 PPI Materials Inputs for 2024 to Residential are up 1.7%, to Nonres Bldgs are up 0.6% and to Highway are up 0.5%.
In all three of these Inputs PLOTS, the materials plots above and this Summary plot, so far Q1’25 is only Jan. It will wiggle around for 2 more months.
A General construction cost index or Input price index doesn’t track whole building final cost and does not capture the full cost of inflation in construction. Final cost indices represent total actual cost to the owner and are often higher than General indices. Producer Price Index (PPI) INPUTS to construction reflect costs at various stages of material production, generally do not represent final cost of materials to the jobsite and do not include labor, productivity or margins. PPI Final Demand indices include all costs and do represent actual final cost to the Owner.
PPI Construction Final Demand Indices
PPI Final Demand indices should not be referenced monthly. These are quarterly indices. PPI Final Demand Indices are for Nonresidential Bldgs only. Every three months (Jan, Apr, Jul, Oct) BLS performs an update survey to correct the PPI Final Demand indices for the current month and the previous two months. For more than two years, in most quarters, about 80% to 90% of the change in the index for the quarter was posted in the update month. In some quarters, growth is flipped from negative to positive in the update month. And still in other quarters the correction month doubles or halves the rate of growth. January data (released in Feb) is an update month. The PPI Final Demand for Jan. is basically the correction for Nov.+Dec.+Jan. The index should NOT be compared mo/mo. Compare qtr/qtr, but make sure to use the correct update month with two other months, (Nov+Dec+Jan)/(Aug+Sep+Oct).
Due to the nature of the PPI Final Demand Index, (2 monthly readings from model then every 3rd month correction by contractor survey), the correction month for 5 of the last 8 quarters flipped the sign of the modeled months. In 2 of the remain 3 months the correction months more than doubled the rate of change for the previous 2 months. There is no other proof needed to convince you to take care when using this index. Get it right.
2-15-25 The PPI Final Demand table below is updated to JAN 2025 data.
PPI data FINAL DEMAND Apr closes out Q1.
Q1’25/Q4’24: Avg Nonres Bldgs +0.6%, School +0.4%, Healthcare +2.2%.
YTD25/avg24: Avg Nonres Bldgs +1.35%, School +1.4%, Office +1.6%, Healthcare +2.91%
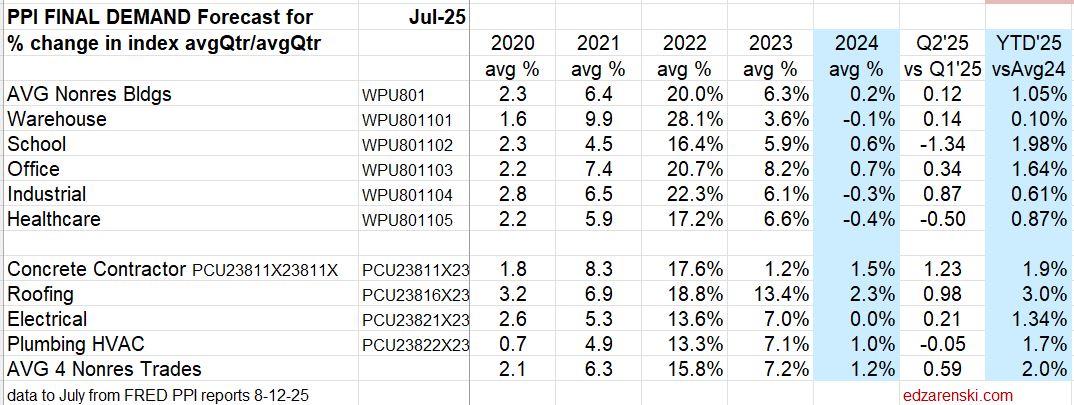
Jan is the correction month for Q4, so the Jan 2025 value closes out the 4th qtr 2024. Most bldg types and contractors are up in the 2nd half 2024 from the 1st half, but cost growth has been nearly flat. If extended, the trend leading into 2025 is for slow inflation growth. However the Roofing trades are increasing at a slightly faster rate than all others.
Due to the nature of the PPI Final Demand Index, (2 monthly readings from model then every 3rd month correction by contractor survey), it is not uncommon that the contractor survey correction month flips the sign of the modeled months for the quarter.
In 2023, for each quarter, we see two months posted positive, then a large negative value for the correction month. The negative correction is large enough in all cases to turn the entire quarter negative. Here’s an example: for the period May-Jun-Jul, Jul is the correction month. PPI values were +0.09%, +0.02%, -1.23%. The average for each of the 3mo is -0.37%, (the sum of the 3 months divided equally. The May and Jun values that were originally posted based on modeling flipped from + to – after the contractor survey value is applied to the QTR. That highlights why PPI Final Demand indices should not be referenced monthly.
However, these declines are from such a high mark at the end of 2022 (we began 2023 up 11%), that the rate as we began 2024 is still up 6% to 7% from the average in 2022.
9-5-25 Q2 Final Demand Index closed out with this July data. Both Table and Plot are updated.


SEE ALSO PPI Data Sept’24
Construction Analytics Building Cost Indices and Reference Indices
2-21-25 Current and predicted Inflation updated to Q4’24
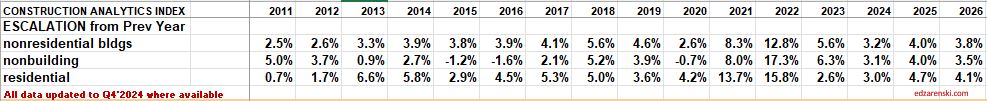
- 2022 Rsdn Inflation 15.8%, Nonres Bldgs 12.8%, Nonbldg Infra 17.3%
- 2023 Rsdn Inflation 2.5%, Nonres Bldgs 5.6%, Nonbldg Infra 6.3%
- 2024 Rsdn Inflation 3.0%, Nonres Bldgs 3.2%, Nonbldg Infra 3.4%
Since 2011, Nonres Bldgs inflation is 4.8%, Residential is 5.4% and Non-bldg is 4.3%.
2-21-2025 Inflation Forecast, Nonres Bldgs +4.0%, Residential +4.7% and Non-bldg +4.0%. (This is a pre-tariff forecast.)
5-15-2025 Inflation Forecast, Nonres Bldgs +4.4%, Residential +5.0% and Non-bldg +4.3%. (This is a preliminary tariff forecast.)
9-3-2025 Inflation Forecast, Nonres Bldgs +4.4%, Residential +4.7% and Non-bldg +4.0%. (This is a preliminary tariff forecast.)
10-17-2025 Inflation Forecast, Nonres Bldgs +4.2%, Residential +3.8% and Non-bldg +4.0%. (This is a preliminary tariff forecast.) These October revisions are NOT yet carried into the tables and plots. Only Residential changed considerably, however, it is the most dependent on government data, which is currently not available. The biggest change is in the Census Bureau Lasperyes Index, a constant quality residential new build index, which now includes August data and both June and July were revised down slightly.
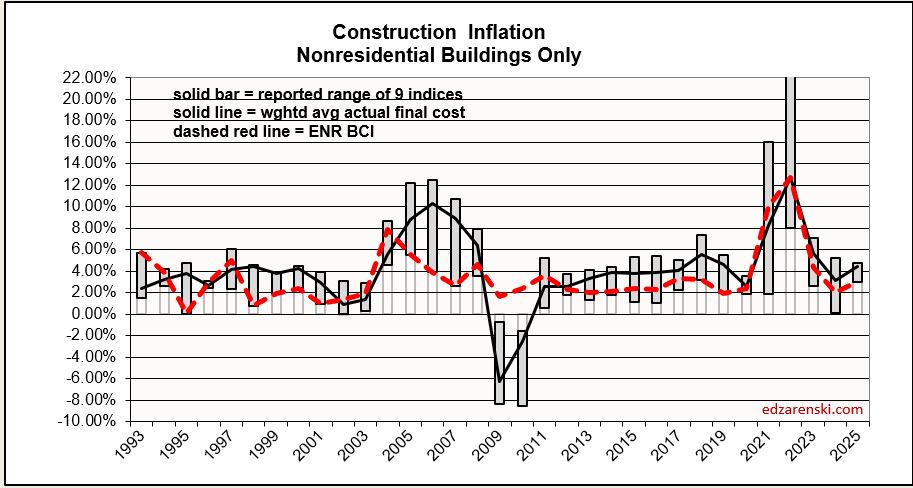
The following Construction Inflation plot (for Nonresidential Buildings only) shows three elements: 1) a solid grey bar reflecting the max and min of the 10 indices I track in my weighted average inflation index, 2) a solid black line indicating the weighted average of those 10 indices, and 3) a dotted red line showing the Engineering News Record Building Cost Index (ENR BCI). Notice the ENR BCI is almost always the lowest, or one of the lowest, indices. ENR BCI, along with R S Means Index, unlike final cost indices, do not include margins or productivity changes and in the case of ENR BCI has very limited materials and labor inputs.
Most of the tables and plots here are cumulative indexes. Construction Inflation annual percents for the three major sectors, Residential, Nonresidential Bldgs and Non-building Infrastructure, are recorded in this short table, Escalation form Prev Year. Useful to compare to last year, but you would need to mathematically do the compounding to move over several years.
Final cost indices represent total actual cost to the owner and are generally higher than general indices. Producer Price Index (PPI) INPUTS to construction reflect costs at various stages of material production, generally do not represent final cost of materials to the jobsite and do not include labor, productivity or margins. Even with that, a PPI Inputs index +20% for a material could be only a +5% final cost. PPI Final Demand indices include all costs and do represent actual final cost. The solid black line (above) represents the Construction Analytics Building Cost Index for Nonresidential Bldgs and is a final cost index.
9-3-25 Although the PPI data was all updated, as of yet it does not have a big effect on inflation. Some slight increase is built into my inflation to account for PPI increasing in the 2nd half. The inflation tables do not yet need an update. Inflation tables will be updated soon.
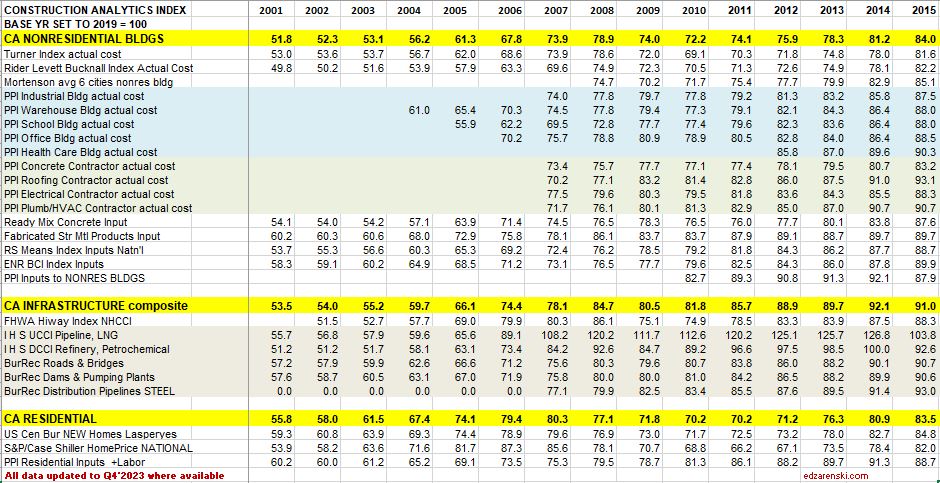
2-21-25 All index tables and plots updated to Q4’24. NOTE: all prior index tables were set to base year 2019=100. All these updated tables are set to base year 2024=100.
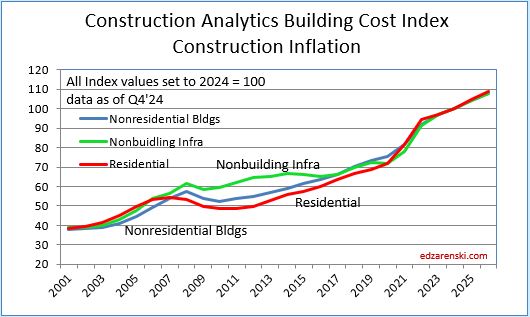
All of the Index Tables and the plot below, Construction Analytics Building Cost Index, show the cumulative inflation index, or the cumulative compounded effect of inflation for any two points in time.


How to use an index: Indexes are used to adjust costs over time for the effects of inflation. An index already compounds annual percent to prevent the error of adding annual percents. To move cost from some point in time to some other point in time, divide Index for year you want to move to by Index for year you want to move cost from, TO/FROM. Costs should be moved from/to midpoint of construction, the centroid of project cost. Indices posted here are at middle of year and can be interpolated between to get any other point in time.
The three yellow highlighted lines in the index tables are plotted here. The three major sectors, Residential, Nonresidential Buildings and Non-building Infrastructure,
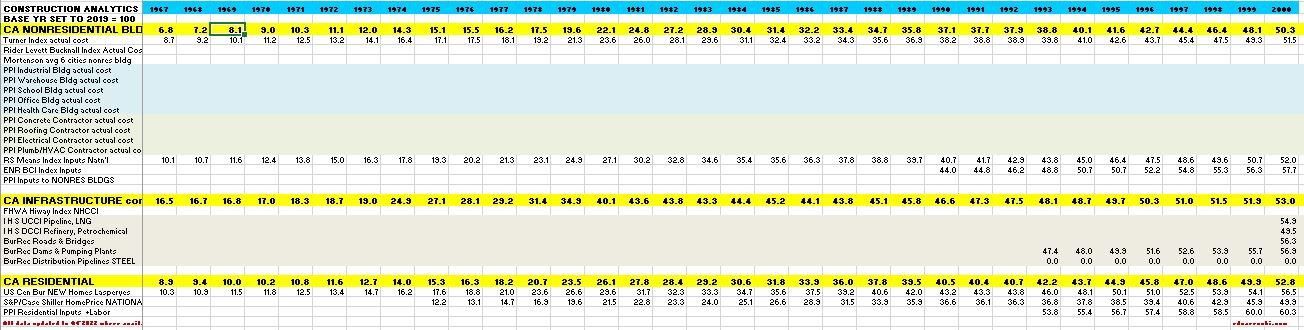
This table and plot is an extension of the tables and plots above. Data is as of Q4 2023, but the table covers from 1967 to 2000. Data is pretty sparse.

Non-building Infrastructure Indices

In the Index tables above, dividing the current year by the previous year will give the current year’s inflation rate. All indices are the average rate for the year.
Also, in the tables above, all reference indices data is gathered from the original source, then all are normalized to a common base, 2019 = 100. This allows us to see how different indices compare.
Comparison of Indices
This plot compares four final cost indices and three inputs cost indices. Prior to 2020 there is a lot of symmetry in the final cost group. Everything changed after that.

Previous year Construction Inflation 2024 – last updated JUL 2024 – BASE 2019=100
SEE ALSO Tariffs Create Unknown Costs to Construction
Links to Data Sources Construction Inflation >>> Links
Outlook 2025 CONSTR OUTLOOK 2025 Feb 2025
Links to Explanations of PPI Index PPI Explanation provided by AGC
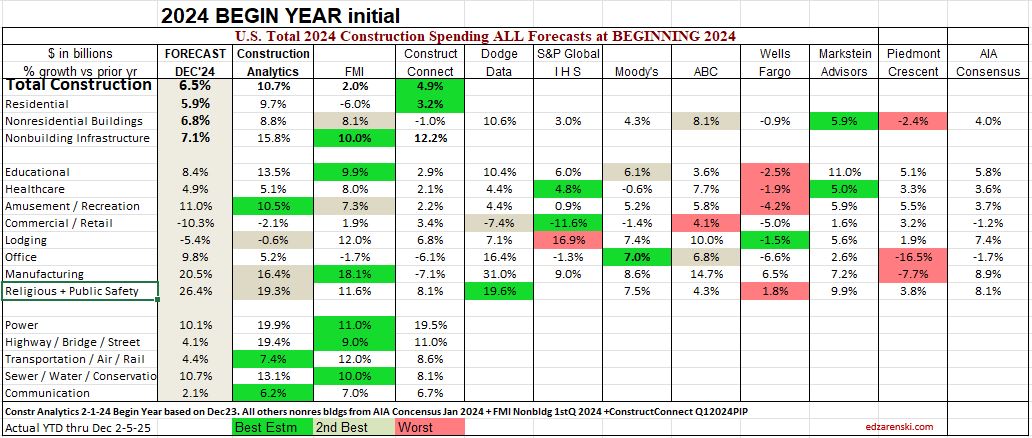
Compare 10 Construction Spending Forecasts for Nonres Bldgs Feb 2025
Construction Analytics updates the Construction Spending Forecast every month, usually publishing at least a Brief, every other month. The AIA Consensus solicits forecasts from 9 firms that prepare construction spending forecasts and publishes a Consensus Forecast every January and every June-July. The AIA Consensus reports only on nonresidential buildings.
This table captures the percents growth issued by the 9 firms reporting in the AIA Consensus and the Consensus average. Included is Construction Analytics full forecast. Also included, FMI and Construct Connect also provide full forecasts. Capturing this history provides a ready template to compare “How’d we do?” at the end of the year. It’s not often that we get to look back at forecasts to see how they performed when compared to the actual results. But I’m sure you’ve been asked, “Did you ever go back and look to see how you’ve done?”
You can see in this most recent 2025 table that some of the forecasts vary widely. For instance, in the most recent forecast for 2025: Data Centers forecasts range from +17% to +42%; Manufacturing from -11% to +18%; Educational -2% to +10%; Healthcare -1% to +21%; Warehouse -9% to +12%; Lodging -7% to +22%. Very few (if any) forecasts are in agreement. That’s why it’s valuable to capture the data and compare it to actuals once all the data is in at the end of the year. The first total for every year is issued in Feb., but the final annual actual value is subject to Census revisions until July of the following year,
These are the current Jan forecasts for 2025 nonresidential Buildings spending

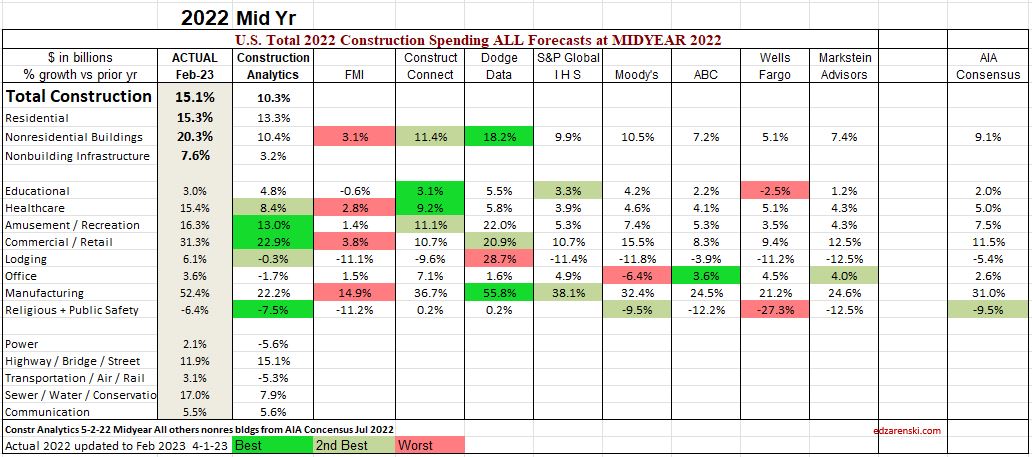
Here are some past results, looking back in chronological order. Each table summarizes the percent growth forecast issued by each forecaster. Then, the forecasts are compared to the actual value. Individual market forecasts are marked as best, 2nd best and worst forecast. Color makes it easy to see the performance at a glance. This is a simple table collecting all the forecasting data for one period into one table for ease of comparison. Nothing is changed after the forecasts are issued, except for the actual data at year-end to which it is compared, which gets revised three times through July of the following year after the annual results are posted. You will see that I’ve done better in some forecasts than others. I scored a lot of the 2nd best estimates. Other old posts on this blog show the year I absolutely bombed, 2021, I think. My column was a sea of red. You might think that the updated Midyear forecast is always an improvement from the Beginning of year forecast, but that is not always the case, as you will see. The numbers don’t lie. We post our forecasts and wish for the best. Sometimes we get the best.

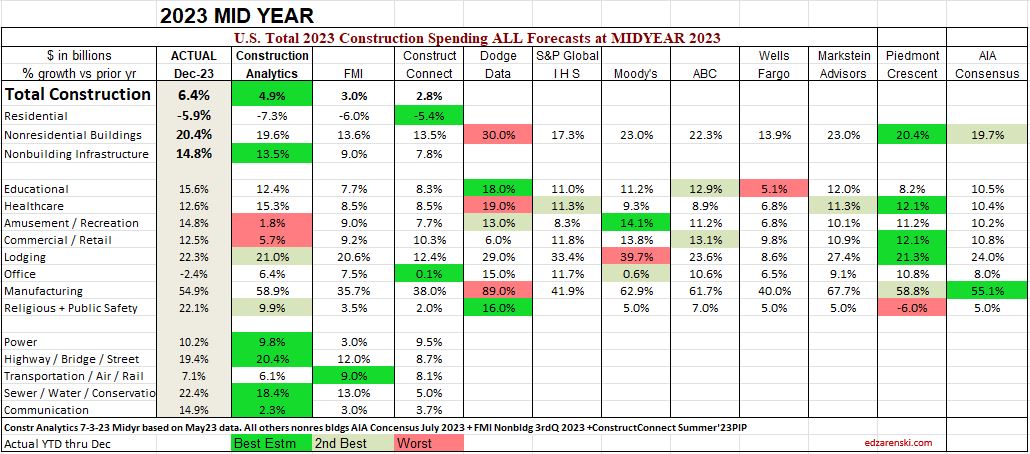


The inquisitiveness in me wants to know how this shakes out, so I put a score to the results. Here’s three years of completed data with two forecasts each year, but I took out (low scoring 8pts) Piedmont, as they were not involved to provide a forecast for 2022. So, How’d we do? These six tables, two each from 2022, 2023 and 2024, are scored here. There are 8 Nonres Bldgs markets plus the Nonres Bldgs total included in the count, so there are 9 line items. I gave 3 pts for best, 2pt for 2nd and -1 for worst.
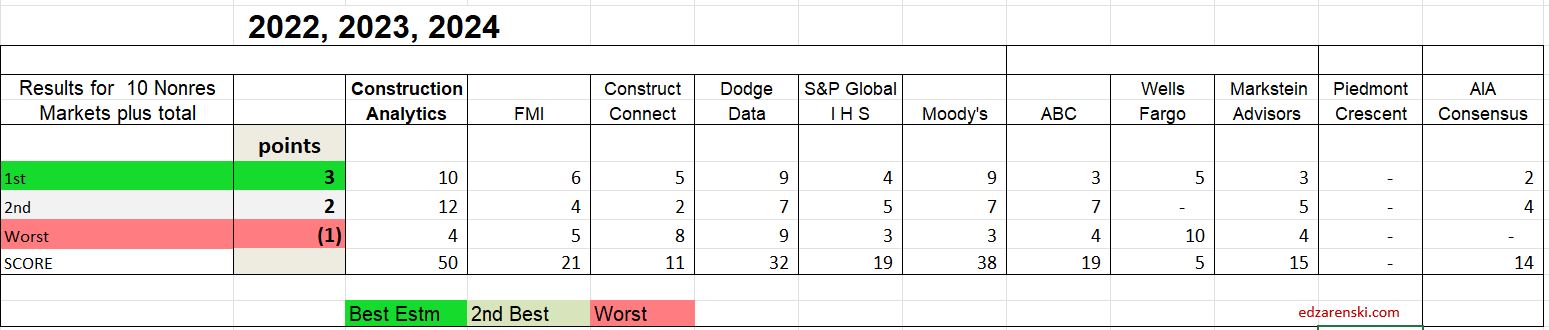
See any favorites of yours in the list of forecasters? Well, this is a small subset of their forecasting performance over recent years. What’s their score?
I summed the same sets of data back to 2020 to find if this trend, that Construction Analytics is scoring highest, is consistent. Again, I took out (low scoring 8pts) Piedmont, as they did not provide a forecast in 20, 21 or 22. The trend is similar. ABC picked up the most points (29), Markstein Advisors picked up 26, but Construction Analytics still picked up 22 points and retained the top spot.
The maximum any company can score in one forecast is 27 by scoring best on all 8 line items plus the total. The highest single forecast score in five years by any company is 17, that was by Construction analytics in the 2023 Beginning of Year forecast. Out of 11 firms across 9 forecasts in 5 years (no 2020 Beginning forecast and only 4 for Piedmont), or 94 forecasts, only 7 times has any firm scored higher than 10 out of a max 27. That might even make you think forecasting is difficult.
Sometimes, no forecast gets even close to the actual number. As an example, in the 2022 Beginning of year forecast, the average difference from forecasts to actual growth for Manufacturing was off by 40%+. The closest forecast was only within 23%. Why is that? Well, I base my forecast of construction starts. I’m sure others do too. New starts reported for a 3yr period 2020 thru 2022 averaged $50bil/year. But construction spending for the same period grew from $75bil/yr. to $125bil in 2022 and then shot up to $190bil in 2023. The starts report did not give a clear indication of what was leading into spending.

Some of the things I watch for when preparing my forecast are; What is the current rate of spending (Dec’24), compared to the year (2024) average, as we begin the new year (2025)? and What is the recent rate of growth? Does my forecast fit within the current trend? For example, as we begin 2025, the current rate of spending in Q4 2024 on Data Centers is already up 16% from the average of 2024, and it is climbing at a rate from 1%/mo to a few percent per month. That means that unless we experience some unexpected event that would cause spending to decline, we will easily increase from 16% growth to far greater by the end of 2025, or for that matter even by the end of Q1. So, the low is already established at 16% as we begin the year. All growth is an increase from there. New starts have averaged growth of 50%/yr for the last three years, so growth is established. There are a few low forecasts of 17%, 18% and 19% spending growth for the year. That would mean remaining spending growth for all of 2025 would be 1% to 3%, but that’s not realistic with new starts at 50% growth. Forecasts in the range of 20% +/- will be surpassed in the first few months of 2025. The AIA consensus 2025 forecast for Data Centers is +21.9%. I suspect that will be surpassed before Q1 is over.
There are some older posts on this blog that capture this info from earlier years. Not sure at this point what the title of the post would be to search for them. If you are so inclined, try searching for AIA or for the word Compare or Consensus. SEE Link Below. I had awful results one year.
So, I may not have prepared the best total forecast every year from 2020 thru 2024, but overall, I posted the most overall 1st or 2nd best line by line forecasts. In fact, for the Nonres Bldgs Totals (the sum of the 8 markets), out of the 9 forecasts from 2020 thru 2024, I had only 2 of the best Totals forecasts. Markstein Advisors is the only other firm that had 2 of the best totals forecasts.
I will close by saying, the data for the past 3 years or even 5 years shows that I’m providing you with the longest trend best forecast of Nonresidential Bldgs cost growth, and I’m happy to do so.
Los Angeles Fires – Reconstruction
This is a preliminary estimate of what it might take to rebuild buildings and infrastructure lost to the incredible firestorms we are witnessing in Los Angeles. We don’t yet know precisely the vast extent of damages, but there has been some early projections of 10,000 buildings lost and $150 billion in damages. So, there is a lot of estimation here, but also some necessary information on which to base this estimate of reconstruction.
Census tracks employment by metro areas. Although all cities and towns are not listed, the total employment is captured within these sometimes broad areas. To understand how many construction jobs currently exist in the LA metro area, I’ve included all Census defined metros around LA. The Los Angeles metro area, to approximately a 50 mile radius, which includes Los Angeles, Long Beach, Glendale, Anaheim, Santa Ana, Irvine, Santa Barbara, Oxnard, San Bernardino and Riverside, currently has approximately 400,000 construction jobs. https://www.bls.gov/regions/west/california.htm#tab-1
In the most recent years, 2021, 22, 23 and 24, this entire pool of jobs had annual growth of 1%/yr., or only about 4,000 jobs per year. From 2011 thru 2019 the jobs growth rate averaged 6%/yr, or about 15,000 to 20,000 jobs per year. Once in 20 years (2015) jobs increase 10%, which at that time was about 25,000 jobs and that occurred in a year when volume posted the largest increase ever. Jobs have not increased more than 4%/yr since 2017.
Nationally, jobs growth (excluding the losses in 2020) has averaged 3.5%/yr since 2011. Growth has not exceeded 5%/yr since 1999.
We need to predict jobs growth at a reasonable rate of growth. With recent LA metro construction jobs growth at 1%/yr., not more than 4% growth in the last 8 yrs., and national average growth of 3.5% over the last 15 years, but currently with excessive demand influencing growth, I will use a future growth rate of 5%/yr. Currently that works out to adding 20,000 jobs per year.
The Harvard Joint Center for Housing Studies recently posted that In Texas, California, New Jersey, and the District of Columbia, immigrants make up more than half of construction trade workers. This analysis will make no effort to discuss the potential impact of immigrants in the workforce, but we must recognize the makeup of who is filling these jobs. Keep in mind after this analysis reaches some conclusions that this aspect may weigh heavily on the outcome.
We do not know the average value of the buildings destroyed, nor do we know how many are residential buildings and how many are civic or retail buildings, but we have a preliminary estimate of 10,000 buildings lost and $150 billion in damages. As of yet we don’t know how much of that $150 billion is buildings. We do know some is autos and some is public utilities, but we don’t know how much. Expecting we will know some of this information at a future date, at best, all we can do is predict for a portion of that lost that will be easily used to expand our estimate at a later date.
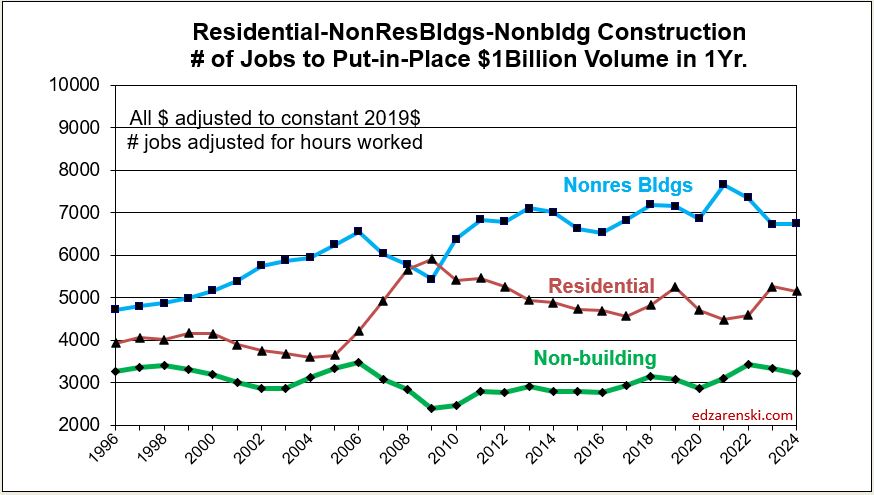
Rather than work with a quantity of buildings, which creates some difficulty because buildings have different total value, we can work with the dollar value of the damage estimates, because we have some historical information of how much in dollar value can be put-in-place by some number of jobs.
Let’s work with an increment of $10 billion dollars of damaged buildings and determine how much labor might be available to rebuild those losses and how long it would take. Recognize that $10 billion is very likely low when compared to the total estimated value of damage, but it gives us an easily workable increment to adjust our estimate in the future when we know more about the true extent.
Historical construction data shows it takes 4000 to 5000 jobs for 1 year to put-in-place $1 billion worth of construction. Therefore we would need 40,000 to 50,000 jobs 1 year to replace $10 billion in reconstruction. This is a combination of residential and nonresidential buildings and infrastructure.
You can see why I went with calculating labor to replace a dollar value. Home values in those areas can range from $1mil to $5mil+. Value per unit dwelling is variable. But I know it takes at least 4,000jobs/$1bil to put-in-place construction work.
The area damaged is certainly less than the total metropolitan areas used to develop our labor pool estimate of 400,000 jobs. We must recognize that the largest part of that pool remains occupied on planned workload in backlog in the remaining areas not affected by the fires. But, to fill the reconstruction need, let’s assume that 10% of the existing workforce of 400,000 plus expected annual growth of 20,000 is available to work on replacing buildings lost. So, we take 42,000 jobs away from normal construction over the surrounding metro area. That’s a big hit to the remaining metro areas. Seldom, if ever, that labor in your area falls 10%. That also means those surrounding areas, since they may see a reduction in jobs, may also see a reduction in work put-in-place.
Some of these jobs may be filled by workers traveling into the area from afar to take advantage of the expected workload. That would mean a lower demand on reconstruction jobs supported from the existing 400,000 workforce. But those workers came from somewhere, just not this metro area.
If I can’t get the labor (minimum 40,000 jobs) to replace $10 bil/year, it’s not the cost that changes, the timeline moves out. It’s not likely there would be more labor available, but there could be less.
So we have 42,000 jobs available to support a reconstruction effort. The growth rate of 2,000 jobs/yr. can be assumed to fill the gap over a few years in the range of 40k to 50k jobs per year needed. This sits well with the above estimate that it would require 40k to 50k jobs 1 year to replace $10 billion of damaged buildings.
As you can see, the labor pool may support $10 billion of reconstruction in one year. If the estimates of building damage turns out to be $100 billion, the labor pool available for reconstruction, based on this estimate, would require 10 years to accommodate that extent of workload.
This does not include demolition and removal of damage. Nor does it address logistics or demand and supply. Expect increased demand and potentially longer than normal waits for all residential building products; lumber, doors, windows, roofing, siding, drywall, flooring, HVAC, plumbing, electrical and appliances, primarily or exclusively in the affected areas. This estimate does not address inflation, which, even if normal, is a lot over 10 years. So, damage estimates today will take more than today’s value to reconstruct. Furthermore, it is not intended to address insurance issues which may have an impact on how much damaged property does or does not get rebuilt.
1-11-25
This link points to a recorded interview (36min) conducted by @EconstratPB (a mutual follower on X(twitter) and BlueSky) and hosted on his Substack, where we discuss in a little more detail how the above estimate was prepared and some of the issues that will pose difficulties to accomplish this rebuilding effort. www.pinebrookcap.com/p/after-the-…
1-24-25
This link points to a Wall Street Journal brief article referencing their discussion with me regarding this article. https://www.wsj.com/livecoverage/stock-market-today-dow-sp500-nasdaq-live-01-21-2025/card/how-many-workers-will-it-take-to-rebuild-burned-out-los-angeles–ubf4wXyri8Xcflb24AO8
6-12-25 This original article was written Jan. 11, 2025. In light of recent events in June in Los Angeles , I expect the conclusions reached in this reconstruction analysis will be extended further out in time as there will not be as many workers available to complete the work needed.
Can We Increase Residential Construction by 3 Million Units in 4 Years?
Here’s a look at the residential construction industry. Except for the first mention of Current $, All $ in this analysis are inflation adjusted Constant 2019$, so all years can be compared on equal terms. All numbers are rounded slightly.
Currently in 2024 $, residential construction spending is $940 billion/year, 43% of all construction. Only 60% of that ($560 billion) is spending on new housing units. The other 40% is Reno.
Currently for 2024, residential construction supports 3,350,000 jobs. Only 60% of the jobs (2,000,000) are for new units.
30 years ago residential construction spending was $550 billion/year and there were 2,200,000 jobs. On average over 30 years (including all up or down years) we’ve added $14 billion/year in spending and 38,000 jobs per year.
The 30 year (1995-2024) average growth in residential spending, counting only 21 up years, (eliminating all 9 down years) is +$36 billion/year. There were 2 years that we added +$70 billion/year in spending (one of those in 2021) and including those, there were only 7 years over +$50 billion/year.
The 30 year (1995-2024) average growth in residential jobs, counting only 21 up years, (eliminating down years) is +125,000 jobs/year. In 1999, we added 270,000 residential jobs. Since 2011, the most we’ve added in a year is 170,000 jobs in 2021. That’s for ALL residential construction.
In 30 years, we’ve never added more than $70 billion/year in residential construction spending nor more than 270,000 residential jobs in a year. Since 2011, the most residential spending increased was $70 billion in a year and the most residential jobs increased was 170,000 jobs in a year, both in 2021.
Only 60% of all residential spending and jobs is associated with building new housing units. The other 40% is renovations, not associated with new construction. That must be considered when reviewing all the historical data noted above. So the following is just to look at the data without renovation.
Reduce the data by 40% to eliminate spending and jobs associated with renovation and look at just the data associated with building new housing units: In 30 years, we’ve never added more than $40 billion/year (2004,2021) in residential construction spending on new units nor more than 160,000 residential jobs in a year (1999,2005). This is for New Units construction only.
Since 2011, the most spending increased for new units was $40 billion in a year (in Constant 2019$) and the most jobs increased was 100,000 residential jobs, both in 2021.
The last time residential jobs for new units increased by 100,000 or more in a year was 2005. Best growth ever was 2004-2005-2006, when we averaged +120,000 jobs/yr for 3 years, just for new units. In fact, the only times residential jobs for new units increased by more than 100,000 were 1999, 2004, 2005 and then finally again in 2021. But 2004-2006 was a time when the construction unemployment rate averaged 7.5%-8.5%. In 2021, construction unemployment averaged 6%. Now the unemployment rate is averaging 4.5%.
(It would be wise to use post-2011 data for the jobs analysis. The construction industry, especially residential and nonres bldgs, experienced a labor base reset in the period 2006-2010, a period from which we have never fully recovered. Notice in this plot that residential was nearly level at 4000 for 10 years, then from 2005-2009, it shot up to over 5000. It’s remained near 5000 since 2010.).
If we were to match the maximum growth rates since 2011 (and in the case of spending, since 1994) we would increase new residential units construction spending by $40bil/$390bil = 10% and we would increase new residential jobs by 100,000/2,000,000 = 5%. Spending maxed at 10%, but jobs max growth at 5%.
The number of new housing units built in a year varies, but for this post I’ll use 1,500,000. Currently it’s a bit less than that. Increasing new units by 5% to 10% per year on a base of 1.5 million units/year would net a growth between 75,000 to 150,000 added units per year. Let’s use 100,000 new units in the first year. That would be 6.7% growth, already more than the 5% jobs. We would continue the growth, so we increase that by another 100,000 in the 2nd year, and again in the 3rd and 4th years. Leave no doubt, growth of 100,000 units/yr would mean adding jobs to match or exceed the best single-year growth rate in the residential new units construction industry since 2005, and keep matching that growth rate for four consecutive years.
CORRECTION: 8-21-24 The Corrections (now fixed) above raise the upper limit of potential growth based on spending from 7% to 10%, or 150,000 units/yr, but only if we take the result to be dependant on the upper limit % spending growth. I had divided by current $ when I should divide by constant $. Spending can vary a lot more than jobs. While some years of jobs growth reach 6%-7%, average residential jobs growth is just over 4%. Jobs never grow at 10%/year.
This plot shows the steady growth in residential jobs, 75% over 15 years. Compounded that’s about 4%/yr. So, it seems much more likely the limiting factor here is jobs, not spending.

In this analysis, the number of units was chosen at 100,000/yr., an increase of 6.7%/yr., well below potential spending growth but already more than jobs growth. The jobs increase in 2021 was 5%/yr. In 2004-2005, jobs growth was 8%/yr. So, this 6.7% is near the high end of potential jobs growth. This implies an add of 130,000 jobs.
So we would increase new units by 100,000 + 200,000 + 300,000 + 400,000 or 1,000,000 total new affordable residential units over the next 4 years.
By this rough analysis, to increase new residential units by 3 million over current production over the next 4 years would require that we increase residential construction and jobs by 3x greater than the best performance achieved in the construction industry in the last 30 years, and keep it up for the next 4 consecutive years. That’s more jobs than the entire construction industry gains in one year and the new units subset of construction is only 25% of all construction.
Although there has been times past when jobs increased by 120,000/year, that was a time when unemployment was much higher and there were more workers available to readily go back into the workforce. It’s not impossible that jobs can grow faster, and therefore also the number of new units, but it is unlikely.
If a substantial portion of the current 1,500,000 unit production (500,000 units a year for the next 4 years) were shifted over to affordable units, the picture changes considerably. But I wouldn’t expect that current demand to just go away and shift to lower cost units. So, this leaves current demand as is and adds jobs.
A Proposal: If some amount of the funds to be invested in this program is directed towards trades training programs, within two years, and every year after, we could potentially be turning out some of the extra 260,000 additional workers we would need every year to achieve 3 million new housing units. This approach would create both good jobs and new affordable homes. Incentivize the training program somehow. Paid internship. Perhaps with a guarantee in return to work for 2-3yrs. If we don’t invest in training workers for this effort, we cannot build more than the labor we have. Here’s a thread on my training proposal. https://x.com/EdZarenski/status/1828778915055468816

Construction Inflation 2024
SEE Construction Inflation 2025 – 2-21-25
This post was last updated Jul 2024. All Index Tables and plots here are BASE 2019 = 100. The more recent Inflation 2025 post is revised to BASE 2024 = 100.
To properly adjust the cost of construction over time you must use an Actual Final Cost Inflation Index, otherwise called a selling price index. General construction cost indices and Input price indices that don’t track whole building final cost do not capture the full cost of escalation in construction projects.
Spending Must Be Adjusted by Inflation
Usually, construction budgets are prepared from known “current” costs. If a budget is being developed for a project whose midpoint of construction costs is two years in the future, you must carry in your budget an appropriate inflation factor to represent the expected cost of the building at that time. Why the midpoint? Because half the project cost occurs prior to that point and half occurs later than that. Actually, the midpoint of spending is 50-60% into the schedule, but the calculation to the midpoint of schedule is close. So, the average inflation for the project includes early contracts that have less inflation than average and also later contracts that would have more than the average inflation. Construction inflation should always be calculated from current cost to midpoint of construction, or in the case of using historical data and converting an older actual cost to a future budget, from midpoint to midpoint.
Any time a construction project is delayed or put on hold to start at some future date, construction cost inflation must be calculated and added to the previous budget to account for the unanticipated cost increase due to the delay. Of utmost importance is using appropriate cost indices and forecasting future cost growth to account for the difference in original budget and revised budget.
Besides the estimator’s need to accurately reflect future expected cost, inflation is an important aspect of the company business plan. Typically discussed in tandem with spending, inflation has an impact on tracking and forecasting company growth. All spending includes inflation, but inflation adds nothing except $ signs to the overall growth. For example, in a year when company revenues (spending) increase by 10%, if inflation is 6%, then total growth is only 4%. To accurately calculate growth, and the need for labor to support that growth, spending must be adjusted by the amount of inflation.
Types of Construction Inflation Indices
General construction cost indices and Input price indices that don’t track whole building final cost do not capture the full cost of inflation on construction projects.
Consumer Price Index (CPI), tracks changes in the prices paid by consumers for a representative basket of goods and services, including food, transportation, medical care, apparel, recreation, housing. The CPI index in not related at all to construction and should not be used to adjust construction pricing.
Producer Price Index (PPI) for Construction Inputs is an example of a commonly referenced construction cost index that does not represent whole building costs. The PPI tracks material cost inputs at the producer level, not prices or bids at the as-built level.
Engineering News Record Building Cost Index (ENRBCI) and RSMeans Cost Index are examples of commonly used indices that DO NOT represent whole building costs yet are widely referenced by construction firms and estimators everywhere to adjust project costs. Neither includes contractor margins.
It should be noted, there are far fewer available resources for residential inflation than for nonresidential inflation.
One of the best predictors of construction inflation is the level of activity in an area. When the activity level is low, contractors are all competing for a smaller amount of work and therefore they may reduce bids. When activity is high, there is a greater opportunity to bid on more work and bids can be higher. The level of activity has a direct impact on inflation.
To properly adjust the total cost of construction over time you must use actual final cost indices, otherwise known as selling price indices.
Selling Price is whole building actual final cost. Selling price indices track the final cost of construction, which includes, in addition to costs of labor and materials and sales/use taxes, general contractor and sub-contractor margins or overhead and profit.
Construction Analytics Building Cost Index, Turner Building Cost Index, Rider Levett Bucknall Cost Index and Mortenson Cost Index are all examples of whole building cost indices that measure final selling price (for nonresidential buildings only).
Residential inflation indices are primarily single-family homes but would also be relevant for low-rise two to three story building types. Hi-rise residential work is more closely related to nonresidential building cost indices.
Producer Price Index (PPI) Final Demand Indices are an example of construction cost indices that represent whole building costs. Final Demand PPI, or Selling Price, represents contractors bid price to client. Includes labor, material, equipment, overhead and profit. Labor includes change in wages and productivity.
PPI Final Demand Indices should not be referenced monthly. These are quarterly indices. Every three months (Jan, Apr, Jul, Oct) BLS performs an update survey to correct the PPI Final Demand indices. For the past six quarterly updates, about 80% to 90% of the change in the index for the quarter was posted in the update month. There is no way to determine how much occurred in the update month or a previous month, but the update # along with the two previous months will get too the correct end-of-qtr index.
January is an update month. PPI Final Demand for Jan index basically includes the correction for Nov and Dec. Therefore, the index should NOT be compared mo/mo. There is only one of three months that the index is known for certain to be accurate, the update month. Compare qtr/qtr, but make sure to use the defined months, the correct update month with two previous months. For ex., (Jan+Dec+Nov) / (Oct+Sep+Aug). Those are the defined quarters. (I don’t make the rules).
Refer to National Inflation Indices for comparison to several national selling price indices or various Input indices. National reference indices are useful for comparison. Few firms project index values out past the current year, therefore all future projections in these tables are by Construction Analytics.
Construction Inflation History
Post Great Recession, 2011-2020, average inflation rates:
Nonresidential buildings inflation 10-year average (2011-2020) is 3.7%. In 2020 it dropped to 2.5%, but for the six years 2014-2019 it averaged 4.4%. In 2021 it jumped to 8%, the highest since 2006-2007. In 2022 it hit 12%, the highest since 1980-81.
Residential 8-year average inflation for 2013-2020 is 5.0%. In 2020 it was 4.5%. In 2021 it jumped to 14% and then in 2022 reached 15.7%. the highest on record.
30-year average inflation rate (excluding 2021 and 2022) for residential and nonresidential buildings is 3.7%. Excluding deflation in recession years 2008-2010, then for nonresidential buildings it is 4.2% and for residential it’s 4.6%.
- Long-term construction cost inflation is normally about double consumer price index (CPI).
- In times of rapid construction spending growth, nonresidential construction annual inflation averages about 8%. Residential has gone as high as 10%.
- Nonresidential buildings inflation (prior to 2021-2022) averaged 3.7% since the recession bottom in 2011. Six-year 2014-2019 average is 4.4%.
- Residential buildings inflation (prior to 2021-2022) reached a post-recession high of 8.0% in 2013 but dropped to 3.5% in 2015. It has averaged 5.3% for 8 years 2013-2020.
- Although inflation is affected by labor and material costs, a large part of the change in inflation is due to change in contractors’ and suppliers’ margins.
- When construction volume increases rapidly, margins increase rapidly.
- Deflation is not likely. Only twice in 50 years have we experienced construction cost deflation, the recession years of 2009 and 2010. That was at a time when business volume went down 33% and jobs were down 30%.
Historically, when spending decreases or remains level for the year, inflation rarely (only 10% of the time) climbs above 3%. Avg inflation for all down/flat years is less than 1%. That did hold true in 2020 for both Nonres Bldgs and Non-bldg Infra. It also held true in 2023 for Residential. It did not hold true in 2021 or 2022. In 2021, spending was down for nonresidential buildings and flat for non-building. Inflation for both was over 8%.
Differences in Tracking Period
Be careful when referencing YTD growth. YTD can be the growth so far this year, that is, growth compared to December of the prior year, or it can be YTDcurrentyr/YTDlastyr. Neither represents the growth from the avg of the previous year, which becomes the historical value. Both are useful during the year to judge trends. The average growth for the year accounts for all the peaks and valleys within each year and and is the value carried forward into the index tables and charts.
Also, use caution when referencing Dec/Dec growth. An example of the difference between Dec/Dec tracking or year over year, and annual average tracking, is Steel Mill Products which was down 28.7% Dec22/Dec21, but the annual average for 2022 is still up 9.0% from the average 2021. In fact, the three years 20-21-22 show Dec/Dec combined inflation is +71%, but the annual averages for those same three years shows total inflation growth of 87%. Annual averages should be used to report inflation.
PPI Construction Materials Inputs Indices
Inputs Table updated 7-12-24 Biggest move in May and June data, Fabricated Str Steel down 7.5% year-to-date; Concrete up 3.9% YTD; Paving Mixtures up 5%.
A few construction Inputs are up 5%, Concrete Products and Copper. Steel Products are down ytd 5% to 7%. Otherwise the PPI for Construction Inputs is up year-to-date only 1% to 2%. Final Demand is down ytd <1%.

In the quarterly percent change table you can see the drop in Q3’22 and more in Q4’22, a sharp change in the rate of inflation. This shows up as expected in lower average of Inputs to Res and NonRes for 2023.

7-12-24 PPI Materials Inputs to Residential and Nonres Bldgs and Highway are UP only 1%-2% since December 2023. PPI Final Demand shows several qtrs down, but in 2024, Inputs is up slightly and Final Demand is down slightly. So, inflation inputs are not being passed on in Final Demand. Recent inflation relief could be decrease in margins.

A General construction cost index or Input price index doesn’t track whole building final cost and does not capture the full cost of inflation in construction. Final cost indices represent total actual cost to the owner and are often higher than General indices. Producer Price Index (PPI) INPUTS to construction reflect costs at various stages of material production, generally do not represent final cost of materials to the jobsite and do not include labor, productivity or margins. PPI Final Demand indices include all costs and do represent actual final cost to the Owner.
PPI Construction Final Demand Indices
PPI Final Demand indices should not be referenced monthly. These are quarterly indices. PPI Final Demand Indices are for Nonresidential Bldgs only. Every three months (Jan, Apr, Jul, Oct) BLS performs an update survey to correct the PPI Final Demand indices for the current month and the previous two months. For the past six quarterly updates, about 80% to 90% of the change in the index was posted in the update month. January data (released in Feb) is an update month. The PPI Final Demand for Jan. is basically the correction for Nov.+Dec.+Jan. The index should NOT be compared mo/mo. Compare qtr/qtr, but make sure to use the correct update month with two other months, (Nov+Dec+Jan)/(Aug+Sep+Oct).
Due to the nature of the PPI Final Demand Index, (2 monthly readings from model then every 3rd month correction by contractor survey), the correction month for the last 3 full periods flipped the sign of the 6 modeled months and turned every month for the last 9 months negative. There is no other proof needed to convince you to take care when using this index. Get it right.
7-12-24 The PPI Final Demand table below is updated to JUN, 2024 data.

July is the correction month for Q2, so we do not yet know results for Q2 Final Demand. Most bldg types are down from Nov-Dec’22-Jan’23 to Nov-Dec’23-Jan’24, so, if extended, the trend leading into 2024 is for slightly lower inflation. However Roofing and Plumbing trades are increasing.
The Construction PPI Final Demand for Nonres Bldgs posted declines for the last three, and in some cases four, quarters, Q1 thru Q4 2023. When the adjustment is distributed back into the months being corrected, Apr into Feb and Mar, Jul into May and Jun, and Oct into Aug and Sep, it shows all bldgs, except Offc, have at least nine months of a declining rate of inflation cost, and actually for the last 6 months negative inflation or deflation. Office has been negative for 2 quarters, warehouse has been declining for 12 months and negative for 9 months.
Due to the nature of the PPI Final Demand Index, (2 monthly readings from model then every 3rd month correction by contractor survey), the correction month for the last 3 periods has flipped the sign of the 6 modeled months and turned every month for the last 9 months negative.
In 2023, for each quarter, we see two months posted positive, then a large negative value for the correction month. The negative correction is large enough in all cases to turn the entire quarter negative. Here’s an example: for the period May-Jun-Jul, Jul is the correction month. PPI values were +0.09%, +0.02%, -1.23%. The average for each of the 3mo is -0.37%, (the sum of the 3 months divided equally. The May and Jun values that were originally posted based on modeling flipped from + to – after the contractor survey value is applied to the QTR. That highlights why PPI Final Demand indices should not be referenced monthly.
However, these declines are from such a high mark at the end of 2022 (we began 2023 up 11%), that the rate as we began 2024 is still up 6% to 7% from the average in 2022.
7-12-24 The PPI Final Demand table of qtr/qtr is updated to Jun, 2024 data

7-12-24 The PPI Final Demand plot is updated to JUN, 2024 data, but July data is needed to close Q2, so Q2 is not reported in this plot.

SEE ALSO Construction Inflation Tame in July PPI
SEE ALSO PPI Data Sept’24
Construction Analytics Building Cost Indices and Reference Indices
Current and predicted Inflation updated to Q4’23 1-13-24
- 2022 Rsdn Inflation 15.7%, Nonres Bldgs 12.1%, Nonbldg Infra 17.0%
- 2023 Rsdn Inflation 2.5%, Nonres Bldgs 5.4%, Nonbldg Infra 4.9%
- 2024 Rsdn Inflation 3.4%, Nonres Bldgs 4.5%, Nonbldg Infra 3.8%
The following Construction Inflation plot (for Nonresidential Buildings only) shows three elements: 1) a solid grey bar reflecting the max and min of the 10 indices I track in my weighted average inflation index, 2) a solid black line indicating the weighted average of those 10 indices, and 3) a dotted red line showing the Engineering News Record Building Cost Index (ENR BCI). Notice the ENR BCI is almost always the lowest, or one of the lowest, indices. ENR BCI, along with R S Means Index, unlike final cost indices, do not include margins or productivity changes and in the case of ENR BCI has very limited materials and labor inputs.

Most of the tables and plots here are cumulative indexes. Construction Inflation annual percents for the three major sectors, Residential, Nonresidential Bldgs and Non-building Infrastructure, are recorded in this short table, Escalation form Prev Year. Useful to compare to last year, but you would need to mathematically do the compounding to move over several years.

Final cost indices represent total actual cost to the owner and are generally higher than general indices. Producer Price Index (PPI) INPUTS to construction reflect costs at various stages of material production, generally do not represent final cost of materials to the jobsite and do not include labor, productivity or margins. Even with that, a PPI Inputs index +20% for a material could be only a +5% final cost. PPI Final Demand indices include all costs and do represent actual final cost. The solid black line (above) represents the Construction Analytics Building Cost Index for Nonresidential Bldgs and is a final cost index.
All of the Index Tables and the plot below, Construction Analytics Building Cost Index, show the cumulative inflation index, or the cumulative compounded effect of inflation for any two points in time.

How to use an index: Indexes are used to adjust costs over time for the effects of inflation. An index already compounds annual percent to prevent the error of adding annual percents. To move cost from some point in time to some other point in time, divide Index for year you want to move to by Index for year you want to move cost from, TO/FROM. Costs should be moved from/to midpoint of construction, the centroid of project cost. Indices posted here are at middle of year and can be interpolated between to get any other point in time.
The three yellow highlighted lines in the index tables are plotted here. The three major sectors, Residential, Nonresidential Buildings and Non-building Infrastructure,

This table and plot is an extension of the tables and plots above. Data is as of Q4 2023, but the table covers from 1967 to 2000. Data is pretty sparse.
Non-building Infrastructure Indices


In the Index tables above, dividing the current year by the previous year will give the current year’s inflation rate. All indices are the average rate for the year.
Also, in the tables above, all reference indices data is gathered from the original source, then all are normalized to a common base, 2019 = 100. This allows us to see how different indices compare.
Comparison of Indices
This plot compares four final cost indices and three inputs cost indices. Prior to 2020 there is a lot of symmetry in the final cost group. Everything changed after that.

Previous year Construction Inflation 2023 – last updated 12-15-23
Links to Data Sources Construction Inflation >>> Links
Links to Explanations of PPI Index PPI Explanation provided by AGC
Notre Dame Cathedral Repairs
I’ve read a few news articles that proclaimed charitable donations to Notre Dame may not be enough to cover the cost to rebuild the damaged cathedral roof. One article on Bloomberg news stated, “The cost might well run as high as 8 billion euros”.
I think it’s time some news sources engage with a professional architect, engineer and cost estimator before writing these articles. 8 billion Euros is enough to spend an astronomical amount to repair the damage!
One World Trade Center is the most expensive building built in the U.S. It cost $4 billion. It measures 3.5 million square feet (SqFt).
Some sources are saying the Notre Dame cathedral roof repair may cost more than $8 billion. The Notre Dame roof, as closely as I can determine from online data of the building, measures about 50,000 SqFt.
Just think about that.
I’m stretching my thought process to come up with a rough estimate that would cost as high as $250 million. Frankly, my rough estimate is quite a bit lower than that, and that would still be far more costly per SqFt than the most expensive building in the U.S.
I haven’t yet seen an architect / engineer estimate of the total area of the roof. I traded some emails with an architect who thought total area was 25,000 SqFt. I searched online and come up with potential area of roof at 50,000 SqFt. Here I’m using 50,000 SqFt.
I have not seen any other realistic cost estimates. But, the most expensive roof covering and roof structure I’ve ever estimated was less than $100/SqFt (in 2019 dollars).
My order of magnitude estimate (OME) (very general), for a unique, complex structure and premium roof covering could be $500/SqFt. Portions of this roof need to be quite ornate and also the estimate must include a ceiling structure. For a historical and rare roof plus inside work let’s double that estimate to $1000/SqFt. That’s 10x the cost of the most expensive roof I’ve ever estimated / built.
$1 billion would provide for $20,000/SqFt.
$8 billion would provide for $160,000/SqFt!
Even if my OME is 10x too low and I make a 10x adjustment, cost would then be $10,000/SqFt for a total cost = $500 million. That’s 100x more expensive than the most costly roof I’ve ever estimated. Frankly, I can’t come up with any conceivable scenario where it could cost that much.
footnote: 8 billion Euros is currently about $9 billion US dollars
Apr 2025 – News articles that I’ve seen state that the repair cost $700-$800 million.

Who Reads Construction Analytics?
Construction Analytics provides in-depth and unique analysis and future forecasting of construction data valuable to a wide variety of users. Construction Analytics data has been referenced by construction firms, university graduate studies, real estate firms, online educators, investment firms, school district planning boards, public agencies for developing infrastructure budgets and news agencies around the country.
Construction Analytics has consulted for and provided special reports and presentations to Construction firms, real estate developers, national construction organizations and industry conferences.
National agencies, universities, construction firms and conference planners have reached out to Construction Analytics for presentations to large and small groups. A sampling of some construction economic presentations: American Institute of Architects; Associated General Contractors; Project Management Institute; McGraw Hill Construction; Georgia Tech Civil Engineering; Worcester Polytechnic Institute Civil Engineering; Hanson-Wade Advancing Building Estimation Conference.
Construction Analytics has appeared in interviews by Bloomberg TV and ConstructechTV and has been widely quoted in Bloomberg News, Washington Post Business, WaPo Fact Checker, Financial Times, CNBC, Marketwatch Economy, Newsweek, Los Angeles Times, Ontario Construction News, strategy+business, Yahoo!Finance, STEEL Market Update, BuildingConnected, Constructiondive, BuildZoom and a host of other blogs and news sources.
Contact:
Construction Analytics
Ed Zarenski
edzarenski@gmail.com

Construction Overtime – A Common Miscalculation
4-7-18
Construction Overtime – A Common Miscalculation
You never get full production out of all overtime hours worked. A common miscalculation when applying overtime overlooks productivity losses.
Let’s say we have a project that has 100 manweeks of productive work (100mw x 40hrs = 4000 manhours) remaining on the schedule to completion, but that we absolutely must finish the job is less time. Also, let’s say we modify the work week from 5 days 8 hours = 40 hours/wk to Overtime (OT) 6 days 10 hours = 60 hours/wk. A simple calculation indicates that if we add 50% more hours per week (60hrs vs 40hrs), we could finish the job in 1/3 less time.
- Original plan = 4000 manhours / 40 hrs/week/man = 100 manweeks
- Revised plan = 4000 manhours / 60 hrs/week/man = 67 OT manweeks
- Time saved = (100–67)/100 =33/100= 33% time saved, 33 mwks saved
- Cost added would be +20%. See example of cost calculation below.
But, unfortunately, that would not be correct. That would have to assume no OT productivity losses. You won’t get 60 productive hours out of a man in a 6-10s 60-hour OT workweek. You will get only 50 productive hours.
Productivity loss graphic from Applied Cost Engineering, Clark and Lorenzoni, Marcel Dekker, Inc., 1985.
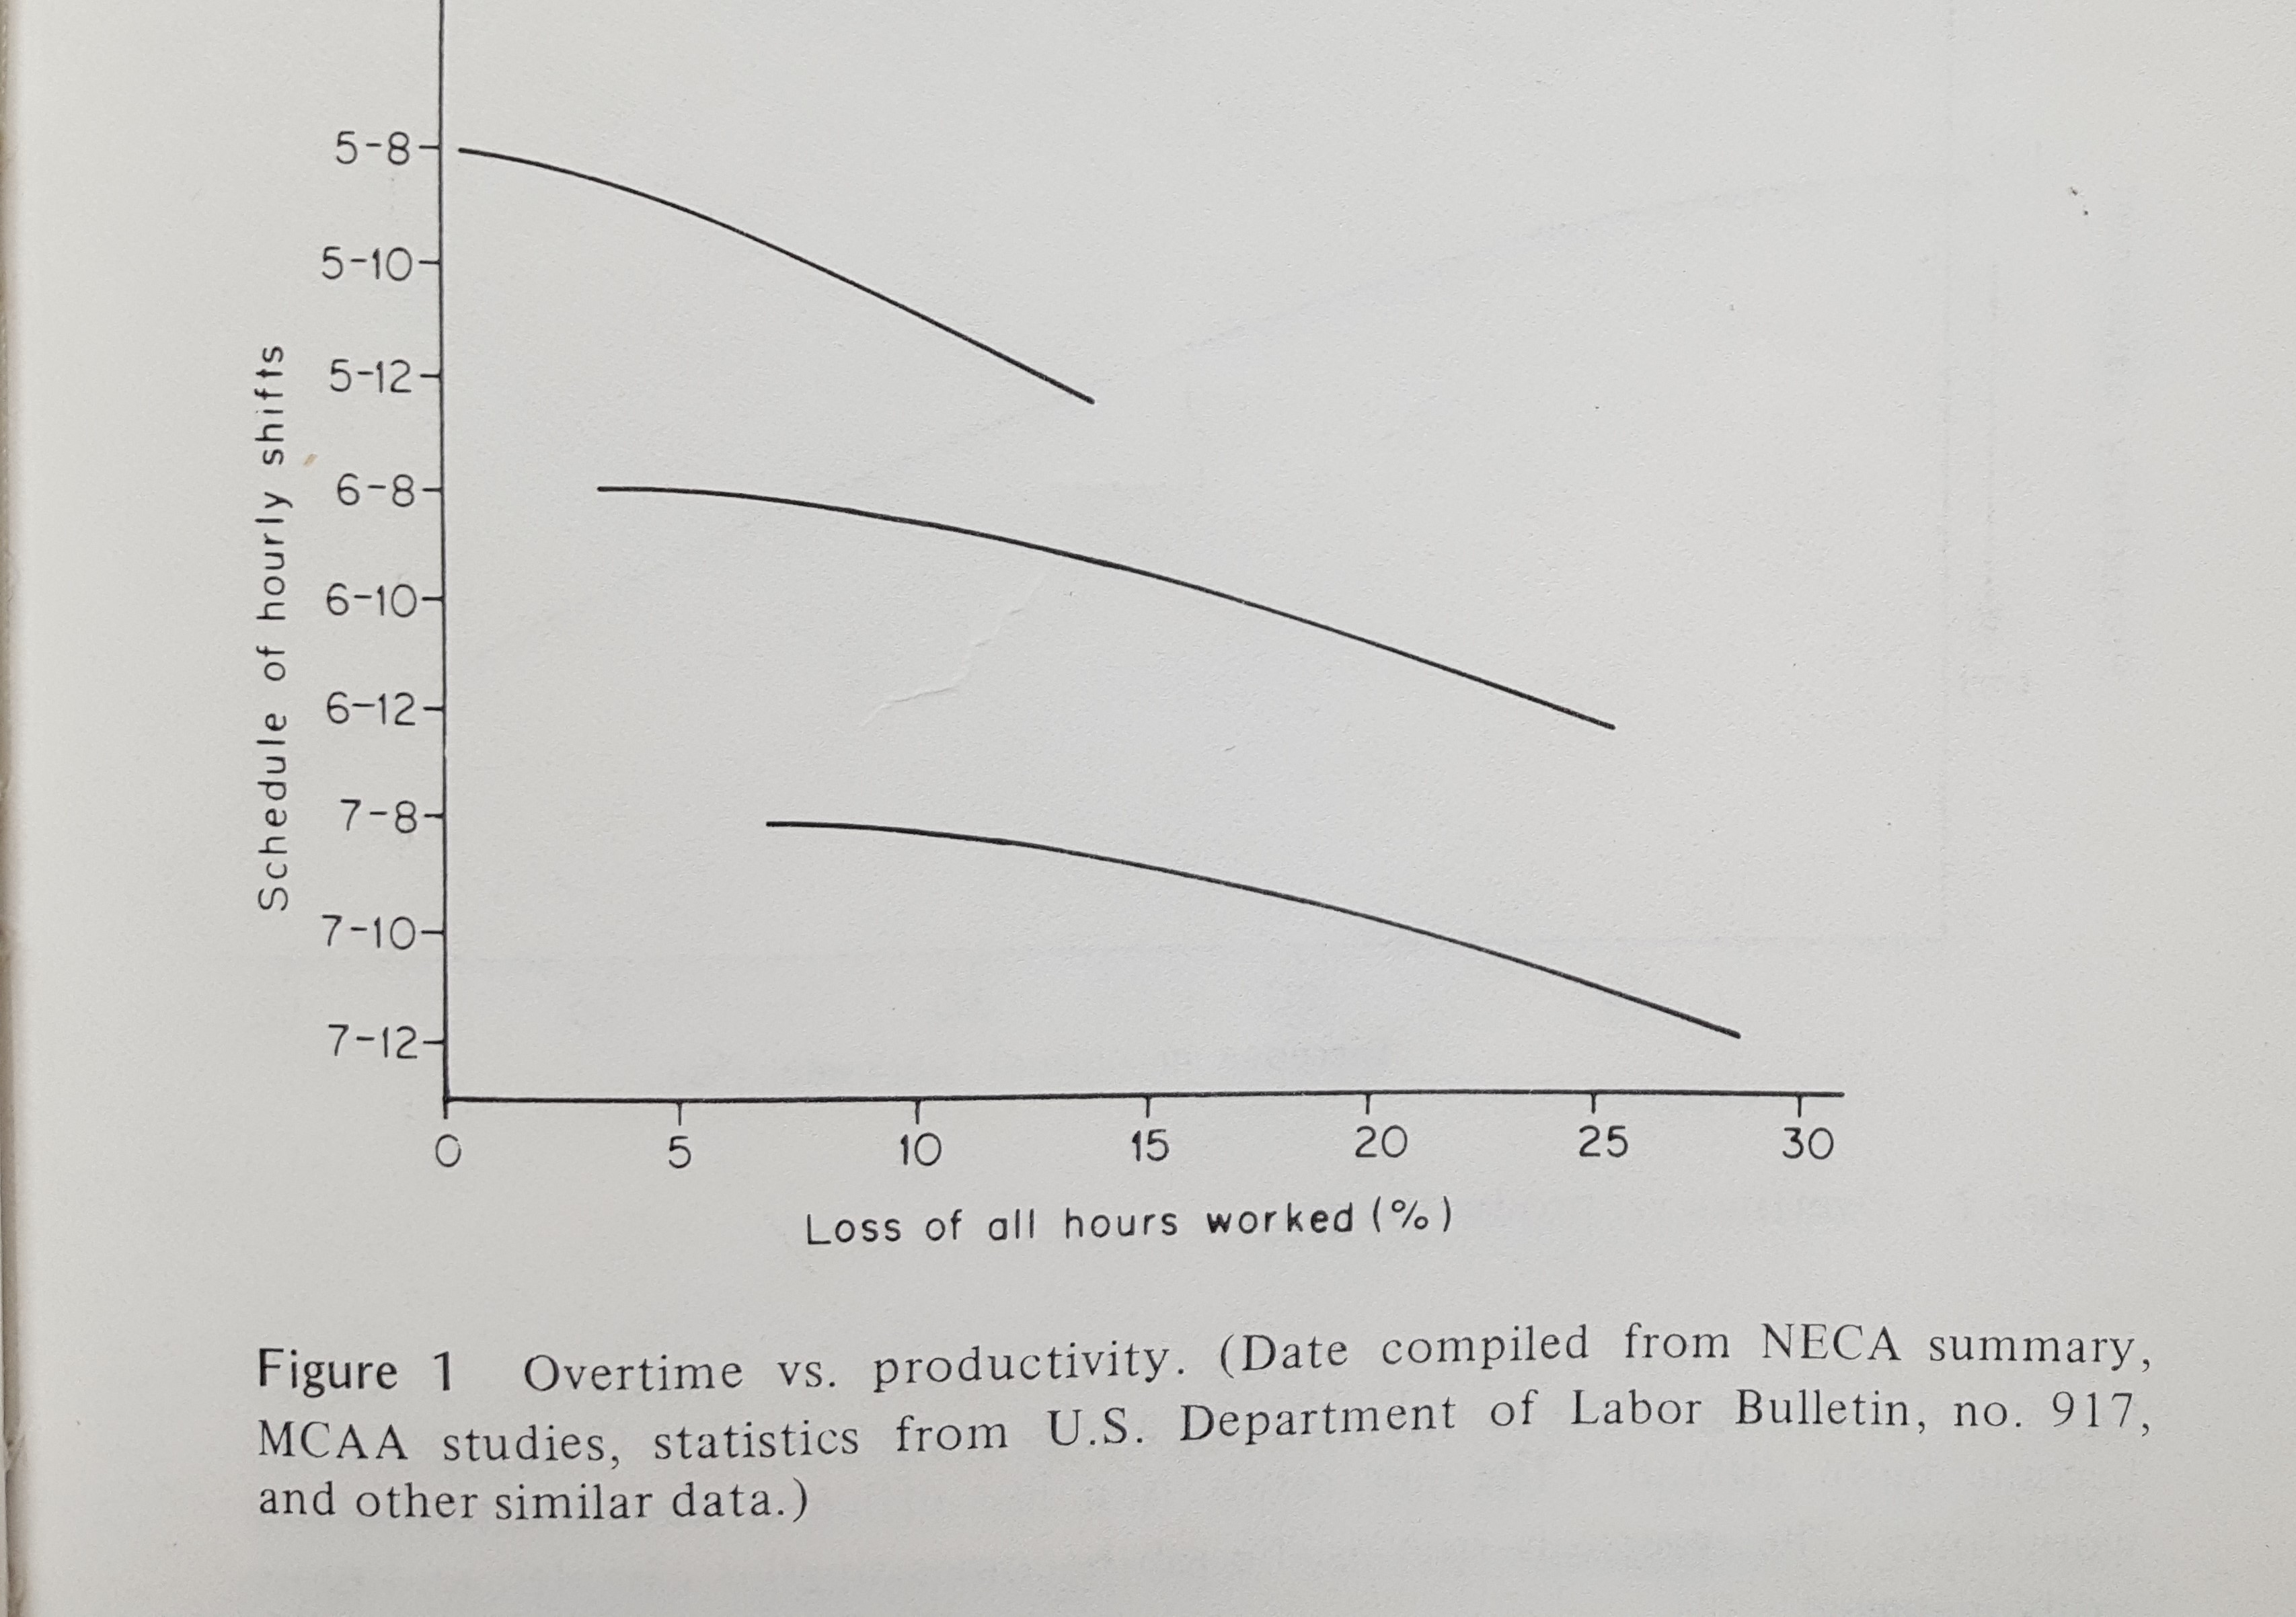
Yes, you still pay for all hours and the man is still on the job for 60 hours, but work progress slows as workers are kept on the job for longer periods. So how much time would be saved on the schedule?
Revised plan productivity 4000 manhours work / 50 productive hrs per week per man = 80 OT manweeks to completion.
Time saved = (100 – 80) / 100 = 20/100 = 20% time reduction or 20 mwks saved, not 33.
What did we get from this application of overtime compared to the original?
- 20 mnwks LESS of normal 40hrs =20×40= 800hrs less at normal 1x rate
- 80 mnwks at 20hrs/wk at OT, 1.5x rate =80×20= 1600hrs more at 1.5x rate
- Net cost 1600 x 1.5 – 800 x 1 = 1600 equivalent extra cost hrs over base 4000.
- Time saved (100-80)/100 = 20%
- Cost increased 1600/4000 = 40%
This simple example shows the full hourly time savings is not realized due to lost productivity plus many of the hours worked are at a higher cost. Though the initial basic OT estimate forecast 33% time saved at 20% extra cost, that scenario actually saved only 20% time and added 40% cost, double the initial budget.
If this was initially a 30 month project, with approximately 35% of the cost in labor, then overtime saved 6 months time, but added 15% inflation to the total cost.
There’s a significant difference in the original un-adjusted OT estimate of time/cost versus the OT time/cost analysis for nonproductive hours. That would be a serious mistake in estimating and could have serious cost implications against the budget.
This will vary with the OT scenario selected or any other data set used, but generally the more days and longer hours worked, the higher the extra cost ratio. Of course, a better way to accomplish a tightened schedule might be to add a second shift rather than work men longer hours. However, in times of restricted labor supply that might not be feasible.
See this blog post for OT productivity loss rates Overtime Isn’t Always What It Seems – Lost Productivity Construction
