Measuring Forecasting Methodology & Accuracy
7-1-21 Updated to 2020 actual spending revisions issued 7-1-21. Also updated initial 2021 forecasts to include May 2021 year-to-date actual spending.
1-30-21 How can we tell if the adjusted starts forecasting method produces reliable results?
This plot of predicted spending from the starts cash flow model compared to actual spending is a check on this analytical modeling method. It shows a comparison of the cash flows predicted from all construction starts vs actual spending. If the forecast plot is accurate, then actual spending should move in the same direction, at the same slope. While we sometimes see lag in the plots movement, over time, the cash flow model of new starts does a good job of predicting where spending is headed.
The Dec 2020 chart below incorporates changes to residential (only residential has been modified) from earlier 2020 forecasts: no delayed projects canceled; all delayed spending restarted by August; new construction starts beginning in August, for the final 5 months of 2020, fastest growth in 15 years. This shows the latest starts data as adding to the recovery forecast between May and December and moving the future forecast residential spending line up on the index.

Settings in the pandemic forecast model resulted in the residential divergence. First, projects delayed were predicted to take six to eight months to come fully back up to production. But residential project spending was fully back to prior levels by August, within 3 months from the May bottom. About 60% of the return to prior spending was supported by growth in residential renovations. The rapid growth in spending is represented by the steep recovery in the spending curve between May and August. Second, a small portion of jobs delayed were predicted to be canceled permanently. Based on the spending data, this likely did not occur at all, or the impact was very small. Finally, Dodge at that time was forecasting that residential new starts in 2020 would finish the year down slightly. With December starts data now in, residential starts for 2020 finished up 4%. In fact, over the final 5 months of 2020, new residential construction starts posted 4 of the 5 highest monthly totals since 2004-2006. Residential new starts finished 2020 at a 15-year high, with almost 50% of new activity for the year posting in the final 5 months, which will put a lot of that spending into 2021.
Here’s the most recent forecast with 2020 revisions updated 7-1-21

The nonresidential buildings plots (and the residential plot prior to 2020) are remarkably close, providing an indication the method of analysis employed, cash flow of all construction starts to get spending forecast, is reasonably accurate. Below is the nonresidential plot to a larger scale.

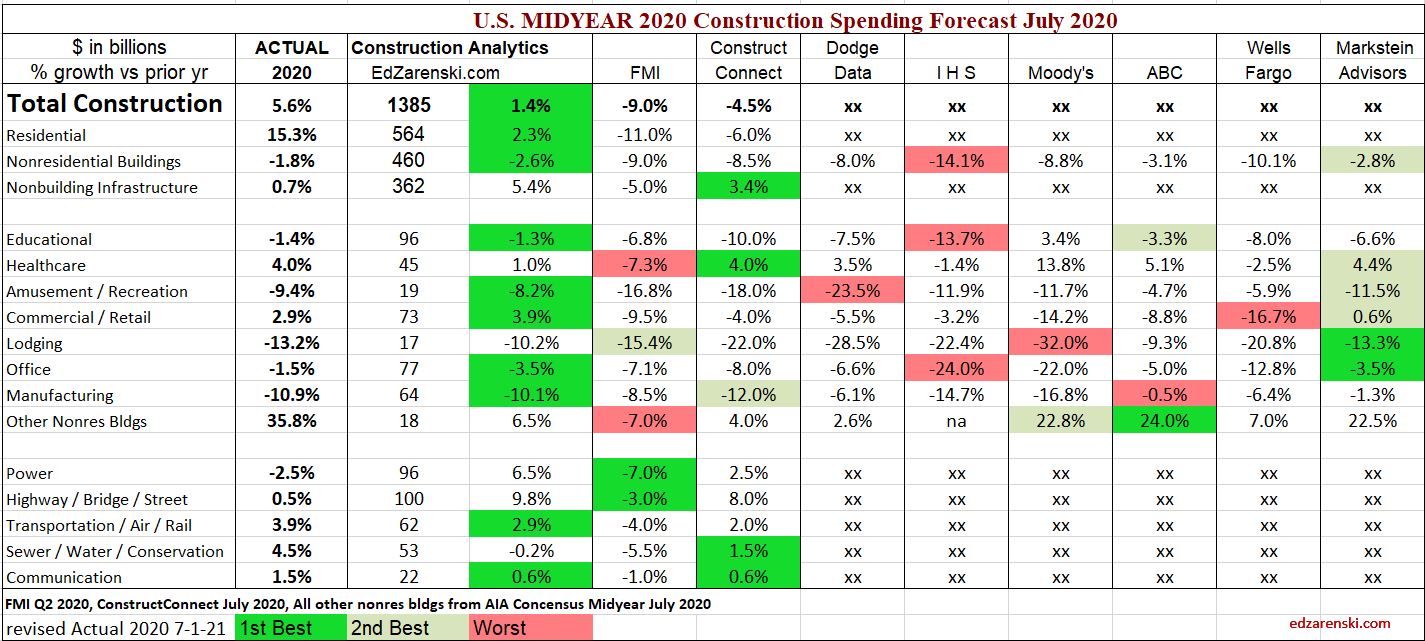
The table below shows the 2020 forecasts published at midyear by numerous analysts, the first opportunity to incorporate impacts from the pandemic recession. This table compares Construction Analytics Midyear July 2020 forecast to eight firms that reported nonresidential forecasts in the AIA Midyear July Outlook. Two of those firms, FMI and ConstructConnect, also published full forecast reports at midyear. The Actual totals for 2020 based on data through December (2020 data revised 7-1-21), are shown in the first column. Forecasts, all compared to Actual 2020, are marked best, 2nd best, worst. Where there’s limited comparison (Total, Residential and Non-building), only the closest is marked.
Construction Analytics midyear 2020 forecast garnered more best estimates than any other firm when comparing Midyear estimates to actual totals for the year. No one got residential correct, some reasons cited above, but Construction Analytics was the closest. I think it’s fair to say, Construction Analytics Midyear 2020 forecast was closest to 2020 Total Actual overall. Though, I do remember some other times with red in my column. Markstein Advisors had a close 2nd best nonres bldgs midyear 2020 forecast.
7-1-21 Actual YTD 2020 updated to include 2020 revisions for final comparison.
This next table shows the current forecast for full year 2021 forecast published as of January 2021. Of the eight nonresidential markets in the AIA Outlook report, the spread between hi and low forecast is 14%-17% for 4 markets, but 24%-25% for 3 markets and a spread of 45% for lodging. Spreads that wide are indicating some forecasts are all over the place. This will get compared next January when we know the Actual amounts for 2021. Watch closely nonresidential buildings.
Also, in July, along comes the Midyear Outlook, when usually forecasts improve a bit. That also will get compared next January.
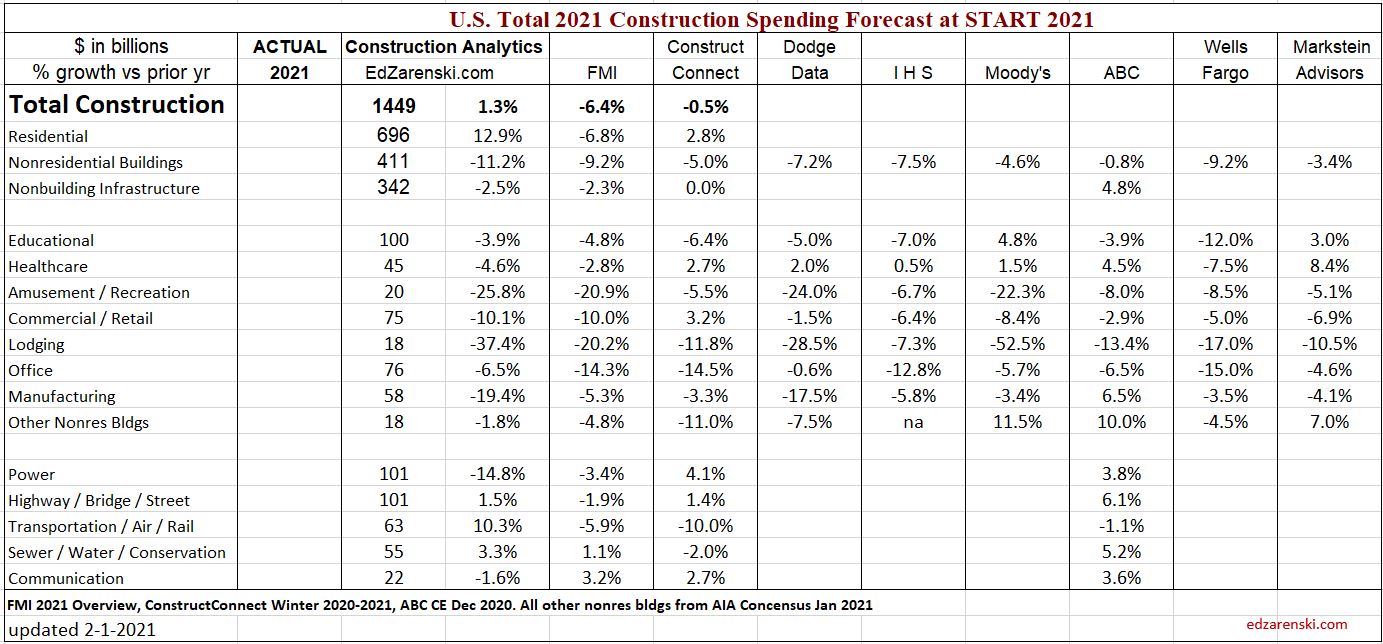
7-1-21 table below includes May ytd actual spending for latest comparison. Forecasts are all at start of 2021.


Construction Inflation 2021
This post, originally written in Jan 2021, and updated several times, is viewed over 1,000 times a week.
>>> 2-1-23 SEE Construction Inflation 2023
2-11-22 SEE Construction Inflation 2022
See Feb 2022 note below and updated table at bottom of file.
10-15-21 update – Link to PPI data from Jul to Sep. Table PPI Inputs Sep21. Updated BCI plot.
As of Sept 2021, PPI for materials inputs to construction is up ytd 15% to 18%. For the 18 months since March 2020, the onset of Pandemic, the PPI for materials inputs to construction is up ytd 23%, but the PPI Buildings Cost Index for final cost to owner is up only 5% to 6%. (Part of this can be attributed to periodic PPI forecast updates).
As of 10-15-21, nonres bldgs inflation for 2021 is estimated at 4.6% and residential at 12.9%. Those increases are reflected in the tables and plots below. Both have been trending up.
11-10-21 From Sept to Oct materials price changes were normal, but Final Demand prices jumped what could be considered an entire year’s worth of increase in just one month. We’ve been watching the price pass thru increase slowly, until now. This is the single largest monthly increase in Final Demand pricing since the indices were started in 2006.
As of 11-10-21, nonres bldgs inflation for 2021 is estimated at 6.8% and residential at 15%. The 2022 forecast is estimated at 4.5% for nonres bldgs inflation and 7% for residential.
As of Jan 2022, not all nonresidential sources have updated their Q4 inflation index. A few are still reporting only 4% inflation for 2021, but several have moved up dramatically, now reflecting between +10% to +14%. My estimate for 2021 inflation has been changing, moving up again. Nonres bldgs inflation for 2021 is currently estimated at 8.7% and residential at 15%. Graphs in this post are not yet updated. The 2015-2023 table of indices has been updated 1-20-22.
2-10-22 Here’s a list of 2021 indices average annual change and date updated.
- +8.4% Construction Analytics Nonres Bldgs Dec
- +14.1% PPI Average Final Demand 5 Nonres Bldgs Dec 2021
- +11.4% PPI average Final Demand 4 Nonres Trades Dec
- +1.9% Turner Index Nonres Bldgs annual avg 2021 Q4 2021
- +4.84% Rider Levett Bucknall Nonres Bldgs annual avg 2021 Q4
- +12.6% Mortenson Nonres Bldgs annual avg thru Q3 2021
- +11.7% U S Census New SF Home annual avg 2021 Dec
- +7.4% I H S Power Plants and Pipelines Index annual avg 2021 Dec
- +7.1% BurRec Roads and Bridges annual avg 2021 Q4
- +6.0% FHWA Fed Hiway annual avg 2021 Q4
- +9.11% R S Means Nonres Bldgs Inputs annual avg 2021 Q4 2021
- +10.0% ENR Nonres Bldgs Inputs annual avg 2021 Dec
- +7.2% Ready Mix Concrete Inputs Dec
- +16.4% Lumber/Plywood Inputs Dec
- +46% Fabricated Steel Inputs Dec
- +39% Sheet Metal Inputs Dec
- +21% Gypsum Products Inputs Dec
- +9.6% Flat Glass Inputs Dec
- +23% Copper Products Inputs Dec
- +55% Aluminum Products Inputs Dec
The 2022 forecast is estimated at 4.5% for nonres bldgs inflation and 7% for residential.
Construction Spending Update 10-1-21
Construction Jobs Outlook 10-11-21 read the section on impact of inflation
Inflation – PPI data June-Sept 2021 some materials up 20%-40% but final cost up only 5%-6%
8-15-21 update – These links at top here point to most recent inflation data, to supplement this post. The latest construction spending forecast reflects inflation of 4-6% for nonresidential and 12-13% for residential. The latest tables and BCI plot, as of 8-15-21, are at the very bottom in this file. All 2021 indices have increased since my May 2021 Inflation Report. These tables have the latest.
Also See Construction Inflation Report May 2021 for downloadable report
1-25-21 What impacts should we expect on Construction Inflation in 2021?
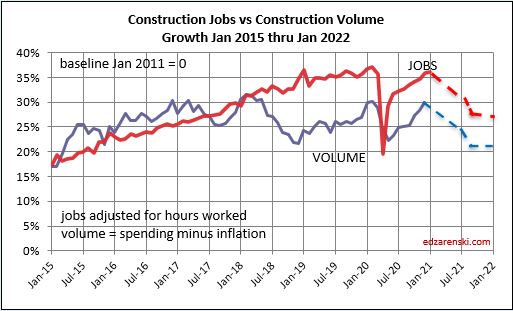
In April 2020, and again in June 2020, I recommended adding a minimum 1% to normal long-term construction inflation (nonres longterm inflation = 3.75%), to use 4% to 5% for 2020 nonresidential buildings construction inflation. Some analysts were suggesting we would experience deflation. Deflation is not likely. Only twice in 50 years have we experienced construction cost deflation, 2009 and 2010. That was at a time when business volume was down 33% and jobs were down 30%. In 2020, volume dropped 8% from Feb to May and we’ve gained half that back by Dec. Jobs dropped 14%, 1,000,000+ jobs, in two months! Now volume is still down 4% and jobs are down 2% from Feb peak. We’ve gained back 850,000 jobs. But also, we’ve gained back more jobs then volume. That adds to inflation.
Volume drops another 5% in 2021, all nonresidential, and then another 3% in 2022. Jobs could drop overall 8%-10% for all of 2021-2022, 500,000 to 700,000 jobs.
Even though material input costs are up for 2020, nonresidential inflation in 2020 remained low, probably influenced by a reduction in margins due to the decline in new construction starts (-24%), which is a decline in new work to bid on.
Volume = spending minus inflation.
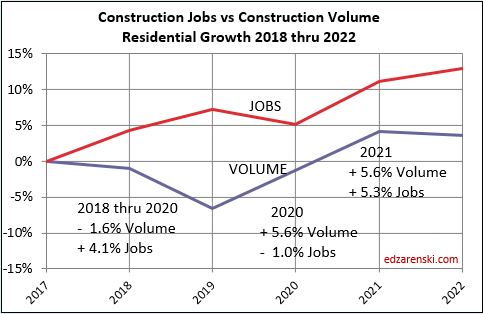
Residential business volume dropped 12% from the January 2020 peak to the May bottom, but has since recovered 22% and now stands at a post Great Recession high, 10% above one year ago. Although residential spending remains near this high level for the next year, volume after inflation begins to drop by midyear. For the year 2020, Residential Building Materials Inputs are up 6.2%. See PPI charts. Sharply higher lumber prices have added more than $17,000 to the price of an average new single-family home since mid-April ($24,000 as of 3-30-21). Residential inflation averaged 5.1% for 2020. (UPDATE 3-30-21 – Single Family home prices increased 11% since March 2020. Lumber cost is now 3x what it was in March 2020. These will both impact cost to build SFH).
10-15-21 – The U.S. Census Single-Family house Construction Index increased 6.7% from Feb 2020 to Feb 2021. Since February 2021 through August it is up another 8.5% for the last 6 months. https://www.census.gov/construction/nrs/pdf/price_uc.pdf
Nonresidential volume has been slowly declining and is now down 8.5% from one year ago. I had forecast by 3rd quarter 2021, nonresidential buildings volume would be down 15% lower than December 2020, or 25% below the Feb 2020 peak. It’s down 5.5% from Dec’20 and down 23% from the Feb’20 peak. This tracks right in line with the 24% decline in new construction starts in 2020. Most of the spending from those lost starts would have taken place in 2021, now showing up as a major decline in spending and work volume. Nonresidential inflation for 2020 dropped to 2.5%, the first time in 7 years below 4%. It’s expected to increase in 2021.
The Producer Price Index tables published by AGC for year-end 2020 https://www.agc.org/sites/default/files/PPI%20Tables%20202012.pdf shows input costs to nonresidential buildings up about 3.5% to 4.5% for 2020, but final costs of contractors and buildings up only 1% to 2%. This could be an indication that, although input costs are up, final costs are depressed due to lower margins, a result of fewer projects to bid on creating a tighter new work available environment which generally leads to a more competitive bidding environment. This could reverse in 2021 as the volume of work to bid on in most markets begins to increase.
As of Sept 2021, PPI for materials inputs to construction is up ytd 15% to 18%. For the 18 months since March 2020, the onset of Pandemic, the PPI for materials inputs to construction is up ytd 23%, but the PPI Buildings Cost Index for final cost to owner is up only 5% to 6%. Construction inflation is very different right now for subcontractors vs general contractor/CM.
11-10-21 From Sept to Oct materials price changes were normal, but Final Demand prices jumped in just one month what could be considered an entire year’s worth of increase. We’ve been watching the price pass thru increase slowly, until now. This is the single largest monthly increase in Final Demand pricing that I can remember. In part, the disparity between these two indices is a data collection issue in how Census gets this information. The Oct increase in the Final Demand index represents several months of growth, all reported at once. Final demand indices are just catching up.
This October 2021 increase is not yet reflected in any other building cost inflation index.

PPI data for Jun – Oct Updated 11-10-21
The Turner Construction 2020 Cost Index for nonresidential buildings averaged 1.8% higher than the avg for all of 2019. The Turner index appears to show the lowest gains in forecasts for 2021, up only 1.4% ytd though Q2. http://turnerconstruction.com/cost-index
The Rider Levitt Bucknall nonresidential buildings average index for 2020 increased 3.5%. Q3 2021 compared to Q3 2020 is up 5.5%. https://www.rlb.com/americas/
R.S.Means quarterly cost index of some materials for the 4th quarter 2020 compared to Q1: Ready-Mix Concrete -1.8%, Brick +10%, Steel Items -1% to -5%, Framing Lumber +32%, Plywood +8%, Roof Membrane +5%, Insulating Glass +12%, Drywall +3%, Metal Studs +23%, Plumbing Pipe and Fixtures +1%, Sheet Metal +20%. https://www.rsmeans.com/landing-pages/2020-rsmeans-cost-index

U.S. manufacturing output posts largest drop since 1946. Think of all the manufactured products that go into construction of a new building: Cement, steel, doors, frames, windows, roofing, siding, wallboard, lighting, heating systems, wire, plumbing fixtures, pipe, valves, cabinets, appliances, etc. We have yet to see if any of these will be in short supply leading to delays in completing new or restarted work.
There have been reports that scrap steel shortages may result in a steel cost increase. Scrap steel prices are up 27% in the last quarter and up 40% for the year 2020. Scrap is the #1 ingredient for new structural steel. The U.S. steel industry experienced the most severe downturn since 2008, as steelmakers cut back production to match a sharp collapse in demand and shed workers. Capacity Utilization dropped from 82% in January 2020 to 56% in April. In mid-August, CapU was up to 61%, still very low. As of January 23, 2021 CapU is up to 76%, well above April’s 56% but still below desired level. Steel manufacturing output is still down compared to pre-covid levels. Until production ramps back up to previous levels there may be shortages or longer lead times for delivery of steel products. In August 2021, CapU is back to 85%.
Steel Prices at mill in the U.S. are up 60% to 100% in the last 6 months. All prices are 50% to 75% higher than Feb 2020. http://steelbenchmarker.com/files/history.pdf . This is mill price of steel which is about 25% of the price of steel installed. What affect might a steel cost increase have on a building project? It will affect the cost of structural shapes, steel joists, reinforcing steel, metal deck, stairs and rails, metal panels, metal ceilings, wall studs, door frames, canopies, steel duct, steel pipe and conduit, pumps, cabinets and furniture, and I’m sure more. Assuming a typical structural steel building with some metal panel exterior, steel pan stairs, metal deck floors, steel doors and frames and steel studs in walls, then all steel material installed represents about 14% to 16% of total building cost. Structural Steel only, installed, is about 9% to 10% of total building cost, but applies to only 60% market share being steel buildings. The other 6% of total steel cost applies to all buildings. https://www.thefabricator.com/thefabricator/blog/metalsmaterials/steel-prices-reach-levels-not-seen-since-2008 At these prices, if fully passed down to the owner, this adds about 1.5%-2% to building cost inflation. With demand in decline for nonresidential buildings, I would expect to see all these steel price increases recede. Also, take note, as of January 2021, none of this steel price movement appears captured in the PPI data or RSMeans data.
Contractors have been saying they have difficulty acquiring the skilled labor they need. This has led to increased labor cost to secure needed skills. I expect the decline in nonresidential work volume in 2021 to result in as much as a decline of 250,000 nonresidential jobs in 2021. This results in labor available to fill other positions.
This SMACNA report quantifies that labor productivity has decreased 18% to meet COVID-19 protocols. https://www.constructiondive.com/news/study-finds-covid-19-protocols-led-to-a-7-loss-on-construction-projects/583143/ Labor is about 35% of project cost. Therefore, just this productivity loss would equate to -18% x 35% = 6.3% inflation. Even if, for all trades, the average lost time due to COVID-19 protocols is only half that, the added inflationary cost to projects is 3% above normal. But that may not remain constant over the entire duration of the project, so the net effect on project cost would be less.
Post Great Recession, 2011-2020, average nonresidential buildings inflation is 3.7%. In 2020 it dropped to 2.5%, but for the six years 2014-2019 it averaged 4.4%. Residential cost inflation for 2020 reached 5.1%. It has averaged over 5% for the last 8 years. The 30-year average inflation rate for nonresidential buildings is 3.75% and for residential it’s over 4%.
This survey of members by AGC https://www.agc.org/sites/default/files/2021_Outlook_National_1221_.pdf just published provides some insight into construction firms outlook for 2021.
Almost every construction market has a weaker spending outlook in 2021 than in 2020, because approximately 50% of spending in 2021 is generated from 2020 starts, and 2020 nonresidential starts are down 10% to 25%, several markets down 40%. Nonbuilding starts are down 15%, but will increase 10% in 2021.
Typically, when work volume decreases, the bidding environment gets more competitive. We can always expect some margin decline when there are fewer nonresidential projects to bid on, which typically results in sharper pencils. However, if materials shortages develop or productivity declines, that could cause inflation to increase. We can also expect cost increases due to material prices, labor cost, lost productivity, project time extensions or potential overtime to meet a fixed end-date.
Constant $ plot updated 10-14-21
Constant $ = Spending minus inflation = Volume

Many projects under construction had been halted for some period of time and many experienced at least short-term disruption. The delays may add either several weeks to perhaps a month or two to the overall schedule, in which case, not only does labor cost go up but also management cost goes up, or it could add overtime costs to meet a fixed end-date. Some of these project costs have yet to occur as most would be expected to add onto the end of the project.
Some projects that were put on hold (nonresidential buildings starts in 2020 dropped 24%) just prior to bidding in 2020 may now re-enter the bidding environment. The rate at which these projects come back on-line could impact the bidding environment. If several months worth of projects that delayed bidding last year all come onto the market at once, or at least all in a more compressed time span than they would have, the market could be flooded with work and bidding contractors now have more choice, can bid more projects than normal and could potentially raise margins in some bids. This would have an inflationary effect. Also, there can be difficulty in starting many projects at the same time, rather than more staggered starts. It burdens subcontractors and suppliers with too much of the same type of work all going on at the same time. This could exacerbate labor issues and could lead to project time extensions.
The hidden inflationary costs of bidding environment, project time extensions, potential overtime and lost productivity haven’t all yet appeared in the data. Some of these could still add to 2020 inflation. Also, the huge loss of new starts in 2020, which meant fewer projects to bid on in 2020, probably reduced margins in 2020. Nonresidential starts are projected to increase 4% in 2021, so that could lead to some recovery of margins, however, even with 4% growth in new starts, that comes after a 24% drop in 2020, so remains still 20% below 2019. Total volume of work is declining and new projects available out to bid is still depressed, so pressure on margins still exists.
update 4-15-21 Although materials cost inflation will be higher, I expect non-residential buildings inflation final cost in 2021 to range between 3.5% to 4.0%, with potential to be held lower. Subcontractor costs, such as for steel or lumber, could range much higher due to huge material cost increases. All the downward pressure on nonresidential inflation is on margins. There is currently 20% less nonres bldgs work to bid on than in Q1 2020.
updated 3-30-21 Expect 2021 residential inflation of 6% to 8% with potential to push slightly higher.
See Construction Inflation Index Tables for indices related to Nonbuilding Infrastructure work and for more links to sources.
(10-15-21 The tables and plot below include updated residential costs and updated nonresidential inputs).

The tables below, from 2011 to 2020 and from 2015 thru 2023, updates 2020 data and includes Q3 PPI data thru Sept and provides 2021-2023 forecast. The three sectors, highlighted, are plotted above.
NOTE, these tables are based on 2019=100.

The following table shows 2021 updated as of 10-15-21 reflecting 4.6% inflation for nonresidential buildings and 13% for residential.
As of 10-14-21, nonres bldgs inflation is estimated at 4.6% and residential at 12.9%. Those increases since August are reflected in these tables.
11-10-21 From Sept to Oct materials price changes were normal, but Final Demand prices jumped what could be considered an entire year’s worth of increase in just one month. We’ve been watching the price pass thru increase slowly, until now. This is the single largest monthly increase in Final Demand pricing that I can remember. Prior to this I expected future cost increases to add on slowly. This changes the entire outlook.
11-10-21 Construction Analytics and PPI Data have been updated for 2021, 2022 and 2023. Other firms forecasts will be updated when they post, so there may be differences. For example CA 2021 index for nonres bldgs now reflects a +6.5% annual increase. Turner Q3 2021 is still indicating just +3%.
11-10-21 Nonres bldgs inflation for 2021 is estimated at 6.8% and residential at 15%. The 2022 forecast is estimated at 4.5% for nonres bldgs inflation and 7% for residential. Increases to CA and PPI since Sept are reflected in this table.
As of Jan 2022, not all nonresidential sources have updated their Q4 inflation index. A few are still reporting only 4% inflation for 2021, but several have moved up dramatically, now reflecting between +10% to +14%. My estimate for 2021 inflation has been changing, moving up again. Nonres bldgs inflation for 2021 is currently estimated at 8.7% and residential at 15%. Graphs in this post are not yet updated. The 2022 forecast is estimated at 4.5% for nonres bldgs inflation and 7% for residential.
The 2015-2023 table of indices has been updated 2-10-22. However, there is still some potential for 2021 data to move higher.

How to use an index: Indexes are used to adjust costs over time for the affects of inflation. To move cost from some point in time to some other point in time, divide Index for year you want to move to by Index for year you want to move cost from. Example : What is cost inflation for a building with a midpoint in 2021, for a similar nonresidential building whose midpoint of construction was 2016? Divide Index for 2021 by index for 2016 = 108.2/87.0 = 1.24. Cost of building with midpoint in 2016 x 1.24 = cost of same building with midpoint in 2021. Costs should be moved from/to midpoint of construction. Indices posted here are at middle of year and can be interpolated between to get any other point in time.
All forward forecast values, whenever not available, are estimated by Construction Analytics.
Also See Construction Inflation Report May 2021
Also See Construction Inflation Index Tables the post for links to dozens of other indices

Construction Jobs in 2020 down 220,000
edited 3-5-21 to include 2020 revised jobs and 2021 revised outlook.
Construction closes 2020 down 157,000 jobs comparing Dec 2020 to Dec 2019. Average jobs lost over the year is down 220,000, down 2.9%. Also, average hours worked in 2020 is down. The equivalent jobs lost over the year (jobs x hours worked) is down 3.8% or a loss of 281,000 jobs equivalent.
While construction spending in 2021 is forecast up 1.3%, after inflation construction volume is expected to decline 2.5%. Residential construction spending is forecast up 13%, volume up almost 9%, but 2021 nonresidential buildings spending is forecast down -11% leading to a decline in volume after inflation of -14%. Nonbuilding Infrastructure spending in 2021 declines -2.5%, volume drops -6%.
Nonresidential buildings volume declines of 14% project to a loss of over 400,000 jobs next year and non-building infrastructure is projected to drop 60,000 jobs, but Residential could experience growth next year of 250,000 jobs. That could net annual average jobs losses to -200,000. Job losses continue into 2022 with net volume declines of 4%.
It is notable though, even with residential spending and volume increasing, due to large losses in nonresidential buildings, total construction volume declines every month for the next 9 months. Nonresidential buildings volume declines for the next 18 consecutive months.
There is an unusual occurrence in the data for 2021. Annual average jobs in 2021 may decline in total by only 100,000, but from Dec. 2020 to Dec. 2021, jobs decline may be nearer to 400,000. The annual average change is much less due to the massive decline in jobs in April 2020, which by itself caused the 2020 average to drop by almost 100,000. Most months in 2021 will show jobs about 3% to 4% or more below the same month in 2020, except for April, which will show 2021 jobs 10% higher than 2020.
Some who read this post will question how I forecast such a drop in nonresidential work, when some other analysts predict far less declines and even some who predict nonresidential work increases in 2021. It will be very difficult for anyone to support a forecast for increased spending in 2021 given a 22% drop in new construction starts in 2020 for nonresidential buildings work, most of which would have occurred in 2021.
https://www.bls.gov/web/empsit/ceseeb1a.htm