Home » Forecast (Page 16)
Category Archives: Forecast
Construction Spending 2015-2016 – How Do The Forecasts Compare?
Throughout the year a number of firms provide forecasts of construction spending. Spending projections give us an indication of the level of activity to expect. Here’s a summary of the most recent forecasts.
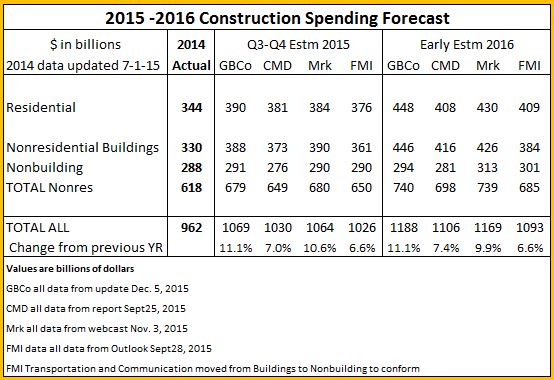
Actual spending put-in-place for October year-to-date (YTD) became available December 1st and new construction starts for October became available November 23rd. My GBCo 12-5-15 forecast includes both of those data updates. Not all these firms have yet incorporated the October data into their analysis and some will update in the near future. Most all of these values will be updated in January. Also, the AIA semi-annual Consensus report, forecasts of nonresidential buildings only, will come out in January. Again I’ll point out, my numbers have not changed much since July when I predicted $1067 for total, $388 for residential and $397 for nonres bldgs spending in 2015. Click on this link to an older post that shows the midyear predictions for three firms.
Once spending data through September is available it allows an analysis of a select data set that gives a prediction of the year end result within +/- 1%. I use this analysis to check my forecast. It indicates 2015 should finish with total spending between $1.067 trillion and $1.087 trillion and nonresidential buildings spending between $386 billion and $395 billion. The actual spending total has not fallen outside the statistical range since 2001, as far back as I’ve been tracking the data. I’m confident that total spending for the year will fall within this predicted range. My 2015 forecast of $1.067 trillion total and $397 billion for nonresidential buildings falls within those ranges.
Spending in any given month is the sum total contributed by all the projects that started and are currently underway. That includes spending from projects that started recently with foundations just coming out of the ground and also projects that started 18-36 months ago that are near completion. Spending patterns are affected mostly by the pattern of starts recorded over the period 12-36 months ago. New starts will generate the next 2 to 3 years of spending. Only if the starts pattern is even in growth will spending be even in growth. That will not be the case in 2016.
What we do know is that most starts that will generate spending next year are already in place. For the 2016 forecast, new starts booked through December 2015 will contribute 75% to nonresidential buildings spending, 55% to residential spending and 80% to spending on nonbuilding infrastructure. The pattern of spending will not be a constant upward slope.
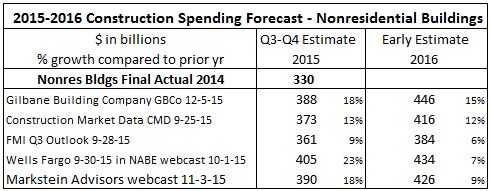
This table compares all 2015 values to the final of $330 billion in 2014. For 2016 each firm is compared to their own 2015 value. Once an actual value is determined for 2015 (which won’t be until March 1, 2016) I cannot be certain if some other firms forecast dollars change or percent floats. In the Gilbane forecast, 2016 percent would float. This will also affect the 2016 values in the first table in this blog post.
Construction Inflation
LINK to most recent articles on inflation 2019
11-17-2015
( Also See 1-31-2016 comments and chart on inflation )
Over the last 24 months work volume has increased and short-term construction inflation has increased to more than double consumer inflation. It appears construction inflation is already advancing faster than and well ahead of consumer inflation, which supports that consumer inflation is not an indication of movements or magnitude of construction inflation.
It is always important to carry the proper value for cost inflation. Whether adjusting the cost of a recently built project to predict what it might cost to build a similar project in the near future or answering a client question “What will it cost if I delay my project start by one year?”, whether you carry the proper value for inflation (which can differ every year) can make or break your estimate.
- Long term construction cost inflation is normally about double consumer price inflation (CPI).
- Since 1993 but taking out 2 years of recession (-8%), the 20-year average inflation is 4.2%.
- Average long term (30 years) construction cost inflation is 3.5% even with any/all recession years included.
- In times of rapid construction spending growth, construction inflation averages about 8%.
- Although inflation is affected by labor and material costs, a large part of the change in inflation is due to change in contractors/suppliers margins.
- When construction volume increases rapidly, margins increase rapidly.
- Construction inflation can be very different from one major sector to the other and can vary from one market to another. It can even vary considerably from one material to another.
In the 5 years of rapid growth in spending for nonresidential buildings from 2004 through 2008, nonresidential buildings cost inflation totaled 39%, or averaged ~8% per year.
In the 6 years of spending during the residential construction boom from 2000 through 2005, residential building cost inflation totaled 47%, or averaged ~8% per year.
Neither the producer price index (PPI) for construction inputs nor the CPI are good indicators of total construction cost inflation.
Some construction cost indices include only the cost changes for a market basket of labor and materials and do not include any change for margins. Those indices are not a complete analysis of construction cost inflation.
Construction cost inflation must include all changes related to labor wages, productivity, materials cost, materials availability, equipment and finally contractors margins. Margins are affected by the volume growth of new work and demand for new buildings. So be sure to verify what is included in any cost index you reference for real construction cost inflation.
For the last three years residential construction inflation has averaged 5.7% and nonresidential buildings inflation has averaged 4.2%. Nonresidential buildings cost inflation has increased for five consecutive years. Both are likely to increase next year since anticipated volume in both sectors will grow next year.
In my construction spending data set, which goes back to 1993, there were six years with greater than 9% spending growth. By far the largest spending growth years were 2004 and 2005, 11.2% and 11.5%. We are about to repeat that historic level of spending growth. I am predicting 2015 will finish with growth of 11.6% and 2016 will experience 11% growth.
(8-12-16) 2015 finished at 10.6% because 2014 was revised up. Construction spending for 2016 will probably finish closer to 8%.
I expect historic levels of growth in spending will be accompanied by inflation relative to historic high growth periods. Don’t expect long term average inflation in high growth periods. Don’t be caught short in your construction cost budgets!
Graphic updated 1-8-16
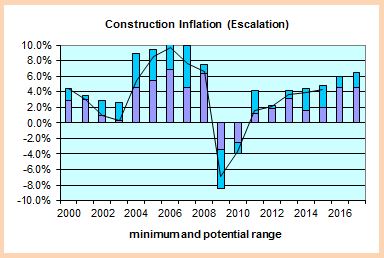
The chart shows the low and high range of various independent nonresidential buildings construction actual cost indices. In 2015, the range of estimates was from 2% to 5%. The actual inflation came in at 4%. The plotted line is my result of where inflation actually ended up. A chart for residential construction would show much different values.
( Also See 1-31-2016 comments and chart on inflation )
Nonresidential Buildings Construction Spending 2015 – How Do Industry Predictions Compare?
Throughout the year a number of firms provide predictions of various construction data. Some firms provide estimates for all segments of construction. More firms provide estimates only for spending on nonresidential buildings. This is a summary of various firms estimates published in the 2nd quarter and also for those who’ve updated their estimate recently.
The current available spending data through August allows an analysis of a select data set that gives a prediction of the year end result within +/- 1.5%. My current data predicts 2015 will finish with nonresidential spending at $393 billion, with a potential range between $387 billion and $400 billion. We will have even better data on November 2nd when the US Census publishes construction spending for the month of September. Once the September data is incorporated into the monthly totals, an analysis of a select data set provides a prediction of the year-end totals that has not varied more than +/- 1% from the end-of-year actual since 2002, as far back as the market data is available.


