Home » Posts tagged 'Forecast' (Page 2)
Tag Archives: Forecast
Construction Briefs Apr 2025
Tariff actions are not yet reflected in Feb PPI Inputs or PPI Final Demand index. Still early. Also remember, PPI does not include imports or tariffs on imports. When we do see movement in the PPI, it reflects domestic pricing decisions following on tariffs.
Lutnick: “Foreign goods may become a little more expensive, but domestic goods do not.” FALSE see next par.
PPI Excludes Imports/Tariffs. The 2018 steel tariffs of +25% applied on imported steel. However the 2018 PPI data shows that the cost of ALL DOMESTIC steel mill products (of all types) produced in the US increased 18% in 2018, after the steel tariffs were imposed.
If tariffs, for example, affect only 10% or 20% of products used in the industry, then the PPI shows us the domestic producers reaction to tariffs, which gets applied to the other 80% to 90% of product. For instance all steel is not imported, so not all steel will experience a tariff. The point here is that tariffs impact pricing decisions on all domestically produced products, not just the imported products. Consumers pay the price.
Impacts on Construction Inflation and Spending (guesstimates).
2021 inflation was 8%-14%. 2022 it was 12%-17%. Could 2025 repeat 2022? Yes. Will it? ??? I guess it hits 6%-10%.
I’m guessing some projects contributing to 2025 spending will be canceled/postponed. So maybe spending drops 5% from here, to zero growth. Construction spending annual growth is normally in the range 4% to 10%. 2025 and 2026 were both forecast at 5% to 7%. No doubt some projects will be canceled or mothballed. So the next 3 yrs spending gets reduced, and cost gets increased.
I’m beginning to think one of the first issues we have to deal with is supply shortages. All types of imported products are not going to be available, and there aren’t enough domestic products to replace them. This will add delays and cost to building projects.
Yeears ago, when I was a construction cost estimator, a major client would run numbers on a proposed new building project. If it couldn’t balance a ROI in 7 yrs, project would not move forward. As cost to build increases, it becomes harder to hit ROI. This supports that some projects may be canceled or postponed.
- Construction – What to Watch
- Cost to build going up
- Cost to finance is up
- Product availability in question
- Product delivery schedule delays
- Margins pressured
- Small/Midsize firms squeezed
- Labor let go/disappearing
- Projects in planning, delayed
- Project ROI not met
- Projects planned, canceled
Virginia has the largest concentration of Data Centers in the U.S. Virginia is projecting energy shortages due to the extreme demand DCs put on power grids. If you don’t build out the energy grid, the data centers put too great a demand on the current grid. “There are six states in the United States where data centres already consume over 10% of the electricity supply, with Virginia leading at 25%.” https://www.iea.org/reports/energy-and-ai/understanding-the-energy-ai-nexus
In the Q1 pre-tariff outlook, Data Center spending (SAAR), began the year 16% above the avg of 2024, is steadily climbing at 1.5% to 2%/mo., and sometimes more, is now up 22% vs avg 2024. By midyear the rate of spending will be up 28%. Data Center spending increased 45% in 2023 and 56% in 2024. Forecast for 2025 +37%. Obviously, this could get reduced if/when some projects get canceled.
The New Albany (Ohio) project, projected worth $1bil, is one of the two announced DC projects that have been halted https://www.nbc4i.com/news/local-news/licking-county/microsoft-pulls-out-of-licking-county-projects/
What if: A 10%/yr reduction in forecast new Data Center starts in 2025 and 2026 would result in reduced Data Center construction spending by -3% in 2025, -7% in 2026, -7% in 2027 and -3% in 2028.
What if: A 10%/yr reduction in forecast new Data Center starts in 2025 and 2026, combined with a 10% cancelation of 2024 starts, would result in reduced Data Center construction spending by -8% in 2025, -10% in 2026, -8% in 2027 and -3% in 2028. A 10% drop in Data Center spending is $4bil/yr.
It is not clear if the two halted projects mentioned in the article above were already committed construction starts or future proposed starts.
The Fed Chair just said what every credible economist, every economics textbook, and every empirical study shows: Tariffs reduce output and raise prices. – Justin Wolfers, Econ professor at Michigan, Senior fellow, Brookings and PIIE.
Let’s not forget what initiated growth in new manufacturing facilities. New manufacturing building contract starts over the last 3yrs is just over $600bil. Normal starts without government investment would be about $300bil over 3yrs. About $100bil of spending growth over the 3 years is inflation, leaving the remainder of about $200bil in spending growth attributed to government investment. All that began, and most of it got spent, under the previous administration. https://www.forbes.com/sites/courtneyfingar/2024/12/12/manufacturing-jobs-boom-arrives-too-late-for-biden-to-benefit/
Whenever we get an unusually large increase in new construction starts and spending, the tapering off of those projects leads to a decline on the tail end. Mnfg new starts peaked in 2022-2023. We are entering the period of the manufacturing construction spending taper. Mnfg spending has fallen slightly in 4 of the last 5 months. The forecast for 2025 is down -10%.
Microsoft has announced a pullback in spending on new Data Centers. Reduced demand negates need for new facilities, kills expansion plans, lowers new construction forecast, decreases jobs growth in construction. Mothball if partially built factory, not only expensive for owner, but also negative impact to contractor’s forecast revenues.
Whenever there’s a devastating natural disaster, causing destruction to homes, property and infrastructure, the supply of contractors, laborers and materials stays the same while demand skyrockets from victims trying to rebuild. Contractors generally pick more profitable projects over less lucrative ones.
In the Construction Analytics Outlook Feb 2025 report I said, “Don’t be surprised if 2025 construction jobs growth slows a bit. Jobs are slightly ahead of volume growth, particularly in the Non-building Infrastructure sector.”
Construction gained 19k (+0.2%) jobs in Feb, BUT total hours worked declined 0.3%. Total jobs have increased but Hrs worked has gone down the last 5 months. We’ve posted minor jobs gains in both Jan and Feb, and yet unemployment has gone up from 5.2% in Dec to 7.2% in Feb.
The March jobs report shows only minor gains in the # of jobs. We’ve added only 24,000 new jobs in the 1st quarter, the slowest 1st qtr jobs growth in 13 years (except for 2020, Covid). But hours worked in March increased by 1.5%. That acts on the entire 8.3 million workforce and is equivalent to adding 128,000 more jobs.
The jobs numbers reported April 4th cover the period from Feb15-Mar15. There are not yet any impacts from tariffs reflected in the jobs numbers.
We may see the term “force majeure” come up a lot in the near future. And if construction contracts don’t have a force majeure clause, there may be a lot of contractors in trouble.
My guess is if the people of Greenland take a vote to Join the United States, it would be 99-1 No. Of course, they would say “No, thank you.” As they so eloquently put it, “We’re not assholes.”
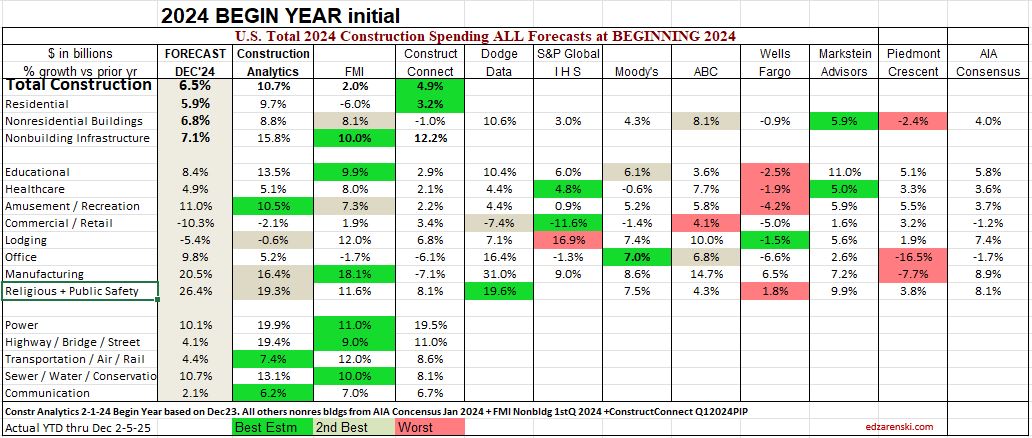
Compare 10 Construction Spending Forecasts for Nonres Bldgs Feb 2025
Construction Analytics updates the Construction Spending Forecast every month, usually publishing at least a Brief, every other month. The AIA Consensus solicits forecasts from 9 firms that prepare construction spending forecasts and publishes a Consensus Forecast every January and every June-July. The AIA Consensus reports only on nonresidential buildings.
This table captures the percents growth issued by the 9 firms reporting in the AIA Consensus and the Consensus average. Included is Construction Analytics full forecast. Also included, FMI and Construct Connect also provide full forecasts. Capturing this history provides a ready template to compare “How’d we do?” at the end of the year. It’s not often that we get to look back at forecasts to see how they performed when compared to the actual results. But I’m sure you’ve been asked, “Did you ever go back and look to see how you’ve done?”
You can see in this most recent 2025 table that some of the forecasts vary widely. For instance, in the most recent forecast for 2025: Data Centers forecasts range from +17% to +42%; Manufacturing from -11% to +18%; Educational -2% to +10%; Healthcare -1% to +21%; Warehouse -9% to +12%; Lodging -7% to +22%. Very few (if any) forecasts are in agreement. That’s why it’s valuable to capture the data and compare it to actuals once all the data is in at the end of the year. The first total for every year is issued in Feb., but the final annual actual value is subject to Census revisions until July of the following year,
These are the current Jan forecasts for 2025 nonresidential Buildings spending

Here are some past results, looking back in chronological order. Each table summarizes the percent growth forecast issued by each forecaster. Then, the forecasts are compared to the actual value. Individual market forecasts are marked as best, 2nd best and worst forecast. Color makes it easy to see the performance at a glance. This is a simple table collecting all the forecasting data for one period into one table for ease of comparison. Nothing is changed after the forecasts are issued, except for the actual data at year-end to which it is compared, which gets revised three times through July of the following year after the annual results are posted. You will see that I’ve done better in some forecasts than others. I scored a lot of the 2nd best estimates. Other old posts on this blog show the year I absolutely bombed, 2021, I think. My column was a sea of red. You might think that the updated Midyear forecast is always an improvement from the Beginning of year forecast, but that is not always the case, as you will see. The numbers don’t lie. We post our forecasts and wish for the best. Sometimes we get the best.

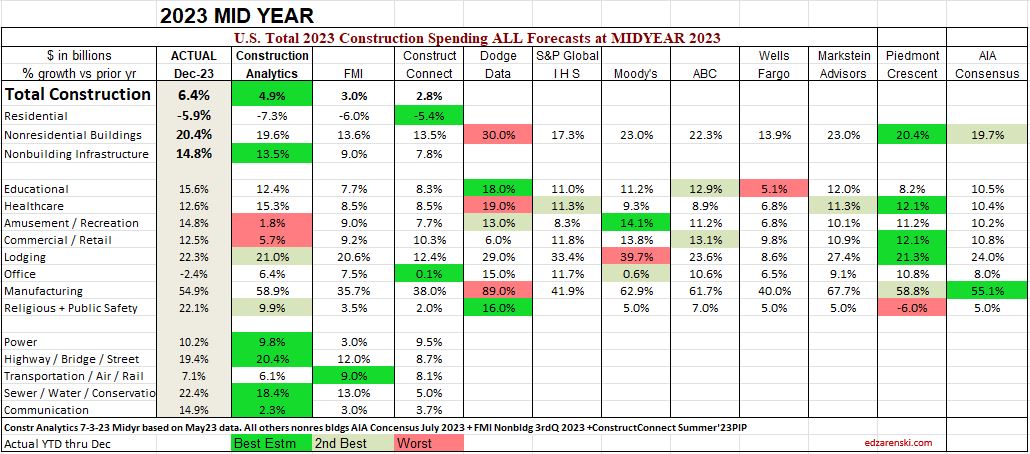

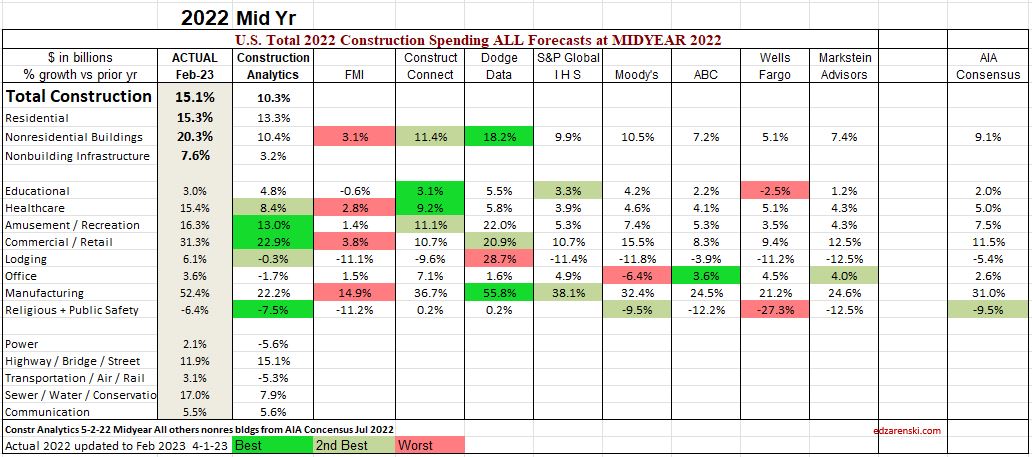

The inquisitiveness in me wants to know how this shakes out, so I put a score to the results. Here’s three years of completed data with two forecasts each year, but I took out (low scoring 8pts) Piedmont, as they were not involved to provide a forecast for 2022. So, How’d we do? These six tables, two each from 2022, 2023 and 2024, are scored here. There are 8 Nonres Bldgs markets plus the Nonres Bldgs total included in the count, so there are 9 line items. I gave 3 pts for best, 2pt for 2nd and -1 for worst.
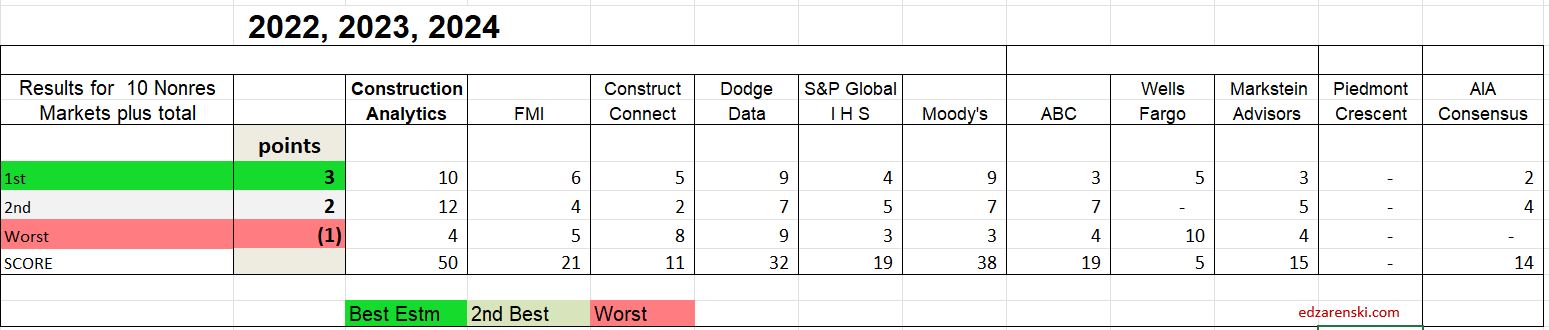
See any favorites of yours in the list of forecasters? Well, this is a small subset of their forecasting performance over recent years. What’s their score?
I summed the same sets of data back to 2020 to find if this trend, that Construction Analytics is scoring highest, is consistent. Again, I took out (low scoring 8pts) Piedmont, as they did not provide a forecast in 20, 21 or 22. The trend is similar. ABC picked up the most points (29), Markstein Advisors picked up 26, but Construction Analytics still picked up 22 points and retained the top spot.
The maximum any company can score in one forecast is 27 by scoring best on all 8 line items plus the total. The highest single forecast score in five years by any company is 17, that was by Construction analytics in the 2023 Beginning of Year forecast. Out of 11 firms across 9 forecasts in 5 years (no 2020 Beginning forecast and only 4 for Piedmont), or 94 forecasts, only 7 times has any firm scored higher than 10 out of a max 27. That might even make you think forecasting is difficult.
Sometimes, no forecast gets even close to the actual number. As an example, in the 2022 Beginning of year forecast, the average difference from forecasts to actual growth for Manufacturing was off by 40%+. The closest forecast was only within 23%. Why is that? Well, I base my forecast of construction starts. I’m sure others do too. New starts reported for a 3yr period 2020 thru 2022 averaged $50bil/year. But construction spending for the same period grew from $75bil/yr. to $125bil in 2022 and then shot up to $190bil in 2023. The starts report did not give a clear indication of what was leading into spending.

Some of the things I watch for when preparing my forecast are; What is the current rate of spending (Dec’24), compared to the year (2024) average, as we begin the new year (2025)? and What is the recent rate of growth? Does my forecast fit within the current trend? For example, as we begin 2025, the current rate of spending in Q4 2024 on Data Centers is already up 16% from the average of 2024, and it is climbing at a rate from 1%/mo to a few percent per month. That means that unless we experience some unexpected event that would cause spending to decline, we will easily increase from 16% growth to far greater by the end of 2025, or for that matter even by the end of Q1. So, the low is already established at 16% as we begin the year. All growth is an increase from there. New starts have averaged growth of 50%/yr for the last three years, so growth is established. There are a few low forecasts of 17%, 18% and 19% spending growth for the year. That would mean remaining spending growth for all of 2025 would be 1% to 3%, but that’s not realistic with new starts at 50% growth. Forecasts in the range of 20% +/- will be surpassed in the first few months of 2025. The AIA consensus 2025 forecast for Data Centers is +21.9%. I suspect that will be surpassed before Q1 is over.
There are some older posts on this blog that capture this info from earlier years. Not sure at this point what the title of the post would be to search for them. If you are so inclined, try searching for AIA or for the word Compare or Consensus. SEE Link Below. I had awful results one year.
So, I may not have prepared the best total forecast every year from 2020 thru 2024, but overall, I posted the most overall 1st or 2nd best line by line forecasts. In fact, for the Nonres Bldgs Totals (the sum of the 8 markets), out of the 9 forecasts from 2020 thru 2024, I had only 2 of the best Totals forecasts. Markstein Advisors is the only other firm that had 2 of the best totals forecasts.
I will close by saying, the data for the past 3 years or even 5 years shows that I’m providing you with the longest trend best forecast of Nonresidential Bldgs cost growth, and I’m happy to do so.

Construction Analytics Outlook Feb 2025
2-22-25 — A PDF of this entire Outlook article has been attached at the bottom of this post. 32pages, watchout. The Outlook has quite a bit more than in the post here.
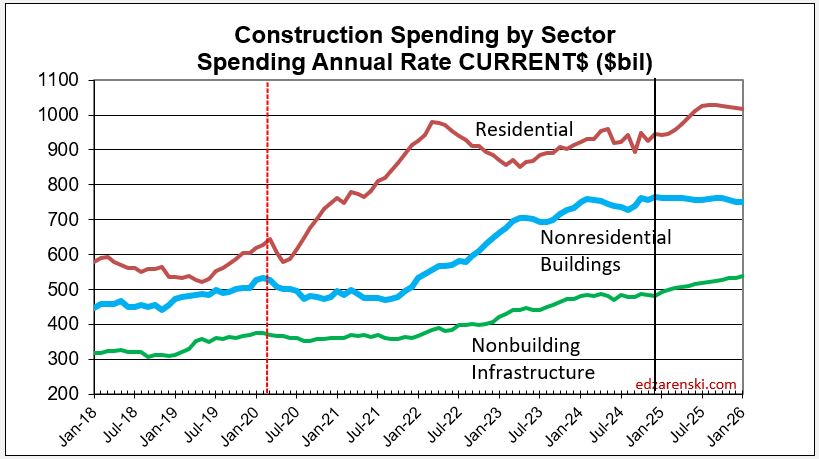
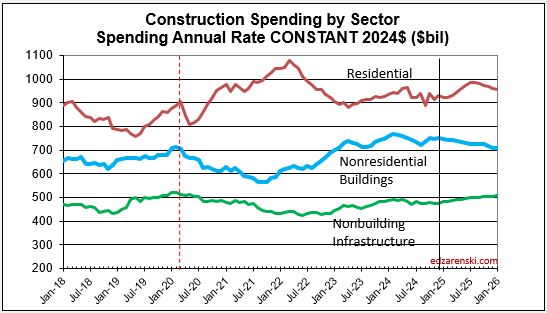
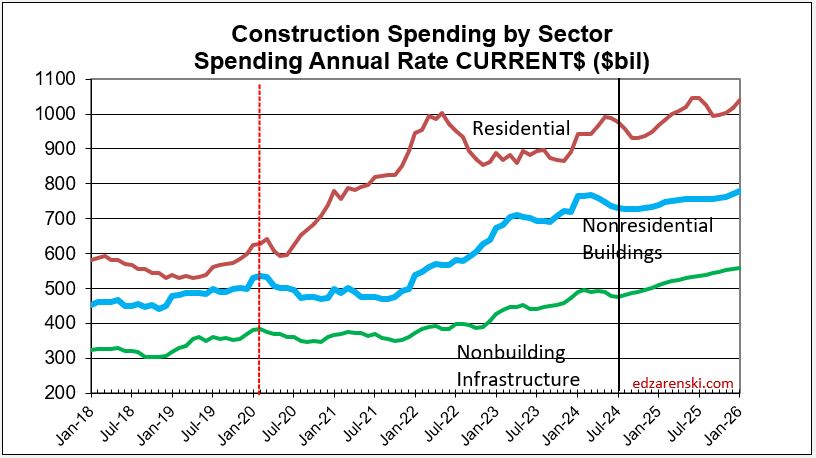
Construction Spending
for 2024 vs 2023, as of Dec 2024 data, is up 6.5%. All sectors gained between 6% and 7% over 2023. Growth is forecast at 5.5% in 2025. While Residential and Non-building Infrastructure will both gain 7%, Nonresidential Buildings will only see growth of 2% in 2025.
In February of 2025, with the Dec 2024 data in hand, my forecast for 2025 spending is $2,272 billion, 5.5% higher than my current 2024 forecast of $2,154 billion. There is strength in most markets, but Manufacturing is starting a downward slope in spending after three years of blockbuster performance.
This is the first report of a full 12 months of data from 2024. This number gets revised in Mar and Apr and again in July, when any/all months for the last two years get revised.

Last year at this time, leading into 2024, many of the Nonres Bldgs and Non-bldg line items showed Nov-Dec spending was already several points higher than the 2023 average. This year, many markets show very small gains or a decline in the rate of spending from the 1st half of the 2024 into the 2nd half. Some notable declines are Warehouse (-2.7%), Office w/o Data Centers (-3.6%) and Highway/Bridge (-2.9%). All begin 2025 down from the average in 2024.
However, Data Center spending is already up 16% in Oct-Nov-Dec vs the average of 2024, so begins 2025 on a high note, up 16% from 2024. Data Center spending increased 45% in 2023 and 56% in 2024. With spending increasing at an average 3%+ per month in 2024, and starting out at that pace in 2025, it’s easy to predict Data Center spending may reach 40% growth for 2025.
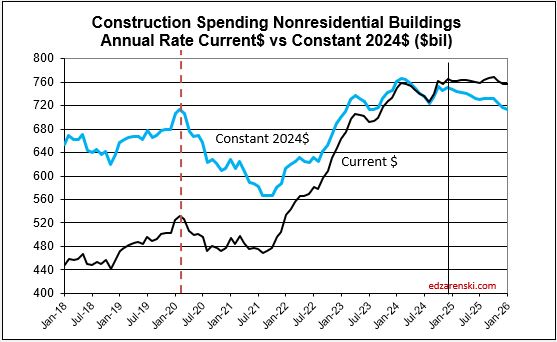
As we begin 2025, the current rate of spending (SAAR) for Nonresidential Buildings in Q4’24 is $761bil, only 2% higher than the average for 2024 ($746bil). If spending stays at the current level and no additional growth occurs, Nonresidential Bldgs spending will finish 2024 up 2%. Spending would need to have more monthly declines than increases to finish the year up less than 2%. The current forecast shows the monthly SAAR rates for Manufacturing, Warehouse and Office w/o DC are driving the downward pressure on overall spending.
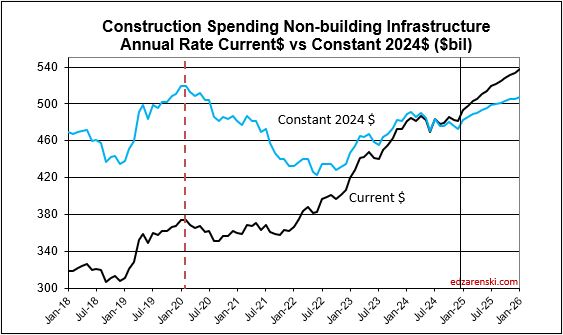
Non-building Infrastructure current rate of spending is only 1% higher than the average for 2024, however the forecast is indicating steady growth of 1.5%/mo for all of 2025. Highway, Transportation and Public Utilities are all contributing to that growth in the spending rate.
Residential current rate of spending is a bit less than 2% above the 2024 average. Growth of 1%/mo will occur in the 1st half 2025, then reverse to a slight decline in the 2nd half.
My construction spending forecast for 2025 Nonres Bldgs is only an annual gain of 2%. Low growth is driven by projects ending in Manufacturing and Warehouse. In the last 3 yrs, there were $230bil Mnfg starts, most in 2022, $130bil above normal, now some are ending. Without Manufacturing, Nonres Bldgs 2025 spending would be up 6%. So while outward appearance may be that Nonres spending is declining, in large part it is due to mega spending on Manufacturing buildings (and Warehouse) tapering down upon completion, creating very large annual declines, but normal. See The Manufacturing Spending Taper
Whenever we get an unusually large increase in new construction starts and spending, the tapering off of those projects leads to a decline in spending in the 2nd half of the scheduled construction. Mnfg new starts peaked in late 2022 – early 2023, so some of these projects would now be in construction for anywhere from 24 to 30 months, well past the midpoint or peak spending. Here’s what the manufacturing spending taper may look like.

In three years, 2020-2022 Manufacturing new starts increased by over 200%. Now, even projects that started in late 2022 are more than 24 months into construction. Peak spending occurs at the midpoint of a project, so peak spending may already be behind us. The current rate of spending in constant$, with exception of Oct. which jumped 2%, remained near flat for the last 8 months. Mnfg new starts peaked in late 2022 – early 2023, so some of these projects would now be in construction for anywhere from 24 to 30 months, well past the midpoint or peak spending. It appears the slowdown in the 2nd half 2024 may be an indication that spending peaked. Although 2025 spending begins 4% higher than 2024 average, my model indicates the rate of spending drops 10% by midyear and by year-end is down 25% from current spending. I’m forecasting 2025 spending average falls 8.5% below 2024.
See The Manufacturing Spending Taper
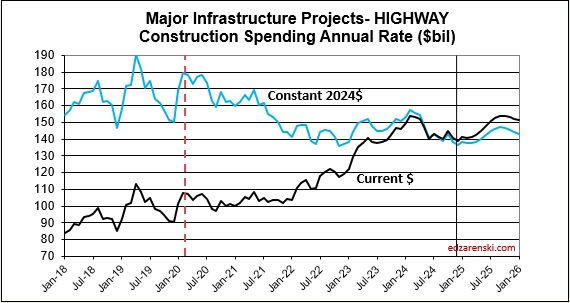
This same scenario will occur in Highway/Bridge. Normal Highway starts have consistently been about $100bil/yr, with slow growth. But actual starts were closer to $500bil total for the last three years. This strong growth in starts is expected to continue at least into 2025, totaling near $650bil for four years. Again, consider that part of that is inflation, but the remainder is government investment growth. So a decline from the taper back to normal for Highway/Bridge may not show up at least for the next few years. Once the taper begins it will have the same effect on Non-bldg Infrastructure spending that we will see from Manufacturing in Nonres Bldgs.
Residential spending is 45% SF, 15% MF and 40% Reno. So, only 60% of the total is spending on new housing units. The other 40% is Renovations. Single family construction spending reached a post-2006 high in Q4’21 thru Apr’22. From Apr’22 to the low-point in May ’23 spending dropped 25%. By year-end 2023 it had recovered most of that drop. It fell again in mid-2024, but has since recovered again to the year-end’23 level. Single Family spending is up 7% in 2024 over 2023. Multi-family in Q4’24 is down 10% from Q4’23. Renovations is up 15% from Q4’23 to Q4’24.

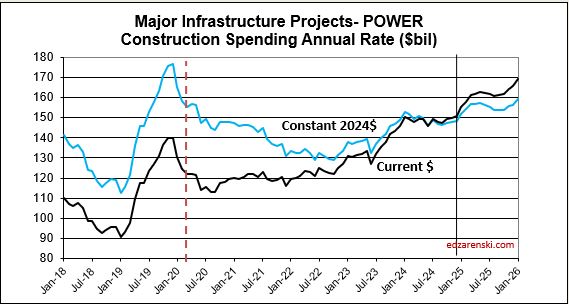
The Non-Building Infrastructure spending forecast for 2025 will be most affected by the fact that Power starts for the last 3 years range from 9% to 11%, Highway new starts range from 8% to 11% and Public Works new starts range from 13% to 17%. Starts have been greater than spending each of the last three years. Backlog increased 10% each in 2023 and 2024 and 9% in 2025. Power spending will increase $13bil (8.5%) in 2025, supported by 22% growth in starts the last 2 years. Public Utilities (Sewage and Waste, Water Supply and Conservation-Rivers-Dams) will increase $12bil (13%), with 30% growth in starts the last 2 years.
The Nonresidential Buildings spending forecast for 2025 is most affected by declines in Manufacturing and Warehouse, and increases in Educational and Data Centers. Starts in 2021 and 2022 increased at an average 14%/yr. But new starts in 2023 were only 5.5%, and in 2024 were only 2.6%. Starts in 2023, and especially 2024, have the most impact on 2025 spending. Backlog is increasing, but the rate of backlog growth has slowed from 15% in 2022 to 5% in 2024 and 2% in 2025. Although Data Center spending is expected to increase 42%, that is $12bil. Educational spending will also increase $12bil, even though that is only 9%.
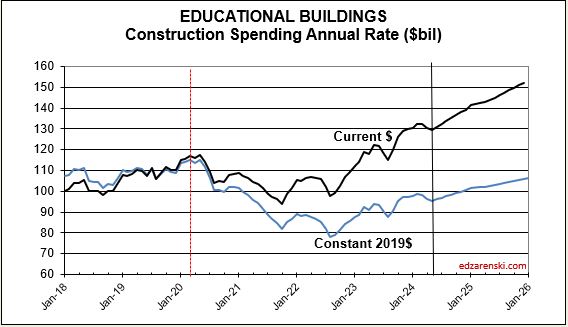
Educational SAAR rate of spending begins 2025 4.5% higher than the average for 2024. Starts are up 18% over the last 2 years. Spending finished 2024 3% higher than it started. The rate of spending is increasing at 0.50% to 0.75%/month for 2025. My forecast is for 9% spending growth in 2025.


Healthcare SAAR rate of spending begins 2025 0.5% lower than the average for 2024. Starts are up 22% over the last 2 years. The rate of spending, increasing since June, is flat in Q1’25, then increases at an average of 1.5%/month for Q2 and Q3 before slowing. My forecast is for 6% spending growth in 2025.
Amusement /Recreation SAAR rate of spending begins 2025 3.0% higher than the average for 2024. Starts are up 18% over the last 2 years. The rate of spending, up 9% from Q1’24 to Q4’24, increases at an average 1.25%/month for 2025. My forecast is for 13% spending growth in 2025.
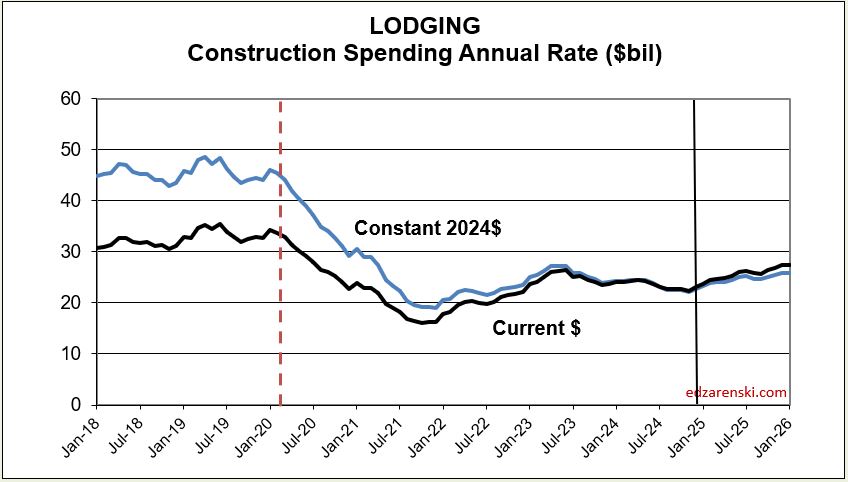
Lodging SAAR rate of spending begins 2025 3% lower than the average for 2024. Starts are up 14% in 2024 and 20% over the last 2 years. The rate of spending, lower in the 2nd half 2024, increases at an average of 1.25%/month for 2025. My forecast is for 9.5% spending growth in 2025.

Office Bldgs w/o Data Centers SAAR rate of spending begins 2025 3.6% lower than the average for 2024. Starts are down 15% over the last 2 years. Spending in the 2nd half of 2024 is down 5% from the 1st half, in fact from Q1’24 to Q4’24, the rate of spending fell 10%. The rate of spending increases 0.5%/mo in Q1’25, but then falls at 0.50% to 0.75%/month for Q2 thru Q4. My forecast is for a 4% spending decline in 2025.

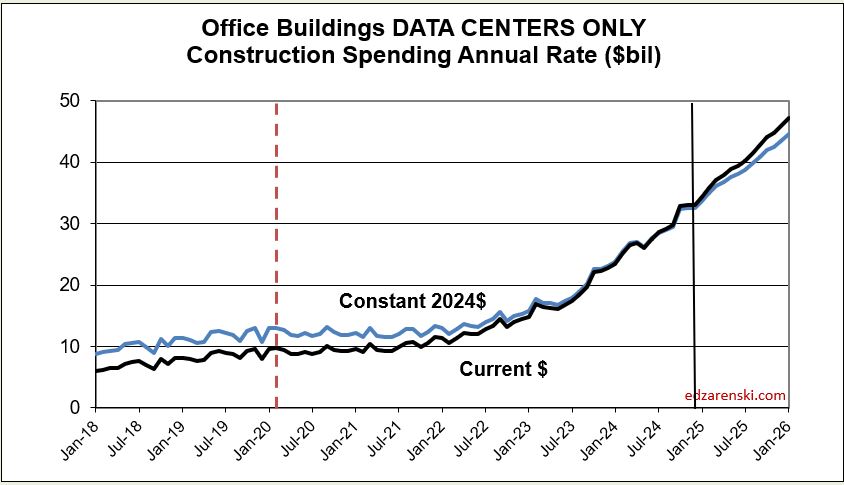
Data Centers SAAR rate of spending begins 2025 16% higher than the average for 2024. Starts are up 120% over the last 2 years. From beginning to end of 2024 spending increased 20%. The rate of spending increases at near 2%/month for 2025. My forecast is for 42% spending growth in 2025.
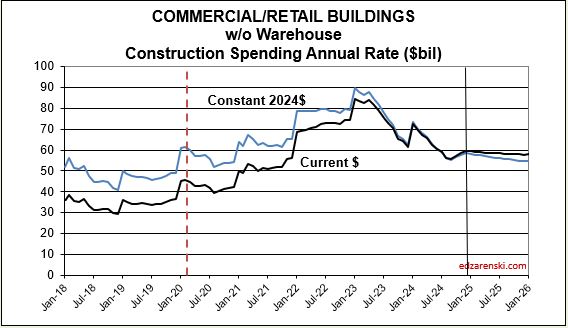
Commercial / Retail Bldgs w/o Warehouse SAAR rate of spending begins 2025 only 1.5% higher than the average for 2024. Starts are down 0.5% over the last 2 years. In 2024, the rate of spending fell 3% over the year. The rate of spending begins 2025 with a slight drop then is flat for the rest of the year. My forecast is for 1% drop in spending in 2025.

Warehouse Bldgs SAAR rate of spending begins 2025 2.7% lower than the average for 2024. Starts are down 17% over the last 2 years. Spending in the 2nd half of 2024 is already down 13% from the 1st half 2024. The rate of spending in 2025 drops at 0.25%/month. My forecast is for 4% spending decline in 2025.
Highway SAAR rate of spending begins 2025 2.9% lower than the average for 2024. Spending fell 7% over the course of 2024, but still finished the year up 4%. Starts are up 18% over the last 2 years. Monthly spending is up and down, but averages 0.8%/mo for the year. My forecast is for 3% spending growth in 2025.
Power SAAR rate of spending begins 2025 2.0% higher than the average for 2024. Starts are up 22% over the last 2 years. 2024 spending finished level with where it started and begins 2025 up 2% over avg. 2024. The rate of spending starts strong at 2%/mo in Q1, then falls back to 0.3%/mo for the remainder of 2025. My forecast is for 8.5% spending growth in 2025.
Public Utilities SAAR rate of spending begins 2025 1.7% higher than the average for 2024. Starts are up 29% over the last 2 years. From Q1’24 to Q4’24, spending increased 9%. The rate of spending slows from 1.5%/mo at the beginning of 2025 to 1%/mo by year-end. Sewage/Waste and Water Supply provide the greatest $ growth. My forecast is for 13% spending growth in 2025.
Transportation SAAR rate of spending begins 2025 4.0% higher than the average for 2024. Starts are up 9% over the last 2 years. Spending finished 2024 6% higher than it started. The 2025 rate of spending starts strong just above 1%/mo, but averages only 0.75%/mo for the whole year. My forecast is for 8.7% spending growth in 2025.

STARTING BACKLOG
Starting backlog is the estimate to complete (in this analysis taken at Jan 1) for all projects currently under contract. The last time starting backlog decreased was 2011. If new construction starts in the year are greater than construction spending in the year, then for the following year starting backlog increases. It’s when new starts don’t replenish the amount of spending in the year that backlog declines.
80% of all nonresidential spending in any given year is from backlog and could be supported by projects that started last year or 3 to 4 years ago. Residential spending is far more dependent on new starts than backlog. Only about 30% of residential spending every year comes from backlog and 70% from new starts.
The table below, Forecast Starting Backlog, is model generated by Construction Analytics. Adjusted starts are spread over time to generate cash flow. Spending each year is subtracted from starting backlog and new starts are added to get starting backlog in the following year.

Construction Backlog leading into 2025 in total is up 53% from Jan 2020. Even though several markets are down for the year, every sector (Res, Nonres, Nonbldg) is at all-time high. Since 2020, construction starts have been greater than construction spending, therefore backlog is increasing, but the spread is decreasing. From 2015 through 2019, new construction starts were steady at 4% greater than spending. In 2020, 2021 and 2022, starts exceeded spending by 8%. In 2023 it fell to 6% and in 2024 it was 5%. For 2025, starts are expected to exceed spending by only 3%, indicating the rate of backlog growth is slowing.
Reaching new highs in Backlog could mean not enough labor to support advancing growth so quickly. Future workload from new starts is piling up faster than the current workforce can complete. And the labor force has limitations to how fast it can grow. Nonresidential Bldgs and Non-building posted higher than average starts growth vs spending.
Residential new starts average only 2% greater than spending. Residential new starts in 2023 were lower than spending, so, in 2024, for the first time in 10 years, residential backlog decreased. Even then, residential backlog beginning 2025 is up 61% since 2020. However, these backlog numbers are not inflation adjusted. 45%, or about ¾’s of the 61% residential backlog growth over 5 years is inflation. Real residential backlog growth since 2020 is 16%.
Nonresidential Bldgs starting backlog for 2025 received a boost from all the starts in 2021, 2022 and 2023. Backlog is up 55% from 2020. After 36% inflation, real backlog growth over 5 years is 19%.
Non-building Infrastructure starting backlog was also boosted by strong starts in 2021- 2024. For 2025, backlog is up 49% from Jan 2020. After 38% inflation, real backlog growth over 5 years is 11%.
Manufacturing backlog increased 130% from 2020-2025, from $117bil going into 2020 to $270bil beginning 2025. Prior to tracking Data Centers separately, no other market has ever been close to that growth. But, Manufacturing is 6 times the dollar value of Data Centers. Manufacturing was responsible for 60% of all the Nonres Bldgs spending $ growth in 2023 and 85% in 2024. It was also responsible for 33% of the Nonres Bldgs Backlog growth from 2020 to 2025.
Nonres Bldgs has a total 3.7 million jobs and has never increased by more than 150,000 jobs in one year. Manufacturing is 30% of all Nonres Bldgs spending, so we can assume 30% of Nonres Bldgs jobs. That’s 1.1 million jobs supporting just Manufacturing projects. So Backlog of $270bil, at 5000 jobs per billion per year, would need 1,350,000 jobs for a year. With a 1,100,000 jobs share of the workforce, $270billion in backlog would provide support for 15 months. Of course, new starts add to support throughout the year, but the calculation of how long backlog would support that market segment is valuable.
Likewise, Highway/Bridge has 2025 starting backlog of $240billion and represents 30% of Non-bldg Infrastructure spending, so may occupy 30% of Non-bldg jobs, or 345,000 jobs. But Non-bldg work requires fewer jobs, more like 3,000 jobs/bil/yr, so $240 billion at 3000 jobs/billion/year would need 720,000 jobs for 1 year to complete. Therefore, with a pool of only 345,000 jobs supporting highway work, the backlog of $240billion would provide support for 25 months.
Backlog at the beginning of the year or new starts within the year does not give an indication of what direction spending will take within the year. Backlog is increasing if new starts during the year is greater than spending during the year. An increase in backlog could immediately increase the level of monthly spending activity, or it could maintain a level rate of market activity, but extended over a longer duration. In this case, there is some of both in the forecast. It takes several years for all the starts in a year to be completed. Cash flow shows the spending over time.
NEW CONSTRUCTION STARTS
Total construction starts for 2024 are up 5.3%. Residential starts increased 5.7%.Nonresidential Buildings starts gained 2.6% and Non-building Infrastructure starts are up 8.3%.
Total construction starts for 2025 are forecast to increase 3.8%. Residential starts are forecast to increase 6.1%. Nonresidential Buildings starts are expected to gain 2.5% and Non-building Infrastructure starts will be up only 1.6%.
Residential starts increased 5.7% in 2024. Only about 30% of the spending in 2025 comes from 2024 starts. Most of the spending (70%) in 2025 comes from projects that starts in 2025. This is a result of short duration single-family and renovations projects. Residential starts are expected to increase 6.1% in 2025.
Nonresidential Buildings, starts fell 20% in the 1st half 2023 but still posted the 2nd highest 6-mo average ever. Some of these starts will still be adding to spending into 2025. Nonres Bldgs starts for 2024 gained only 2.6%, due to large declines of 7% to 8% in Manufacturing, Office w/o Data Center and Warehouse, and a moderate 1.2% decline in Commercial / Retail w/o Warehouse. Office w/o Data Center has fallen each of the last 5 years and is down 15% in the last 2 years. Manufacturing starts in 2025 are expected to drop -13%, Office w/o Data Center -4%. Strong growth in new starts in 2025 is expected from Data Centers, Lodging, Healthcare and Public Bldgs (80% of Other Nonres Bldgs). The forecast for Nonres Bldgs new starts in 2025 is +2.5%.
Non-building starts for the 6-mo period Mar-Aug 2023 posted the best 6 months on record, up 30% from the average of 2022. For 2024, Power, Highway/Bridge and Public Works have the strongest gains. These same three markets had the strongest gains in 2023. Power starts are up 22% the last two years. Highway starts are up 19% the last two years. Environmental Public Works are up 29% the last two years and up 50% the last three years. Total Non-building Starts for 2024 are up 8.3%. Non-building starts for 2025 are forecast up only 1.6%.

Data Center starts are up 300% since 2020, up 53% in 2023 and up 44% in 2024, and are expected to increase 27% in 2025. In 2014-2015, Data Centers was less than 5% of total Office+DC construction spending. Today it is approaching 30%. Next year it will approach 40%.
Warehouse starts have dropped 17% in the last two years. Warehouse spending will now slow after climbing 100%+ since 2019. In 2015, Warehouse was 25% of total Commercial spending. By 2022 it had climbed to 54%. In 2025, it will fall back to 45%. But spending will remain near the current level at least for the next three years. Warehouse starts will remain flat in 2025.
Manufacturing starts, the market with the largest $ movement, fell 8.7% in 2024, but still gained 115% from 2019 to 2024. Manufacturing projects can have a moderately long average duration because some of these are multi-billion $ projects and can have schedules that are 4 to 5 years, so some of these projects are still contributing a large volume of spending in 2025. However, as earlier projects begin to taper off, spending will begin to decline.
Manufacturing starts hovered near $80bil/yr from 2014 through 2019. By 2023 new starts had increased to $206bil/yr. Starts fell 9% in 2024 and are predicted to fall by $20bil/yr to $30bil/yr (10% to 15%) over the next three years. Spending is predicted to decline by approx. 10%/yr for the next three years.
Public Works project starts have increased on average 15%/yr for the last four years. Project starts are up 75% in the last four years. Spending is predicted to climb for the next three years.
CURRENT $ SPENDING / INFLATION / CONSTANT $ VOLUME
Volume = spending minus inflation. Spending includes inflation. Inflation adds nothing to volume.
Many construction firms judge their backlog growth by the remaining estimate to complete of all jobs under contract. The problem with that, for example, is that Nonresidential Buildings spending (revenues) increased 14% in 2022, but after adjusting for 12% inflation the actual volume of work was up only 2%. By this method, firms are including in their accounting an increase in inflation dollars passing through their hands. Spending includes inflation, which does not add to the volume of work.
Total volume for 2024 is up 3.1%. Residential +2.7%, Nonres Bldgs +3.3%, Non-bldg +3.5%.
Total volume forecast for 2025 is +1.3%. Residential +2.9%, Nonres Bldgs -1.9%, Non-bldg +3.0%.
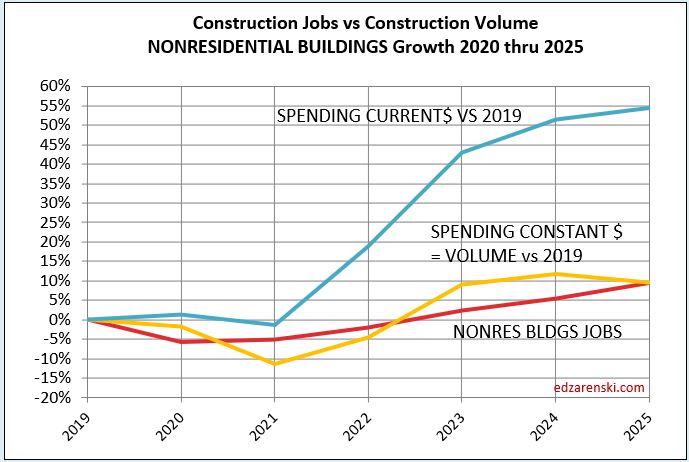
Since 2019, spending has increased 55%. Volume has increased only 10%. The difference is inflation.
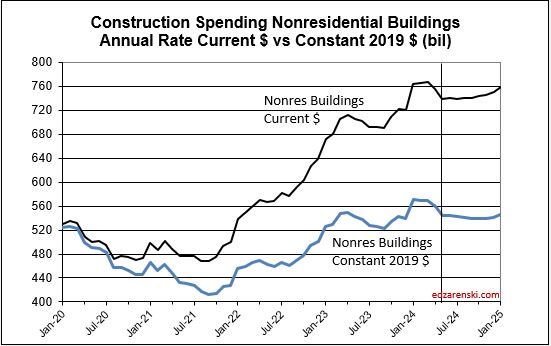
Inflation adjusted volume is spending minus inflation, or to be more accurate, spending divided by (1+inflation). Inflation adds nothing to volume growth. The following table shows spending, inflation and volume (spending without inflation) for each year. Spending is current to the year stated. The values in the constant table are indexed to a constant value year, now using 2024. This shows business volume year to year, can be a lot different than spending would indicate. When inflation is positive, volume is always less than spending by the amount attributed to inflation.
Caution: the following table, showing Constant$ analysis, now shows Constant$ with base year at 2024. Since Q1-2020 I have used the base year at 2019. This update changes the Constant$ amount, but not the Constant$ percent growth. Slight changes in prior years inflation resulted in some minor changes in Constant$ growth.

Spending during the year is the value of business volume plus the inflation on that volume. When inflation is 12%, volume plus 12% = total spending. Revenue is generally measured by spending put-in-place during the year. Therefore, Revenue does not measure volume growth. In 2022, Nonresidential buildings inflation was 12%, so business volume was 12% less than spending, or 12% less than revenue. Residential volume was 15% less than spending.
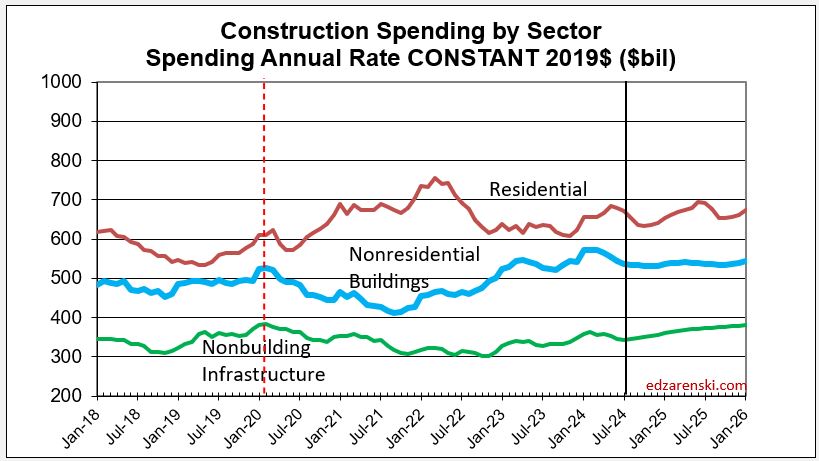
Construction spending includes inflation, which adds nothing to the volume of work put-in-place. Construction Volume is a measure of business activity. It eliminates inflation as a variable and shows Constant$ growth. As an example, 2021-22 posted some of the biggest spending increases we’ve seen in 20 years, up over 25% in two years. But, if you look at the bottom row in the table above, we see constant$ growth, or volume, increased only 1.6% in those two years. The inflation rates for those years confirms that almost all of the spending increases were inflation, not added business volume. Construction volume, (spending minus inflation) will finish 2025 up 1.3%, but up only 12% since 2019.

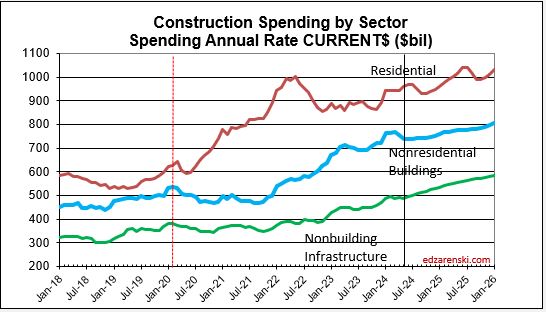
Compare this following Spending by Sector Constant$ plot to the Sector Current$ plot at the beginning of this article.
CONSTRUCTION JOBS
Construction Jobs should not get compared to construction spending. Spending includes inflation, which adds nothing to business volume. Compare Jobs growth to Volume growth. If volume is declining, there is little to no support to increase jobs. And yet, we’ve seen historically that jobs increase at an approximately 3.5%/yr, even when volume does not increase.

Construction Jobs increased 204,000 jobs or 2.5% in 2024. There are currently 8,291,000 construction jobs reported by BLS. The largest annual increase post 2010 is 321,000 jobs (+4.6%) in 2018. The average jobs growth post 2010 is 200,000 jobs per year.
From 2012-2019, we added an annual average 245,000 jobs/yr (+3.9%). From 2021-2024, we added 240,000 jobs/yr (3.1%). In 2024 we added only 204,000 jobs (2.5%). Since 2011, there have been only 3 years in which we added fewer than 200,000 jobs, 2012, 2020, 2021. Also, since 2011, there have been only 3 years in which we added more than 300,000 jobs, 2015, 2018, 2022. Seldom do jobs increase by 400,000 or by 5%/yr. Excluding down years, since 2012, average annual growth is 3.6%/yr.
Here’s an enlarged view of just Jobs/Volume. Removing Spending enhances the vertical scale.

From 2012-2019, we added an annual average 245,000 jobs/yr (+3.9%). From 2021-2024, we added an average of 240,000 jobs/yr (3.1%). In 2024 we added only 204,000 jobs (2.5%). Since 2011, there have been only 3 years in which we added fewer than 200,000 jobs, 2012, 2020, 2021. Also, since 2011, there have been only 3 years in which we added more than 300,000 jobs, 2015, 2018, 2022. Seldom do jobs increase by 400,000 or by 5%/yr. Excluding down years, since 2012, average annual growth is 3.6%/yr.
January jobs report shows we added 4k jobs in Jan, but the unemployment rate went up from an average 4.7% in Q4 2024 (5.2% in Dec), to 6.5% in Jan.
3-7-25 Construction gained 19k (+0.2% mo/mo) jobs in Feb, BUT total hrs worked fell -0.3%. Total jobs have increased but hrs worked has gone down in each of the last 5 months. We’ve posted minor jobs gains in both Jan and Feb, and yet unemployment has gone up from 5.2% in Dec to 7.2% in Feb.
The unemployment rate in construction goes UP in the 1st qtr every year, by at least 2% to 3% (data since 2011). Now, your 1st thought may be, if unemployment is increasing, that is probably because jobs are falling. Well, construction has ADDED jobs in the 1st qtr. every year since 2011 (excluding 2020), by an avg of nearly 30% of all jobs added annually. Construction unemployment is not going up in winter months because we lose jobs in winter. So how can the unemployment rate still go up? The numerator (jobs) is increasing. There’s only one number left in the equation, the denominator (workforce). The result goes up because the entire workforce increases. In this case, the workforce is increasing by greater than the number of jobs added. So, when the unemployment rate increases in Q12025, don’t assume it is because we are losing jobs.
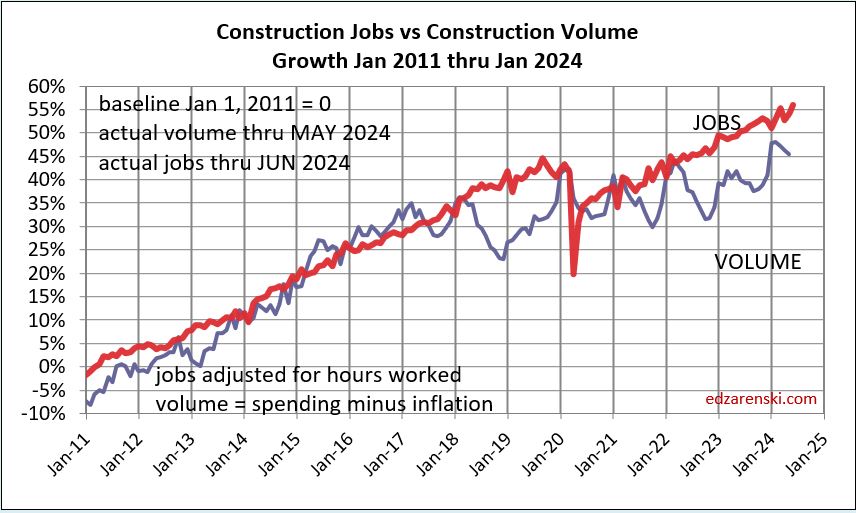
The plot below shows how consistent jobs growth has been over the last 14 years. After the 2020 dip, the slope (annual rate of growth) of jobs growth is about the same as Jan2011-Jan2020. Jobs increase at about 3.5%/yr to 4%/yr., regardless of what volume is doing. In fact, since 2016, the last time volume increased by more than 4%, jobs are up 22%. Volume is up only 11%.

Since Jan 2011, average jobs growth is 3%/yr. Average volume of work growth since 2010 is 2.3%/yr. This plot above shows Jobs and Volume growth closely match from 2011 to 2018. With few exceptions for recession periods, this pattern can be seen throughout the historical data.
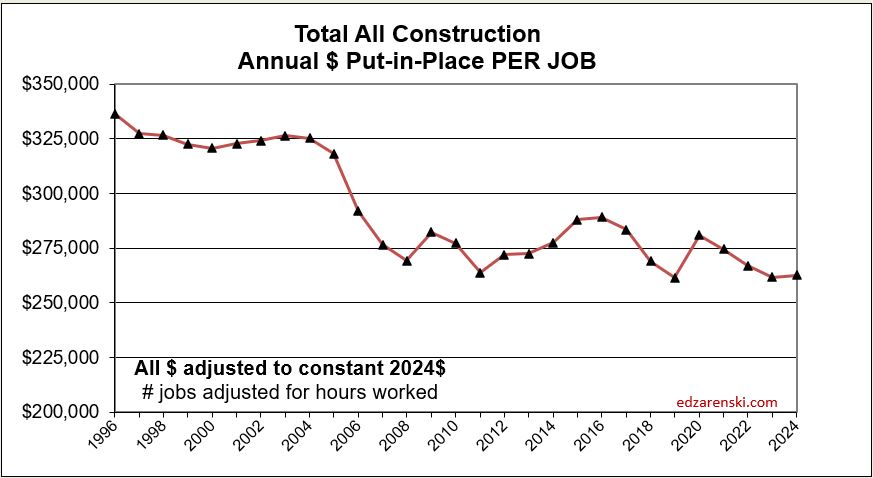
What’s remarkable about the growth is this; since 2016, spending has increased 77%, volume after inflation increased only 11% and jobs increased 22%. Volume and jobs should be moving together.
It takes about 5000 (Nonres) jobs to put-in-place $1 billion of volume in one year. It could easily vary from 3000 to 5000, depending on the type of work. So, on average, an add of $100 billion+ of Nonres Bldgs in one year would need 500,000 new jobs. Jobs should track volume, not spending growth. Volume = spending minus inflation. Normal construction jobs growth is about 250,000 jobs per year and maximum prior annual growth is about 400,000.

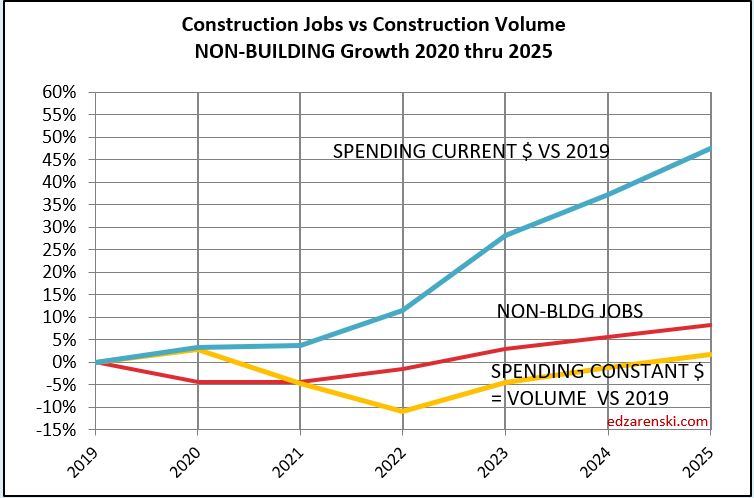
Non-building, over the next two years, could experience the same kind of growth spurt as Nonres Bldgs., a forecast increase in volume the next two years without an equal increase in jobs. Volume which was lower than jobs since 2021, is now increasing faster than jobs. Non-bldg volume is forecast up 6% to 8%/year the next 3 years. Jobs increase at an avg. 3.5%/year.
Residential volume has exceeded residential jobs all the way back to 2011. The recent decline in volume brings the two even, if the jobs hold the pace.

For as long as I can remember, the construction industry has been complaining of jobs shortages. And yet, as shown in the data mentioned above, jobs have increased greater than volume of work. With an exception for recession years, (2007-2010 and 2020), jobs increase at a rate of 2.5% to 3% per year. The greatest disparity between jobs and volume occurred in late 2022, when jobs growth had already resumed normal pace, but volume of work was still reeling from the effects of new construction starts that were canceled dating back to late 2020 and early 2021. Recent volume growth at a much faster rate than jobs growth is now closing the gap.
For the 4yr period 2021 thru 2024, jobs are up 13%, but volume of work put-in-place is up only 6%.
Don’t be surprised if 2025 construction jobs growth slows a bit. Jobs are slightly ahead of volume growth, particularly in the Non-building Infrastructure sector. Since 2019, both Jobs and Volume increased 10%. But that includes 2020, when volume increased 4% but jobs fell by 250k, or 3%.
When jobs increase without an equal increase in the volume of work, productivity declines. This recent increase in volume and the projected increase in volume in 2024, several points stronger than jobs, will offset some of the disparity which has been negative for a long time.
The Harvard Joint Center for Housing Studies recently posted that In Texas, California, New Jersey, and the District of Columbia, immigrants make up more than half of construction trade workers. This analysis will make no effort to discuss the potential impact of immigrants in the workforce, but we must recognize the makeup of who is filling these jobs. Keep in mind after this analysis reaches some conclusions that this aspect may weigh heavily on the outcome.
INFLATION
To properly inflation adjust the cost of construction, use a Final Cost Inflation Index.
General construction cost indices, that do not address labor, productivity or margins and Input price indices, don’t reflect whole bldg final cost and therefore do not capture the full cost of escalation in construction.
Final cost indices represent total actual cost to the owner and are usually higher than general indices. Producer Price Index (PPI) INPUTS to construction reflect costs at various stages of material production, may not represent final cost of materials to the jobsite and do not include labor, productivity or margins. That’s why a PPI Inputs index +20% for a material could be only a +5% final cost. PPI Final Demand indices include all costs and do represent actual final cost.
Construction Analytics Building Cost Index is a weighted average of eight final cost indices.
The following Construction Inflation plot (for Nonresidential Buildings only) shows three elements: 1) a solid grey bar reflecting the max and min of the 10 indices I track in my weighted average inflation index, 2) a solid black line indicating the weighted average of those 10 indices, and 3) a dotted red line showing the Engineering News Record Building Cost Index (ENR BCI). Notice the ENR BCI is almost always the lowest, or one of the lowest, indices. ENR BCI, along with R S Means Index, unlike final cost indices, do not include margins or productivity changes and in the case of ENR BCI has very limited materials and labor inputs.

The solid black line (above) represents the Construction Analytics Building Cost Index for Nonresidential Bldgs and is a final cost index.
This short table shows the inflation rate for each year. Useful to compare to last year, but you would need to mathematically do the compounding to move over several years. The plot below shows the cumulative inflation index, or the cumulative compounded effect of inflation for any two points in time.
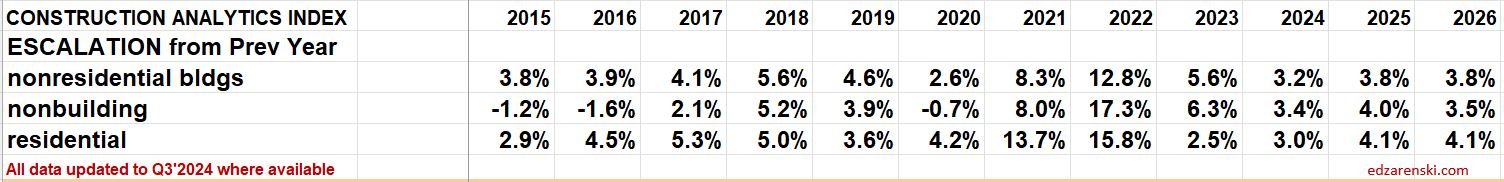
30-year average inflation rate for residential and nonresidential buildings is 4.1%. But when excluding deflation in recession years 2008-2010, for nonresidential buildings the long-term average is 4.7% and for residential is 4.9%. For Non-bldg Infrastructure the 30-year average is 3.6%. When excluding deflation in recession years 2008-2010, Non-bldg long-term average inflation is 3.9%.
Since 2011, Nonres Bldgs inflation is 4.8%, Residential is 5.4% and Non-bldg is 4.3%.
Reference Inflation Data Construction Inflation 2024

Construction Analytics Nonres Building Cost Index is a weighted average of eight final cost indices. It is compared below to the PPI Inputs (not final cost) and PPI Final Demand (yes final cost).

Final cost indices represent total actual cost to the owner and are usually higher than general indices.
Producer Price Index (PPI) INPUTS to construction reflect costs at various stages of material production, generally do not represent final cost of materials to the jobsite and do not include labor, productivity or margins. Even with that, a PPI Inputs index +20% for a material could be only a +5% final cost. PPI Final Demand indices include all costs and do represent actual final cost.
We can’t always tell what affect changes in the cost of construction materials will have on the final outcome of total construction inflation. PPI materials index does not account for productivity or margins and varies on stage of input.
Jan’25 Inputs are up, +0.8% to Nonres, +1.2% to Residential and 1.2% to Highway, the largest increases since Jan’24. The largest Input item increases in January are Paving Mixtures (up 14.6%), Diesel Fuel (up 3.6%), Concrete Brick, Block & Pipe (up 2.2%), Copper & Brass Shapes (up 1.9%) and Flat Glass (up 1%). Steel Pipe & Tube is down 1.3%. Both Lumber/Plywood and Fabricated Structural Steel are down 0.5% or less.
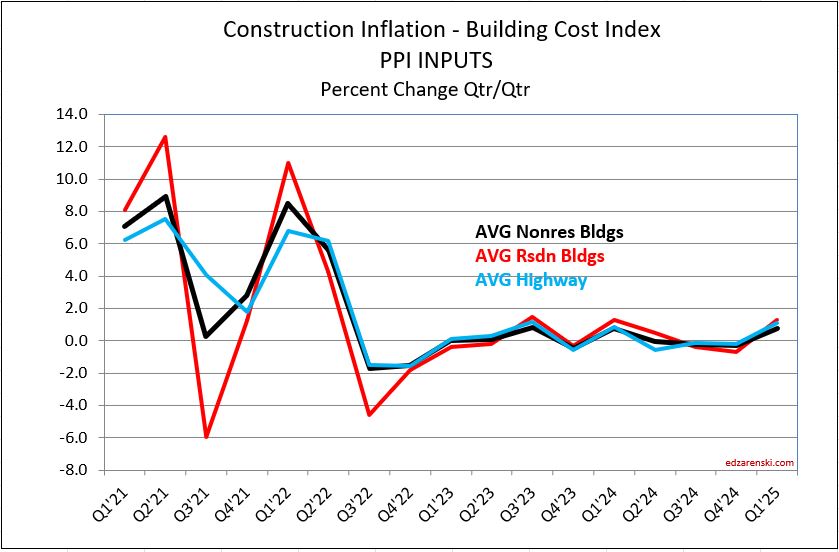
The PPI Final Demand index (for Nonresidential Bldgs only) is one of several that does account for labor and margins, hence it is defined as a final cost index. In this plot, Jan’25 closes out Q4’24. Total growth in 2024 was only 0.4%.

A Check on Measuring Methodology
And finally, here’s one of the markers I use to check my forecast modeling, my forecasting performance tracking index. The light plot line is forecast predicted from my modeling. The dark plot line is actual construction spending. Even after any separation in the indices, the plots should move at the same slope. Almost without fail, the forecast model, estimated spending from cashflow, predicts the changes in direction of actual spending. The nonresidential buildings plots (and the residential plot prior to 2020) are remarkably close, providing an indication the method of analysis employed, cash flow of all construction starts to get spending forecast, is reasonably accurate.

Note the divergence of residential in Jul-Dec 2020. Actual residential spending finished much higher than predicted. Even the cash flow from an all-time high in new residential starts does not predict spending to increase so rapidly. But residential project spending was fully back to prior levels by August 2020, within 3 months from the May 2020 bottom. In 3 months, the actual spending pushed 15% higher than starts predicted. A part of the spending was the resumption of delayed projects, but another big part was renovations, which surged, and reno is 40% of all residential spending.
Construction Inflation 2025 – 2-21-25 PPI data, INDEX TABLES, Inflation History
Construction Briefs – As We Begin 2025 jobs and unemployment, PPI and tracking edz
Construction – Brief Thoughts Dec’24 thoughts on jobs and when spending mega ends
Compare 10 Construction Forecasts Jan 2025 Jan and Midyr Forecasts compared to actual at end of yr
The Next Forecast Challenge written Apr 2023. Nonres volume did climb much faster than Jobs.
This analysis does not take into consideration the inflation impact of a recession or significant new tariffs. Nor does it assume losing any portion of the workforce to deportation. These are all possible. Construction starts may be negatively affected, and if so, then construction spending will also be affected. Some business will be negatively affected. All will lead to higher inflation.
You can print the Summary report by selecting/printing just the first 5 pages.
Construction Briefs – As We Begin 2025
We are close enough, now in mid-January, to see where the numbers will end up for 2024. Construction spending as of Nov is up 6.5% year-to-date vs same 11 months in 2023. We are up 6.0% ytd vs the average of 2023. My forecast predicts we end 2024 up 6.2%, but growth is only 3.4% in 2025.
In February of 2024, with the Dec 2023 data in hand, my forecast for 2024 spending was $2,190 billion, only 1.8% higher than my current (Nov’24 data) forecast of $2,150 billion. Most of that early higher estimate was due to what I carried for my residential forecast, which I have since lowered by 3.6% from the initial forecast at the beginning of 2024. You can see in this monthly summary table that the Nonresidential Bldgs and Non-building forecasts have varied very little and the Total forecast has not varied up or down by more than 0.4% over the last 4 months.
edit 2-3-25 updated table to include Dec data. See the line comparing actual to the SEP data forecast.

Single family construction spending reached a post-2006 high in Q4’21 thru Apr’22 ($480bil). From Apr’22 to the lowpoint in May ’23 ($360bil) spending dropped 25%. By year-end 2023 it had recovered almost 3/4ths of that drop. It fell again in mid-2024 to $410bil, but has since recovered to the year-end’23 level ($450bil). That drop is reflected in the difference between the current forecast and the earlier forecast.
NAHB – Cost of Constructing a Home 2024 excellent summary www.nahb.org/-/media/AB4E…
Construction spending in 2024 will hit near $2.15trillion, another new high, up 54% since 2019.
Caution: the following table, showing Constant$ analysis, now shows Constant$ with base year at 2024. Since Q1-2020 I have used the base year at 2019. This update changes the Constant$ amount, but not the Constant$ percent growth. Slight changes in prior years inflation resulted in some minor changes in Constant$ growth.

The last time construction spending declined was 2011. But construction spending includes inflation, which adds nothing to the volume of work put-in-place. Construction volume, (spending minus inflation) will finish the year up only 10% since 2019.
My construction spending forecast for 2025 Nonres Bldgs is down 0.7%. But it’s driven by projects ending in Manufacturing (and Warehouse). In the last 3 yrs, there were $230bil Mnfg starts, most in 2022, $130bil above normal, now some are ending. Without Mnfg, nonres bldgs 2025 spending would be up 4.5%. So while outward appearance may be that nonres spending is declining, in large part it is due to mega spending on Manufacturing buildings (and Warehouse) tapering down upon completion, creating very large annual declines, but normal. See The Manufacturing Spending Taper
Last year at this time, many of the Nonres Bldgs and Non-bldg line items showed Nov-Dec spending was already several points higher than the 2023 average. This was an indication leading into 2024 that those markets were on track to start the year already up. This year,most markets show a decline from the 1st half of the year into the 2nd half. Two notable declines are Warehouse and Office w/o Data Centers. Both start 2025 down 5%+ from the average in 2024.

I didn’t realize how much impact there was with the inclusion of (increasing) Data Centers in the (decreasing) Office construction spending values. I’ve now separated Data Centers from Office and Warehouse from Commercial/Retail. Office spending was pretty strong near it’s highs until 2h’22. Early in ’24 it had fallen to 8%-12% below ’22. Office spending is now 15%-18% below 2022. On the other hand, Data Center spending as of Nov is up 30% from the same months in 2023, and is up more than 60% above the average of 2023 and 120% above 2022. It will continue to increase into 2025.
In 2014-2015, Data Centers was less than 5% of total Office+DC construction spending. Today it is approaching 30%. Next year it will approach 40%. In 2015, Warehouse was 25% of total Commercial spending. By 2022 it had climbed to 54%. In 2025, it will fall back to 45%. Warehouse spending is now decreasing after climbing 100%+ since 2019.
Dodge reports as of Nov construction starts for 2024 up 5% YTD. Residential starts up 7%. Nonresidential Buildings starts up 4%. Non-building starts up 5%.
Construction Jobs do not get compared to construction spending. Spending includes inflation, which adds nothing to business volume. Compare jobs growth to Volume growth.

Construction Jobs counts here are the average for the year. That accounts for months during the year, other than Dec/Dec, with higher (or lower) percentage of yr/yr growth. For instance, total jobs Dec24 vs Dec23 increased only by 196k jobs or 2.4%. If you based annual growth on Dec/Dec, it would indicate 2024 increased by 2.4%. However, during the year, jobs growth in Mar-Apr-May were all greater than +3% compared to same month prior year. In fact, every other month during the year had a higher yr/yr growth rate than Dec/Dec. Yearly average of all 12 months shows total jobs annual average up 226K or 2.8%.
Dec/Dec shows a snapshot in time of one month compared to same month last year, without taking into account what might have happened in any of the other 11 months. YR24avg/YR23avg shows the change in the number of jobs over the whole year and accounts for all activity in the year.
Jobs 2024 AVG thru DEC. Rsdn+61k +1.9%. Nonres Bldgs+134k+3.7%. Nonbldg +29k+2.6%
Construction Volume AVG thru NOV Residential +2.9% Nonres Bldgs +3.3% Nonbldg +4.3%.
From 2012-2019, we added a yearly average 245,000 jobs/yr. In 2024 we added 226,000 jobs, but from 2021-2024, we added an average of 247,000 jobs/yr. We add the most jobs in Feb and Mar. We add the least jobs in Apr and Jun. We add more jobs, by far, in the 1st qtr. than any other qtr.
Don’t be surprised if 2025 construction jobs growth slows a bit. Jobs are slightly ahead of volume growth. Since 2019, both Jobs and Volume increased 10%. But that includes 2020, when volume increased 4% but jobs fell by 250k, or 3%. Over the period of 4 years 2021 thru 2024, Jobs increased 13%. Volume of work increased only 6%.
The unemployment rate in construction goes UP in the 1st qtr every year, by 2% to 3% (data since 2011). Now, your 1st thought may be, if unemployment is increasing, that is probably because jobs are falling. Well, construction has ADDED jobs in the 1st qtr. every year since 2011 (excluding 2020), by an avg of nearly 30% of all jobs added annually. More recently, since 2020, we’ve added almost 40% of total annual jobs in Q1. Construction unemployment is not going up in winter months because we lose jobs in winter. So how can the unemployment rate still go up? There’s only one number left in the equation. It goes up because the entire workforce increases by greater than the number of jobs added.
For an example of how this employment timing information can be useful see Employing Correlation – Using construction industry employment data as a proxy for flatbed demand
Harvard Joint Center for Housing Studies posted that In Texas, California, New Jersey, and the District of Columbia, immigrants make up more than half of construction trade workers.
Nov PPI for Construction Mtrls little changed from Oct Inputs YTD to Nonres +0.6%, to Rsdn +1.7%, to Hiway +0.6% Concrete products up 6%, Steel products down 7%-8%, Lumber/Plywood down 2%, Copper up 6%, Diesel down 14%. Final Demand YTD (all in) Nonres Bldgs all up 0.5% or less. Trades up 1%-2%.
We can’t always tell what affect changes in the cost of construction materials will have on the final outcome of annual construction inflation. PPI materials index does not account for productivity or margins and varies on stage of input. A good example of stage of input is PPI for Steel Mill Products. That does not include delivery from mill to fabricator, detailing, fabrication, shop painting, delivery to jobsite, shakeout, lifting, installation and finally overhead and profit, in all about 75% of the cost of structural steel installed.
Construction Analytics Nonres Building Cost Index is a weighted average of eight final cost indices.
NAHB estimates that $184 billion worth of goods were used in the construction of both new multifamily and single-family housing in 2023 and that $13 billon of those goods were imported. eyeonhousing.org/2024/12/impo…
Steel Statistics Cost Increase Effect on Construction? written 2016 US is world’s largest steel importer at 30MMT/yr. 50% from our top suppliers, Canada, Brazil, South Korea and Mexico. China supplies less than 2%. The U.S. annually imports about $2bil from Mexico.

One quarter of all annual Brussel Sprouts consumption occurs around the Christmas holiday.
Construction – More Thoughts Dec’24
The PPI data for November released 12-12. Nov PPI for Construction Materials shows very little change from Oct. Inputs YTD to Nonres are +0.6%, to Rsdn +1.7%, to Hiway +0.6%. Concrete products +6%, Steel products -7% to -8%, Lumber/Plywood -2%, Copper +6%, Diesel -14%. Material Inputs will contribute less than 1% to 2024 Inflation (1.7% for Rsdn) as shown in the Final Demand (Nonres) prices. Final Demand YTD (all in cost) to Nonres Bldgs shows all building types up +0.5% or less. Warehouses, and Industrial Bldgs show -0.1% to -0.25%. Concrete, Roofing and HVAC/Plumbing Trades are up +1% to +2%. Electrical trades are down slightly.
The economists watching residential permits and starts number of units are indicating current poor performance and are predicting a gloomy outlook for 2025. So far, the Dodge Construction Network, which tracks dollars starts, has residential starts up 7% year-to-date 2024, when compared to same 10 months 2023. Dodge is forecasting starts up next year. When I spread those starts out over time, the cashflow (spending) is stacking up pretty well at 7%/yr. There could be some downward changes to 2025 forecast due to immigration issues and tariffs.
I’ve been wondering, Should the duct tape be given as much value as the banana? Without the duct tape this whole banana art thing just doesn’t hold up.
Construction – Brief Thoughts Dec’24
Construction spending in 2024 will hit near $2.15 trillion, another new high, up 50%+ since 2019. (The last time constr spending declined was 2011. Construction volume, (spending minus inflation) will finish the year up only 10% since 2019.
Construction Spending for OCT is up 0.4% mo/mo. Aug & Sep rvsd up ~1%/mo, mostly Rsdn. Spending now essentially flat for last 4mo. YTD’24 vs YTD’23 now +7.2%, falling slightly as expected for last few mo, because spending was rapidly increasing in late months of 2023 and is flat in 2024.
Real Manufacturing Construction Starts over last 3yrs is just over $600bil, whereas normal starts without any influx of government investment would be about $300bil for the same 3yrs. Most of those starts were posted from Q3’22 thru Q4’23. By far the highest period of growth in new starts was the 2nd half 2022. About $100bil of that spending growth over the 3 years is inflation, leaving the remainder of about $200bil in excess (but welcome) spending growth attributed to government investment in new manufacturing facilities. Now some of these projects are ending or soon to end. My latest construction spending forecast for 2025 Nonresidential Bldgs is down 0.5%. But this decline is driven by projects ending in Manufacturing. Without Manufacturing, Nonresidential Buildings 2025 spending would be up 4%.
The same effect on spending by the tapering off of Manufacturing Bldgs ending will happen in Infrastructure spending due to the current increases in Highway/Bridge, only ending a few years later.
Construction jobs increased to 8.313 mil in NOV. Since SEP, last two months barely increased, only +12k jobs. But perhaps more important, hours worked, since SEP, decreased 0.75%, equiv of 60k jobs. However, ytd’24 vs ytd’23, jobs are up 2.9%, total hrs worked is up only 2.7%
The unemployment rate in construction goes UP in the 1st qtr every year, by 2% to 3% (data here since 2011). Now, your 1st thought is that if unemployment is increasing, that is probably because jobs are falling. Well, construction has ADDED jobs in the 1st qtr. every year since 2011, by an avg of 24% of all jobs added annually, and more recently by over 30% of total annual jobs. Construction unemployment is not going up in winter months because we lose jobs in winter. It goes up because the entire workforce increases by greater than the number of jobs added.
To properly inflation adjust the cost of construction, use a Final Cost Inflation Index. General construction cost and Input price indices that don’t track whole bldg final cost do not capture the full cost of escalation in construction.
Will vacant office space to residential conversions be the construction spending that ignites the 2025 fire? Residential is forecast now to spring ahead 8% in 1H’25, then hold steady thru 2H. If conversions jump, that percent goes up and we could see a shortage of residential labor. (not addressing deportations).
There are 870K construction jobs in TX. 500K are immigrants and 300K are undocumented.
Sweet potatoes should be steamed only just soft enough to slice (long way preferred) about 1/2″ thick, then griddle fried in butter and maple syrup until there is some blackening (important). This was my dad’s recipe. No other recipes are allowed.
The Manufacturing Spending Taper
11-21-24 My construction spending forecast for 2025 Nonresidential Bldgs is down 1.5%. But this decline is driven by projects ending in Manufacturing. In the last 3 yrs, there were $230bil Mnfg new starts, most in 2022, about $130bil above normal for 3yrs. Now some are ending. Without Mnfg, Nonres Bldgs 2025 spending would be up 4.5%. (This original article written 11-21-24)
(edit 4-15-25 only to update forecast. Mnfg data has not changed) Construction spending for 2025 Nonres Bldgs is forecast up 2.9%. Manufacturing is expected to fall 9%, from $233bil in 2024 to $212bil in 2025. Mnfg is forecast to drop to $174bil in 2026. Without Mnfg data, Nonres Bldgs 2025 spending would be forecast up 8.2% in 2025. Tariffs and/or recession would (will) lower this forecast.
Now, let me clarify. The spending I reference is Census PIP current$ spending. It doesn’t matter if we look at current$ or constant$ (inflation adjusted), by the end of 2025 spending on Mnfg bldgs will be down 25%. The new starts above are those reported by a firm that tracks construction starts. But, only about 40% of actual starts are captured in that number. Real Mnfg starts over last 3yrs is just over $600bil, whereas normal starts without any influx of government investment would be about $300bil/3yrs. Most of those starts were posted from Q3’22 thru 2023. By far the highest period of new starts was the 2nd half 2022. About $100bil of that spending growth over the 3 years is inflation, leaving the remainder of about $200bil in excess (but welcome) spending growth attributed to government investment.
Mnfg projects can have a longer spending curve (on average) than most nonres bldgs, so obviously end dates are pushed out further. The average spending for all nonres bldgs is spread out over a spending curve of approximately 20:50:30, where 20% of all the starts in the year gets spent in the year started, 50% in the 2nd year and 30% over the 3rd and 4th yr. The spending curve for Mnfg is more like 17:40:30:13. We will see declining spending from this pool that will impact total nonres bldgs spending at least for the next 2-3 years.
So while the outward appearance in the data may be that nonres spending in total is declining, in large part it may be due to mega-spending on mnfg bldgs tapering down upon completion, creating large, but normal, annual declines. This may have the effect of offsetting gains in other nonres bldgs markets. That influx of spending is unlikely to be repeated. So, as we see mnfg spending begin to taper off, we should not expect additional support from new mnfg starts. We should expect mnfg starts to return to a more normal growth rate.
edited 2-4-25 added next paragraph and following Mnfg spending plot
Whenever we get an unusually large increase in new construction starts and spending, the tapering off of those projects leads to a decline on the tail end of the timeline. Peak spending was near the midpoint of projects, so after that it’s all declining. Mnfg new starts peaked in 2022-2023. Here’s what the manufacturing spending taper may look like.

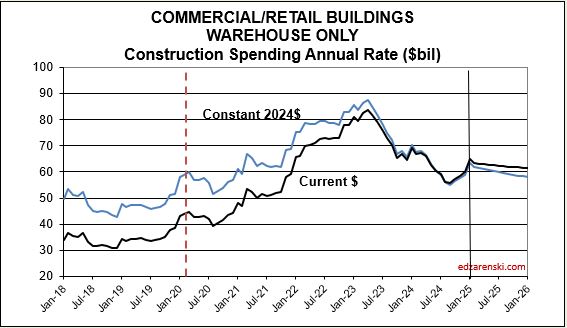
edited 4-11-25 added Warehouse Plot and text
This is exactly what happened in Warehouse spending. Warehouse contract starts began to rise in 2020, but rose rapidly in 2021 and 2022. Therefore, the rate of spending began to rise in late 2020, then rose substantially from late 2021 well into 2022, when project spending would have been expected to peak. New starts began to fall back in 2023 and more-so in 2024. Peak spending was reached in Q1 2023 and spending has fallen in 18 of the last 24 months. The current rate of spending is now back to the level of 2021.
This same scenario will occur in Highway/Bridge. Normal starts have consistently been about $100bil/yr, with slow growth. But for the last 3 years, actual starts were closer to $500bil for the 3 years. This strong growth in starts is expected to continue at least into 2025, totaling near $650bil for 4 years. Again, consider that part of that is inflation, but the remainder is government investment growth. So a decline from the taper back to normal for Highway/Bridge may not show up at least for the next few years. But once the taper begins it will have the same effect on Nonbldg Infrastructure spending that we will see from Mnfg in Nonres Bldgs.
If you know in advance what to expect, there should be no surprises when it occurs.

Construction Data JULY Briefs 9-5-24
Construction spending 2024 through July is still on track to finish the year up 7.7%. Residential is forecast up 8.5%, Nonresidential Buildings up 6.0% and Non-building up 8.9%.
We still have 3 or 4 more months of slightly declining construction spending, driven mostly by residential, but also by Manufacturing. This is not a long term trend. Sit tight. Oct or Nov, trend tuns back up. You can see the dip in this Current $ spending plot.


Construction spending total for 2024 expected up 7.7%. With inflation at a 4yr low (3%-4%), the amount of spending that is real volume growth is up this year, highest since 2016. It just edge out 2020.
I’m forecasting residential construction spending total for 2024 at $952b ,+8.5%. But three other indicators I calculate to compare to my forecast are telling me it could come in between $960b and $970b. I’m leaning towards higher, but I’d like to see Aug data, and Sept data.
And then there’s this. Census SAAR avg YTD (the average of the reported rsdn monthly SAAR for the 1st 7 months) is $939b. My YTD SAAR avg is $964b. Some down months will lower that slightly by year-end. .
Statistically, YTD spending through July for Rsdn and Nonres Bldgs is 57% of the total annual $ spent. This is indicating year-end total $ for residential will be $963b and $744b for Nonres Bldgs.
JOBS REPORT
Jobs are up by 34,000, 0.4%, in August, up by 80,000 in the last 4 mo., for a total up 1%/4mo. Year-to-date construction jobs are up 160,000 or 2%. Of those, 100,000 were for Nonresidential Buildings. Typical growth is 3.5%/year or about 250,000 to 300,000 jobs/year.

In this last month volume fell 1%. In the last 3 months, business volume fell 2.5%. Volume is falling and jobs are still increasing. There will be a slow patch for the next few months where volume will still fall another 1% to 2%. But jobs did not fall recently, and I don’t expect jobs to fall in the next few months.
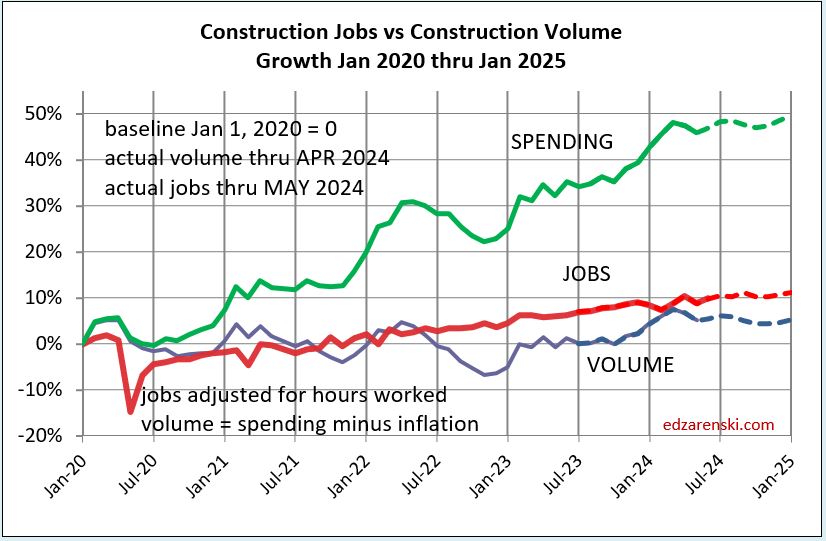
The plot above from Jan2020 to Jan2026 is just enlarged view from this plot below, which shows how consistent jobs growth has been over the last 14 years. After the 2020 dip, the slope of jobs growth is about the same as Jan2011-Jan2020.

These next three plots break out the major sectors.


Construction Data MAY Briefs 7-1-24
With the July 1 release every year, Census issues spending revisions to prior years, in this case to 2022 and 2023.
For 2022, Census added +$54bil (3%), mostly to Nonres Bldgs. The largest revisions in 2022 are Comm/Rtl +$10bil (+8%), Mnfg +$10bil (+8%), Power +$12bil (+11%).
For 2023, Census added +$44bil (+2%). The largest revisions are Comm/Rtl +$10bil (+7%), Amuse/Rec +$4bil (+11%) and Power +$12bil (+9%).
Along with 2022 and 2023, Census also revised Jan-Apr 2024. For the first four months of 2024, Census added +$14bil (2.2%), mostly to Residential +$7bil (+2.6%) and Power +$4bil (+8.4%).
Overall, total construction spending, including the May data for 2024, is now forecast +8.5% over 2023. With the upward revisions to Jan-Apr, Rsdn spending forecast is now +7.7% for 2024. Nonres Bldgs (+6.9%) and Nonbldg (12.7%) growth over 2023 is down from prior forecasts not because 2024 spending went down, but because 2023 revisions were higher.
Compare this forecast to the forecasts issued in July in the AIA Consensus Construction Forecast.

From 2012 to 2024, construction spending has been up every year, averaging +8.2%/year. It’s been as low as +4% and as high as +15% in that time. Well, after taking out inflation, construction volume of business really increased only on average +3.2%/year. The low years were +0.2% to -0.2%. The highs were 2014 and 2015 when volume increased +7% and +9%. All other years were +5% or lower. The table below shows the percent volume growth for recent history and forecast.

So far, through May, the inflation rate for all building types is much lower than most of the recent years. All inflation at this point is projected to finish 2024 between 3.5% and 5%. 2024 spending in constant$ will be the highest rate of volume growth since 2020. Keep in mind, the Constant$ in the table above (and in all the plots below) represents 2019$. If reported in 2024$, then 2024 would be constant and all total annual dollars would be higher. The percent Constant$ change from year to year would not change.


While the first 5 months of 2024 show no new highs for residential starts, the average of the first five months is higher than the average for 2023. Starts in 2022 still hold the highest monthly and highest annual average for residential starts.


The jobs plots below show a steady rate of growth in jobs before the spike down, as well as after. It’s just that the pattern was delayed for two years until jobs caught back up to where they were. Jobs move somewhat independent of the volume of work being put-in-place, at a very steady long term growth rate.
Since 2011, jobs have increased at an average of 3.3%/yr., several times reaching 4%/yr., seldom hitting 5%/yr. In the last 12 months jobs are up 3.6%. Year-to-date jobs are up 1.5% for the 1st six months.
This enlarges the 2020-2025 portion of the plot above. Volume growth has spent much of the last three years still lower than needed to balance with jobs growth, but has made rapid recent gains. But look at the Volume plot, down midyear in 21, 22 and 23. My data file shows the next 4-5 month, a stall in spending, but we are at all-time highs, (so, it doesn’t hurt much) then followed by 15 months of growth.


JOBS Year-to-date:
- Residential jobs are up 1.0%. Volume is up 6.4%
- Nonres Bldgs jobs are up 2.0%. Volume is up 1%.
- Non-Bldg jobs are up 1.4%. Volume is up 1.3%
- Total all construction jobs is up YTD 1.5%. Volume is up 3.3%
JOBS In the last 12 months and last 24 months:
- Residential jobs are up 2.6%. Volume is up 4.1%. Over two years, jobs are up 4.4% while volume is up 6.9%.
- Nonres Bldgs jobs are up 4.8%. Volume is up only 0.4%. But look back over two years and jobs are up 8% while volume is up 18%.
- Non-Building jobs are up 3.1%. Volume is up 2.9%. Over two years, jobs are up 6.9% while volume is up 12%.
JOBS Since the onset of the Pandemic (May 2024 compared to Dec 2019):
- Residential jobs are up 15.0%. Volume is up 13.4%
- Nonres Bldgs jobs are up 5.4%. Volume is up 10.6%.
- Non-Bldg jobs are up 6.0%. Volume is down 5.8%
- Total Construction Jobs are up 9.2%. Total Volume is up 7.6%.
Non-Bldg Infrastructure volume is forecast to increase 10% in the next 12 months. Nonresidential Bldgs volume expected to increase 1.7%. Residential expected to increase 1.0%. I expect total volume to increase by 4% to 4.5% in 2024, I expect total construction jobs to increase about 3.5% to 4% in 2024. Total jobs through June are up 1.5%.
Construction Analytics 1,000,000th view, Apr data Briefs 6-10-24
Updates to Forecast, spending, starts, inflation, jobs will follow next few days, so revisit this post for Apr data updates.
SEE ALSO Construction Analytics Outlook 2024
Today, 6-10-24, this blog recorded the 1,000,000 view. That doesn’t count scrolling from the home page, where a visitor might scroll down to read 3 or 4 articles, and there are 500 landings on the home page every week. So, the counter hit 1,000,000 but including scrolling, the actual total views could be higher. Nearly 500,000 people read on average 2.1 articles every visit. Inflation articles draw the most attention, with a read rate of about 1000 times a week on a slow week and 2,000 on a busy week.
Thank you to all my visitors, and to the 1,000,000th viewer. Keep reading! edz
April construction data update
Total construction spending for 2024 is forecast up 9%, down slightly since last update. Residential was reduced, expect now only +4%. Nothing else changed much. Nonres Bldgs forecast up 11%. Nonbuilding up 15%.
Jobs growth from May’23 thru May’24: Total Jobs +3.2%; Nonres Bldgs + 4.7%; Nonbldg Infra +3.6%; Residential +2.9%. In all cases most of the growth was in 2023.
Residential construction spending cash flows indicate a drop of 4% over the next 6 months, but then a slow steady climb of +10% in the following 12 months.
Nonresidential Buildings construction spending cash flows indicate we have settled in a temp flat top for the next 6 months, down 2% from the Feb’24 peak. Then we get a 5% annual rate of increase for the next two years.
Non-building Infrastructure cash flows are not showing any monthly pullback for the next two years. Spending adds 8% from now until year end and then adds 10% in 2025.

Baseline Spending Adjusted to Constant 2019$

Since the end of 2019, (in Dec 2019 spending hit $1,464T) total construction spending as of APR’24 is up 46%. The real Volume of Business is spending minus inflation. Inflation adds nothing to the volume of business. After inflation, Volume is up only 6%. Total jobs are up 9%.
Since the end of 2019, Residential volume is up 7%. Rsdn jobs are up 15%. Nonres Bldgs Volume is up 12%. Nonres Bldgs jobs are up 5%. Nonbuilding volume is down 8%. Nonbldg jobs are up 5%.
A follower commented to me they thought total adjusted spending would be higher. At the time, we were referencing Constant2019$. When we set base year to 2024, all other years would be compared in Constant2024$. All years would appear higher, but the percent change yr/yr would be the same. Here’s the same data as the table above, except the Index year has been changed to Constant 2024$.
Baseline Spending Adjusted to Constant 2024$

Nonresidential Bldgs volume (spending after adjusting for inflation), increased 28% in the last 18 months. Nonres Bldgs jobs increased only 7%, and hours worked (OT) did not increase. That leaves 21% of Nonres Bldgs volume that was put-in-place without a balancing increase in jobs. The added work got absorbed into the existing workforce. That’s a very hard fact left unexplained by the argument that there are jobs shortages. As one reader commented, there are some reasons why more $ value of work is counted at the jobsite with less jobs, i.e., prefab, but not 21% of all Nonres Bldgs work.
This plot below removes spending, shows a better scale comparison of Jobs to Volume.

The above plot is taken from this 2011-2025 plot below. Looking back to 2011 shows how consistent jobs and volume growth was from 2011 thru 2019. This plot shows Construction Jobs growth since mid-2020 occurring at the same slope (rate of growth) as 2011-2019. Construction jobs grow avg 3.5%/year, even if volume growth varies. The Pandemic set jobs growth back by almost 2 years.
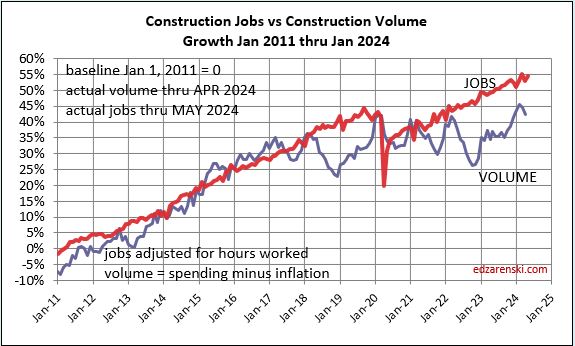
The next three plots Jobs vs Volume Growth, are set to zero start at Dec 2019. Last month, MAR data, I showed these same plots going back to start Jan 2011. Here’s a link to Mar data for those 2011 plots.
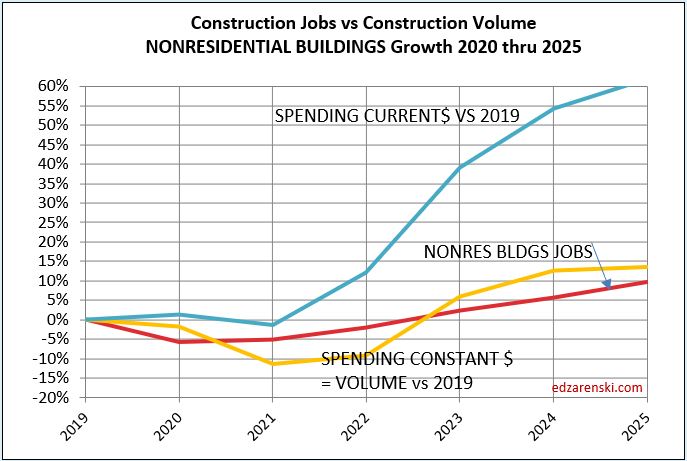

I’ve recently read comments on Twitter X that a slowdown in new residential starts is causing a drop in residential employment, and that leads a recession. Well, residential jobs are up 1% year-to-date, up 2.5% from May’23 to May’24, and right in line with average jobs growth since 2011. There is a slowdown in the rate of growth of constant $ volume. Although May starts are the lowest since November, that slowdown from May to December is only 3.5%. This may not be a big enough drop in volume to initiate a drop in jobs. We’ve seen other years (2018) where a small volume drop is not followed by a drop in jobs and never does the drop in jobs equal the magnitude of the drop in volume.

