Home » Posts tagged 'inflation' (Page 7)
Tag Archives: inflation
Construction Spending Nonres Bldgs on a Roll > What it Means for Inflation
This is clearly going to measure up as the breakout year for spending on nonresidential buildings. Growth year-to-date (YTD) is up 18.3%. We will finish the year with total growth up 17%. The last time we saw growth like this was 2007. In fact, 2007 is the only time % growth (and $ volume growth) was ever larger than this year.
Since last December I have been predicting a range from 14% to 20% growth in 2015 nonresidential buildings spending. It looks like we will finish the year right in the middle of that range.
By far the largest $ contribution comes from the growth in manufacturing buildings, up 50% and up $23bil YTD. Next closest is office buildings, up 22% and up $8.3bil YTD. Lodging, Commercial-Retail, Educational and Amusement-Recreation are each up approximately $4bil YTD, quite impressive for Lodging and Amusement-Rec since they both total only $17bil YTD.
Nonresidential buildings spending will maintain greater than 10% growth in 2016 something achieved only 5 times in 25 years. Next year, educational and healthcare buildings will both contribute strongly to the total annual growth. Manufacturing, Office and Lodging will all settle back but still maintain 10% or greater growth. Commercial-retail, which had 3 years of substantial growth from 2012 to 2014 adding nearly 50% spending growth during that time, will grow only 2-3% next year.
With last year, this year and next, nonresidential buildings spending will reach growth of 40% in three years, a growth rate exceeded only once in history, during the last construction boom from 2006 to 2008. Along with that boom in spending came the highest construction inflation ever recorded, an average inflation over 8% per year for 4 years. I expect we are headed there again.
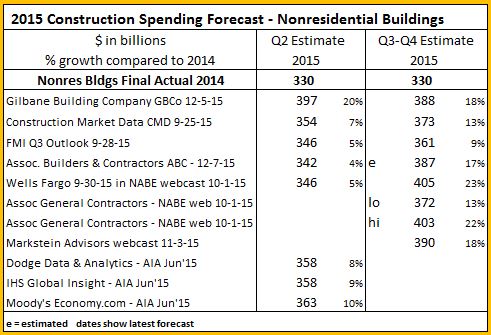
revised / updated table 12-9-15 to include ABC & BMarkstein forecasts.
Construction Spending – What You Need to Know About YTD Mo/Mo Yr/Yr
Common comparisons published in news reports for construction spending are, from best to worst:
- Current year-to-date vs same period previous year. YTD
- Current month vs previous month. Mo/Mo or MOM
- Current month vs same month last year. Yr/Yr or YOY
- Number of months to current value since last time that value achieved.
In some cases a comparison uses Not Seasonally Adjusted (NSA) dollars and in other cases Seasonally Adjusted Annual Rate (SAAR) dollars. NSA dollars is the actual amount spent within the month. SAAR dollars represents the annual rate that monthly amount would generate based on the normal proportion typical spent within that month. Typical spending is always much higher in summer months than winter to produce the same SAAR.
Year-to-date is the best comparison. It increases in strength as more months are added to the YTD. It is a value that gives a strong indication of growth over the previous year. Comparisons must be made using Not Seasonally Adjusted (NSA) dollars. Although it does lack adjustment for inflation, only one year of inflation is involved. Not adjusting for inflation is explained as the difference between current dollars and constant dollars.
Current month to month (MOM) comparisons are not generally affected by inflation but may not give a clear indication of movement due to monthly fluctuations. Comparisons absolutely must be made using Seasonally Adjusted Annual Rate (SAAR) dollars. It is a gross error to make month to month comparisons using NSA dollars, since there is a normal spending curve that shows the percent of total annual spending can vary considerably from month to month, sometimes by as much as 10%. This variation is accounted for in the SAAR.
When comparing to the same month last year (YOY), the question arises, “Is any big change in YOY caused by the current month performance or by the performance in the same month last year?” Again, YOY is missing adjustment for one year of inflation. Comparison can be NSA or SAAR dollars.
Number of months/years since current value was last achieved is almost always presented as a current dollar comparison. When dealing with cost, because of the long duration often involved it would be much better if it were a constant dollar comparison to account for construction inflation. However, construction inflation may not be readily available and this type of comparison is rarely if ever published using constant dollar comparisons. Comparison should use either entire year total dollars or should use SAAR dollars.

Current dollars = dollars are reported in the value of the year reported 2008=2008$, 2015 = 2015$. 99% of news reports use current dollars and therefore do not account for the influence of inflation.
Constant dollars = all dollars adjusted to represent dollars in the year of comparison. Adjusts for inflation so 2008$ in this case are converted to equivalent 2015$.
It’s not to hard to understand why we need to use constant dollars when you think of it in terms of buying products like food or heating oil. Today heating oil costs $1.90/gallon. In 2008 heating oil cost $3.50/gallon. So, with respect to oil, $350 in 2008 dollars is no different than $190 in 2015 dollars.
In addition to the Year-to-date growth values, here’s two more less common stats for looking at the same information.
Percent change from the last cycle high current$ (contant 2015$)
- Residential – Q1 2006 $390b vs $$680b -43% (-50%)
- Nonresidential Buildings – Q1 2008 $392b vs $$439b -11% (-22%)
- Nonbuilding Infrastructure – Q1 2008 $298b vs $$286b +4% (-10%)
Percent change from the recent recession low current$ (contant 2015$)
- Residential – Q1 2011 $390b vs $$239b +64% (+48%)
- Nonresidential Buildings – Q1 2011 $392b vs $$267b +49% (+35%)
- Nonbuilding Infrastructure – Q1 2008 $298b vs $$243b +22% (+13%)
Constant dollars makes a huge difference in the statistics. Just take a look at Nonresidential buildings. Current dollars would indicate we are now only 11% below the previous high and we’ve had growth of 49% from the recession low. Constant dollars adjusting for inflation shows we are still 22% below the previous cycle high and we’ve had growth of only 35% since the recession lows.
You can find a complete section providing constant dollar cost comparison in my quarterly report. Access the report through the Featured Economic Report tab at the top of this blog
Construction Inflation
LINK to most recent articles on inflation 2019
11-17-2015
( Also See 1-31-2016 comments and chart on inflation )
Over the last 24 months work volume has increased and short-term construction inflation has increased to more than double consumer inflation. It appears construction inflation is already advancing faster than and well ahead of consumer inflation, which supports that consumer inflation is not an indication of movements or magnitude of construction inflation.
It is always important to carry the proper value for cost inflation. Whether adjusting the cost of a recently built project to predict what it might cost to build a similar project in the near future or answering a client question “What will it cost if I delay my project start by one year?”, whether you carry the proper value for inflation (which can differ every year) can make or break your estimate.
- Long term construction cost inflation is normally about double consumer price inflation (CPI).
- Since 1993 but taking out 2 years of recession (-8%), the 20-year average inflation is 4.2%.
- Average long term (30 years) construction cost inflation is 3.5% even with any/all recession years included.
- In times of rapid construction spending growth, construction inflation averages about 8%.
- Although inflation is affected by labor and material costs, a large part of the change in inflation is due to change in contractors/suppliers margins.
- When construction volume increases rapidly, margins increase rapidly.
- Construction inflation can be very different from one major sector to the other and can vary from one market to another. It can even vary considerably from one material to another.
In the 5 years of rapid growth in spending for nonresidential buildings from 2004 through 2008, nonresidential buildings cost inflation totaled 39%, or averaged ~8% per year.
In the 6 years of spending during the residential construction boom from 2000 through 2005, residential building cost inflation totaled 47%, or averaged ~8% per year.
Neither the producer price index (PPI) for construction inputs nor the CPI are good indicators of total construction cost inflation.
Some construction cost indices include only the cost changes for a market basket of labor and materials and do not include any change for margins. Those indices are not a complete analysis of construction cost inflation.
Construction cost inflation must include all changes related to labor wages, productivity, materials cost, materials availability, equipment and finally contractors margins. Margins are affected by the volume growth of new work and demand for new buildings. So be sure to verify what is included in any cost index you reference for real construction cost inflation.
For the last three years residential construction inflation has averaged 5.7% and nonresidential buildings inflation has averaged 4.2%. Nonresidential buildings cost inflation has increased for five consecutive years. Both are likely to increase next year since anticipated volume in both sectors will grow next year.
In my construction spending data set, which goes back to 1993, there were six years with greater than 9% spending growth. By far the largest spending growth years were 2004 and 2005, 11.2% and 11.5%. We are about to repeat that historic level of spending growth. I am predicting 2015 will finish with growth of 11.6% and 2016 will experience 11% growth.
(8-12-16) 2015 finished at 10.6% because 2014 was revised up. Construction spending for 2016 will probably finish closer to 8%.
I expect historic levels of growth in spending will be accompanied by inflation relative to historic high growth periods. Don’t expect long term average inflation in high growth periods. Don’t be caught short in your construction cost budgets!
Graphic updated 1-8-16
The chart shows the low and high range of various independent nonresidential buildings construction actual cost indices. In 2015, the range of estimates was from 2% to 5%. The actual inflation came in at 4%. The plotted line is my result of where inflation actually ended up. A chart for residential construction would show much different values.
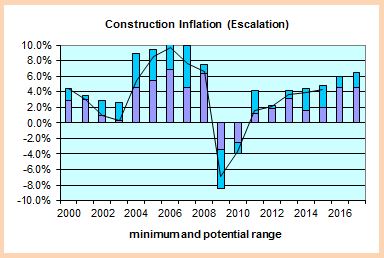
( Also See 1-31-2016 comments and chart on inflation )
