Home » 2017 (Page 6)
Yearly Archives: 2017
Are We at New Peak Construction Spending?
1-4-17
Total construction spending peaked in Q1 2006 at an annual rate of $1,222 billion. For the most recent three months it has averaged $1,172 billion. It is currently at a 10 1/2 year high at just 4% below peak spending. But that ignores inflation.
In constant inflation adjusted dollars spending is still 18% below the Q1 2006 peak.

Current headlines express exuberance that we are now at a 10 1/2 year high in construction spending but fail to address the fact that is comparing dollars that are not adjusted for inflation.
In the 1st quarter of 2006 total spending peaked at a annual rate of $1.2 billion and for the year 2006 spending totaled $1,167 billion. We are within a stone’s throw of reaching that monthly level and 2016 will reach a new all-time high total spending by a slim fraction. But all of that is measured in current dollars, dollars at the value of worth within that year, ignoring inflation.
Adjusting for inflation gives us a much different value. Inflation adjusted dollars are referred to as constant dollars or dollars all compared or measured in value in terms of the year to which we choose to compare. To be fair, we must now compare all backdated years of construction to constant dollars in 2016. What would those previous years be worth if they were valued in 2016 dollars?
By mid-2017 total construction spending will reach a new all-time high, but in constant inflation adjusted dollars will still be 17% below 2006 peak. We will not reach a new inflation adjusted high before 2020.
Residential construction spending is still 32% below the 2006 peak of $690 billion. In constant inflation adjusted dollars it is 39% below 2006 peak.
Nonresidential Buildings construction spending is only 3.5% below 2008 peak of $443 billion. However, in constant inflation adjusted dollars it is 18% below 2008 peak.
Non-building Infrastructure construction spending pre-recession peaked in 2008 at at an annual rate of $290 billion. However, post recession it peaked in Q1 2014 at $314 billion. It is now 8% below the 2014 peak. In constant inflation adjusted dollars it is 12% below the 2014 peak.
For more on inflation SEE Construction Cost Inflation – Midyear Report 2016
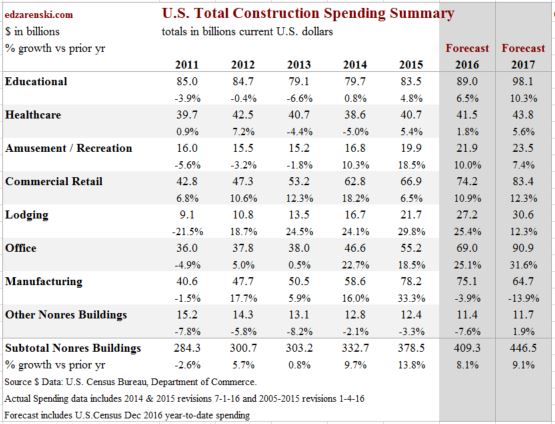
Nonresidential Bldgs Construction Spending 2017
1-4-17
This is a first pass at 2017 spending. It will be update in February when December starts and spending become available.
2-1-17 updated to include December data
Nonresidential Buildings spending for 2016 totaled $409 billion, UP 8.1% from 2015. Spending posted increases of 9.7% in 2014 and 13.8% in 2015.
Nonresidential Buildings spending in 2017 will increase to $447 billion, 9.1% over 2016. The most recent 3-month average seasonally adjusted annual rate (SAAR) is $420 billion, only 5.5% below the peak in 2008. By midyear 2017 the SAAR will reach a new all-time high. Office, Commercial, Lodging and Educational markets are all expected to post strong results over 10% growth in 2017.

Office building new starts through August were up only 6% year-to-date but starts in September as tracked by Dodge Data & Analytics reached the highest in years. 2016 starts finished at +37% providing the highest amount of work in backlog going back at least 8 years. Lodging starts in 2016 finished up nearly 40%, Healthcare up 20% and Amusement/Recreation up 35%.
Manufacturing – spending will finish down this year, $75 billion vs $78 billion in 2015, but both years are more than 30% higher than the next closest years, 2014 and 2009. Rather than labeling 2016 a down year, 2015-2016 should be described as an extended period of extremely strong spending. 2017 spending will drop the most since pre-recession to $65 billion but will still remain well above 2014. In 2005-2006, manufacturing was less than 10% of total spending in the nonresidential buildings sector. In 2015 it reached 21%. Today it is 18%. Manufacturing in some reports is referred to as Industrial.
Office – spending dropped more than 40% from $65 billion/year in 2007-2008 to $37 billion from 2010 to 2013. Since then it has increased every year by an average of more than 20%/year and is expected to continue that level of growth in 2017. New starts for office projects increased more than 30% in 2016. Office construction 2017 starting backlog (projects under contract as of Jan 1, 2017) is the highest in at least 8 years, more than double at the start of 2014 when the current growth cycle of office construction spending began. More importantly, the ratio of spending from starting backlog is also increasing for 2017. This is setting up a very strong spending growth pattern for the next 2 years. Office construction reached a new all-time high in September 2016. Spending will be in the range of +20% to +30% year over year growth for 2017 with total coming in at $91 billion. Office was more than 16% of total sector spending in 2006 through 2008 before dropping to 13% in the recession. Now at over 17%, it has been growing steadily for the last few years. In 2017 it will be 19% of total sector spending. Offices includes data centers.
Commercial/Retail – this market dropped from $90 billion in 2007 to $40 billion in 2010. It has been growing steadily since reaching bottom in early 2011, but has only recovered to an annual total rate of $78 billion. New starts in 2016 increased moderately. For 2017 spending remains in a tight range between $82 and $84 billion, with total 2017 growth coming in at just over +12%.
Lodging – this market recorded the largest drop of any, falling 75% from $36 billion in 2008 to $9 billion in 2011. However it recorded the strongest rebound of any market climbing 19% to 30% per year for the last 5 years. New starts in 2016 increased almost 40% setting up increased spending from starting backlog in 2017. In 2017, lodging will grow by 12% with a spending total of just over $30 billion. Lodging is still 2 years away from reaching previous highs. Lodging dropped to only 3% of total sector spending in 2011 but has rebounded to 7% in 2016.
Educational – previous highs of over $100 billion in both 2007 and 2008 are perhaps two years away. However, the rate of growth has been increasing slowly since 2014 from 1% to 4.8% to 6.5% annually. New starts have increased every year since 2012. Expect 2017 educational spending to increase by more than 10% to $98 billion. At peak, educational represented 30% of all nonresidential buildings spending. Now it’s only 22%.
Healthcare – this market has been very slow to recover, experiencing declines as recently as 2013 and 2014, hitting an 8 year low in 2014, when all other nonresidential building markets had already returned to growth. 2015 was a moderate growth year, up 5%, but 2016 increased less than 2%. Starts are indicating 5.6% growth to $44 billion for Healthcare spending in 2017. Healthcare has dropped from 14% to only 10% of all nonresidential buildings spending.
Amusement/Recreation – this market hit an 8 year low in 2013 but we’ve had 3 years of excellent growth of 10%/yr or more. 2017 is expected to increase 7.4% over 2016 to a total of $23 billion. This market is only 5%of nonresidential buildings spending.
Religious and Public Safety represent less than 3% of total nonresidential building spending. The religious bldg market has been declining since 2002 and is down 55%. Public Safety peaked in 2009 and has declined every year since, now down 40%.

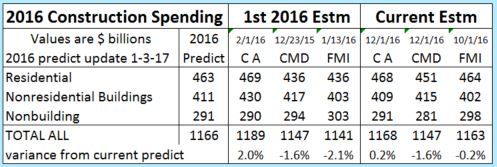
2016 Construction Spending 1-3-17
1-3-17
U. S. Census posted November construction spending 0.9% higher than October and 4.1% higher than November 2015. Year-to-date spending through November is 4.4% higher than 2015.
With only one month to go, 2016 is predicted to finish at $1,166 billion, up 4.8% from 2015. December spending is projected to come in at an annual rate near $1,200 billion. At this point, in order for total 2016 spending to drop below $1,160 billion, December would need to fall 6% below November, a magnitude of change that simply does not occur from month to month.
Current monthly spending is at a 10 year high and on a current dollar basis (before adjusting for inflation) is exceeded in all historical spending by only 5 months at the peak spending in early 2006. By the 2nd quarter of 2017 spending will reach all-time highs on a current dollar basis. On a constant dollar basis adjusted for inflation we are still several years below peak spending.
For inflation adjusted spending see “Are We at New Peak Construction Spending”
Revised spending for September is 1.25% higher than original posted on 11-1-16 and for October is -0.1% lower than original posted 12-1-16. However, October data is still pending revision again on 2-1-17 and is expected to increase. In the last 3 years every month has been revised up from the original amount posted. 2016 monthly revisions year-to-date average +1.3%.
The table included here shows the predicted total 2016 spending compared to 1st 2016 estimates and current 2016 estimates provided from my data = CA (Construction Analytics) and from CMD (ConstructConnect) and FMI.