Home » Backlog (Page 4)
Category Archives: Backlog
Infrastructure & Public Construction Spending
3-5-17
Infrastructure work does not normally grow in leaps and bounds.
Seldom does infrastructure construction spending grow by more than $10 billion in a year. Rarely does it grow by more than $20 billion.
Currently at about $300 billion a year, infrastructure represents only about 25% of all construction spending. The infrastructure sector is comprised of the longest duration type projects such as energy, highway/bridge, transportation terminals, railway and water/waste water resource development. It is not unusual for projects to take four to five years to reach completion.
Increasing new construction starts by $40 billion for new infrastructure work in any given year on average might add only $8 to $10 billion in spending in each of the next four or five years. To increase spending by $10 billion a year we would need to increase new starts by $40 billion every year. We’ve only ever come close to adding $40 billion in new starts once, in 2015.
In 2015, new infrastructure starts increased by $38 billion or 27%, due to an increase of $13 billion in new power generation plants and an increase of $21 billion in new LNG plants and port facilities. That will keep infrastructure spending growth elevated throughout 2018 and 2019. Measuring a total increase of 250% in power projects, that is a scenario unlikely to be duplicated in coming years.
2017 spending comes from: 10% 2014 starts; 35% 2015; 35% 2016 and 20% new starts in 2017.
Although new infrastructure starts were down in 2016 and are expected to decline again in 2017, the amount of work in backlog at the start of 2017 is the highest its ever been and spending in 2017 is forecast near the all-time (2015) high. Spending in 2018 from backlog will increase again and 2018 will hit another all-time high. There are no annual declines in spending predicted for the next four years. Some very large public infrastructure projects that started in 2014, 2015 and 2016 still contribute large amounts to spending in 2017 and well into 2018.
Increasing infrastructure spending by $10 billion a year would require adding about 35,000 to 40,000 new construction jobs per year. To accommodate all growth since the recession bottom, this sector averaged adding only 20,000 new jobs per year. Current spending growth is predicted to add $40 billion in work over the next three years and this will absorb all new heavy engineering jobs growth. The non-building infrastructure sector does not have the capacity at this time to increase spending by another $10 billion/year over its current growth rate, nor does it have the capacity to add an additional 40,000 jobs per year.
This summary of current projected spending does not include any future infrastructure work that might be generated from a proposed $1 trillion spending plan.
It is important to note here that 90% of all work in the power sector is private work. Only 60% of infrastructure work is publicly funded. However, some nonresidential building is publicly funded.

Public spending is not all public works projects.
Most public work is infrastructure, or public works projects. However, not all infrastructure is public work. The power market is the largest infrastructure market. But, already noted above, power work is mostly private. So the market responsible for one third of all infrastructure work is 90% private. Educational projects, typically considered nonresidential buildings, are 80% public and 20% private.

The two largest markets contributing to public spending are highway/bridge (32%) and educational (25%), together accounting for 57% of all public spending. The next largest market, transportation, is only about 10% of public spending.
Highway/bridge work fluctuates the most with large monthly swings up or down. However, 4 out of 5 times over the last 12 years, any large monthly move up or down was accompanied by a partially offsetting opposite move the following month. Highway spending hit an all-time high in 2015 and again in 2016.
Two of the three largest annual growth increases ever recorded in public spending were driven by educational spending. In the third largest growth year, highway just barely edged out educational spending for the top spot.
If educational work were to be considered part of future infrastructure expansion, then the maximum capacity to increase public infrastructure spending obviously increases. Together with other public works projects this could potentially provide a large enough market base to increase public infrastructure spending by $10 billion a year over and above the growth already in backlog or anticipated. But most of the added work would need to be to the education market. Even with potentially adding educational market work to the infrastructure expansion plan, the hope of expanding infrastructure spending by another $10 billion/year remains difficult at best.
Any increase to future work needs to be considered as over and above the spending growth patterns already due to work in backlog and new starts anticipated. This plot of predicted public spending does not include any future infrastructure work that might be generated from a proposed $1 trillion spending plan. About 80% of all spending in 2017 is already in backlog. About 50% of all the spending from Jan. 2018 through Jan. 2020 will already be in backlog by Jan. 2018.

The following article is an extension of this discussion Calls for Infrastructure Problematic
Office Buildings Lead 2017 Construction Spending
New construction starts in 2016 for Office Buildings is setting up a very strong spending growth pattern for the next 2 years.

The five largest metropolitan areas comprise more than one third of total national new starts in commercial-multifamily construction. Total commercial-multifamily starts are up 7%. Commercial starts alone are up 11%. New starts for office projects increased more than 30% in 2016. The following percentages are growth in starts for new Office Buildings. Reference Dodge Data & Analytics New Commercial and Multifamily Construction Starts.
- New York City-Northern NJ-Long Island -2%, but from 2015 that was up 138%
- Los Angeles-Long Beach-Santa Ana +67%
- Chicago-Naperville-Jolliet +22%
- Washington DC-Arlington-Alexandria +87%
- Dallas-Fort Worth-Arlington +31%
Office construction starting backlog for 2017 (projects under contract as of Jan 1, 2017) is the highest in at least 8 years, more than double at the start of 2014 when the current growth cycle of office construction spending began. Also, the share of spending in 2017 from starting backlog is increasing.
Office spending since 2013 has increased every year by an average of more than 20%/year and is expected to continue or exceed that rate of growth in 2017.
Office construction spending reached a new all-time high in September 2016. Growth in office buildings will lead all 2017 commercial construction spending. Spending will be near +30% year over year growth for 2017 with total expected to come in at $91 billion.
Regardless what market fundamentals change for 2017, this work is already under contract and will be the driving force for 2017 nonresidential buildings spending.
See Also these related articles
Nonresidential Bldgs 2017 Forecasts Vary
Nonresidential Bldgs Construction Spending 2017
Behind The Headlines – Construction Backlog
Behind The Headlines – Construction Backlog
1-16-17
tables updated 2-1-17
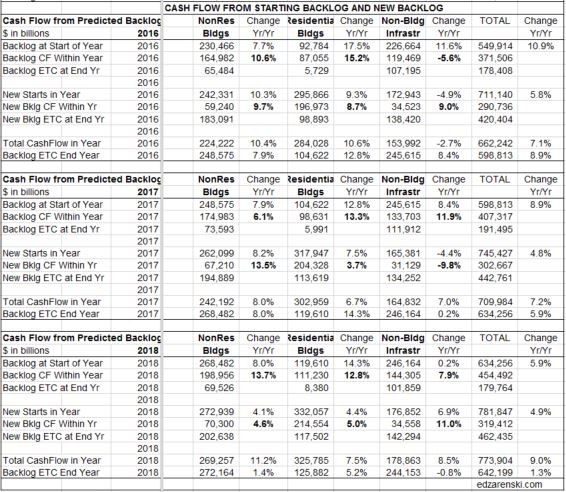
New Backlog is the total value of project revenues under contract that are about to start construction, or new starts. The entire value of a project is considered in backlog when the contract is signed. Projects booked in December 2016 or before are in backlog at the start of 2017. Simply referencing total backlog does not give a clear indication of spending within the next calendar year. Just because backlog is up going into a new year does not necessarily mean revenues will be up that year. You must understand some very important distinctions about backlog to determine how much revenue will occur within the next year.
Projects, from start to completion, can have significantly different duration. Whereas a residential home may have a duration of 8 or 9 months, an office building could have a duration of 18 to 24 months and a billion dollar infrastructure project could have a duration of 3 to 4 years.
Backlog at the start of 2017 could include revenues from projects that started last month or as long as several years ago. For a project that has a duration of several years, the amount in starting backlog at the beginning of 2017 is not the total backlog amount recorded for the project at its start date, but is the amount remaining to complete the project or the estimate to complete (ETC).
The only way to know how much of total backlog that will get spent in the current year and following years is to prepare an estimated cash flow from start to finish for all the projects that have started in backlog. Then add up the amounts from all projects in each month to find the cumulative cash flow in that month, or in that year.
Construction Starts provide the values entering backlog each month. Except for residential, new project starts within the year contribute a much smaller percentage to total spending in the first year than all the backlog ETC on the books at the start of the year. New residential projects contribute the most to spending within the year started because generally residential projects have the shortest duration. Residential projects started in the first quarter may reach completion before the year is over. New infrastructure projects generally have the longest duration and may contribute some share of project value to backlog spread over the next several years.
The distinction between backlog, backlog ETC and cumulative cash flow is necessary to predict spending. For example:
We start the year with $100 billion of residential projects in backlog and $100 billion of infrastructure projects in backlog. All of the residential projects could have durations of 12 months or less. Therefore residential spending could total $100 billion within the year. However, the infrastructure projects could have durations of 2 years, 3 years or 4 years. Spending from infrastructure backlog this year might total only $50 billion with $30 billion in spending occurring next year and $20 billion the following year. Although both sectors start the year with the same total amount in backlog, we can see the amount spent within the year is determined by the duration of the projects and the cash flow schedule.
Backlog totals may not be a good indicator of total revenue spending within the year. In fact, backlog could be up and total revenues for the year could end up lower than the previous year. Unless you have a clear picture of the types and duration of projects that make up the backlog, you will not have a clear picture of spending activity in the coming year.
See Also Construction Backlog 2017 3-21-2017
