Home » Residential (Page 3)
Category Archives: Residential
Construction Spending – Reports of It’s Death May Be Greatly Exaggerated
Is activity climbing or declining? Will costs go up or down? Will we have a winter slowdown? Where are the markets headed? I read an article this morning that stated “momentum is losing steam.” Is it?
I’ve been gathering Construction economic reports for comparison and I see some predictions for 2016 that frankly are only about what I’m predicting for 2015. To be fair, there are reliable predictions that indicate growth similar to what I predict. When data was available for two thirds or better of 2015 total activity there were still predictions for how specific markets would finish the year that varied by as much as 20% to 30%. In one instance the year-to-date actual through September has already exceeded the year end estimate from one firm. Surprising, once that much actual year-to-date information is in hand that there could be that much variation.
And how will markets perform in 2016? Here’s a few examples from a variety of sources; educational, healthcare, lodging and manufacturing all have more than one estimate for 2016 growth in the range of 0% to 4%, values that would not keep spending growth up with inflation, meaning volume would actually decline. My estimates for those markets are all 10% or higher. Variations of 10% to 15% in growth are common in the data.
So, here’s a few comments on predictions and on what to expect.
Unless something Earth-shattering happens, there is a select set of monthly data that statistically predicts the yearly outcome for total spending and market spending, within +/-1.5% for a smaller data set and within +/-1% for a slightly larger data set, but you have to wait longer to get that larger data set. It failed once in 14 years, by 1/2 of 1 percent. The same analysis can be performed individually for markets and sectors. The potential variance increases for some markets to about +/-3%.
The Dodge Momentum Index and the AIA Inquiries index are leading indicators to potential future work. They foretell activity in the Architectural Billings Index (ABI), which is a leading indicator to new construction starts. New starts provide the future cash flows for spending.
Spending in any given month is the sum of how much can be put-in-place generated by the cash flow from each of the project starts that got booked in the previous year or two, or three for long duration projects. For the next month the unknown amount is only about 3% or 5% that will be generated by new starts in the most recent 30 days. The remainder is already booked. Two months out the prediction includes 6% to 10% uncertainty, and so on.
Expect a winter slowdown. It’s not because of the weather. There may be additional repercussions if we experience severe weather, but the slowdown is predetermined because very large starts that got booked from a year to two years ago are reaching completion and dropping out of the monthly spending. Starts can be erratic. This causes periodic fluctuations in monthly spending. It’s normal.
Also what may not be apparent is what happens due to the difference in seasonally adjusted (SA) and not seasonally adjusted (NSA) values. Readers most often track the changes in SA values, but spending is generated from cash flow and cash flow is generated from the NSA values. Differences can be huge. As an example, August starts with an SA of $300bil produce 50% more actual NSA dollar volume to cash flow than February starts with an SA of $300bil. This may cause erratic spending patterns.
Residential spending will slow several percent to a low point in February before resuming upward momentum to finish the year stronger than 2015. Periods of low start volumes need to work their way thru the system and this produces growth patterns with periodic dips.
Nonresidential buildings will slow only moderately in the next few months before we see 15% growth through the middle of the year, only to see another slowdown late next year, leading into a considerably slower 2017. Office new construction starts in 2015 are up 50% from 3 years ago, educational up 25% over same period. Manufacturing starts are down 70% in 2015 and that is still at the second highest ever recorded. Total spending is still strong in 2016 at 10% growth. Major contributions appear from institutional work in educational and healthcare. Office and manufacturing still provide very strong support to growth.
Infrastructure projects spending will decline for the next six months due to the ending of massive projects that started 24 to 42 months ago. There will be large advances in spending midyear before we experience another slowdown later in 2016. I’m currently predicting spending will grow less than 2% in 2016, held down by a 10% drop in Power the second largest component of infrastructure work.
Mixed within the three sectors above are Private and Public spending. Residential is about 98% private and makes up about 50% of all private work. Along with manufacturing and large portions of power, commercial/retail, office and healthcare makes up nearly 90% of all private work. Private growth is the sum of the parts, predicted at 10%+ for 2016. Public work is all or a large portion of highway/street, educational, transportation and sewage/waste. Along with small contributions from water and a portion of power, these markets comprise 80% of all public work. Again, the sum of parts shows growth at 8% in 2016.
From the middle of Q1’16 to the end of Q3 we will register an annual growth rate of 20%, but due to the dips at the beginning and the end of the year total 2016 construction spending growth will come in at 11%. Construction spending momentum is not losing steam. We are seeing the affect of a few years of erratic growth patterns and a shift from commercial to institutional work.

Housing Starts > Look a Little Deeper
October housing starts released Nov. 18th didn’t come in as expected. The annual rate for October is 1,060,000 new starts vs 1,191,000 in September and 1,079,000 in October last year. BUT look a little deeper than just one month.
The last 4 months of starts have been pretty high, averaging 14% higher than the previous 4 months and 16% higher than the same 4 months last year.
Take a look at this chart. Monthly starts periodically peak and dip erratically. Look at February 2015, the biggest dip in 5 years. But then notice it took less than 4 months for starts to come right back to the trend line and the trend remained intact. This is how the monthly housing starts data goes.
So don’t get too alarmed over one month of data. Now if this downward trend were to continue for several months, go ahead get concerned, but that hasn’t been the pattern.

Claryifying Housing Starts Numbers
This can be a confusing set of housing numbers and I thought needs some clarification. Doesn’t help any that I misquoted my housing statistics in Joe’s interview. Here’s the correct numbers.
Joe Weisenthal interviews me on Bloomberg TV
New Housing Starts (# new units started) from U S Census.
- 2012 & 2013 up 28% & 18%. 2014 up 8.4%. 2015 expected up 12.6% and 2016 predicted up 15%.
- 2012 added 172,000 new units to total 781,000 for the year
- 2013 added 144,000 new units to total 925,000
- 2014 added 78,000 new units to total 1,003,000
- 2015 expect 127,000 new units to total 1,130,000
- 2016 predict 170,000 new units to total 1,300,000
It’s worth noting here that we would need to go back to 1992 to see another year where the number of new units started in the year exceeded 170,000 units. In the 1970s and early 1980s when total housing units started in a year were near two million units, we see growth years of 400,000 to 600,000 new units in a year. After 1984, only three times have we reached new starts over 170,000 unis in a year, 2012 being one of those years. I anticipate we will reach that mark again in 2016.

New Residential Construction Starts $ from Dodge Data.
- 2012 & 2013 up 32% & 27%. 2014 up 10%. 2015 expected up 16% and 2016 predicted up 16%.
In the following chart of Dodge residential Starts $ we can see the dollar volume of new residential starts stalled from about Q2 2013 through Q4 2013 and then again in early 2014. That slowed spending.

Construction Spending
- 2012 & 2013 up 13% & 19%. 2014 up <1%. 2015 expected up 13% and 2016 predicted up 18%.
The 2014 drop in spending is influenced by starts that occurred in the later half of 2013 and through 2014. New units starts monthly were low from May to September 2013 and then again in the 1st quarter of 2014. In the Housing Starts chart above, Jan. 2014 starts 3mo move avg are about the same as Jan 2013, showing the slowed growth. The result is spending dropped from Q4 2013 to Q3 2014. Since then new starts have resumed fairly strong growth and spending for 2015 is expected to finish up 16%. See the period from Aug’14 through Apr’15 when spending increase by 20% in 8 months. I think we will continue with 2016 repeating the same growth, although not without some dips in the monthly readings.

Speaking to Joe’s point on when does this affect GDP, we can see in these charts that the actual spending gets spread out over time, such that any slow down, or in more recent data any acceleration, gets reflected later in the spending numbers, perhaps over the next 9 to 12 months for residential work. Up to the current quarter where we see a dip in new $ volume of starts, prior to that we recorded 6 consecutive quarters of growth in starts. After a flat year in 2014 we are poised to see residential construction spending contribute 13% growth & represent 36% of total construction spending in 2015. For 2016 I expect similar growth at a very substantial pace up to 18% growth.
Residential Construction – Not All Data Tells The Same Story
The latest New Housing Starts numbers were released today. Residential growth is looking good and based on several inputs, I’m predicting an increase in residential construction spending next year. But let’s take a look at the variance you might get when looking at different data sets.
All the data below represents residential construction growth for the period from January 2011 until current, the last 4 years 8 months
New Construction Starts in $ (by Dodge Data Analytics) +19%/yr
New Housing Starts (number of new housing units) +20%/yr
Total Construction Spending +12.5%/yr
Volume (construction spending minus construction inflation) +7%/yr
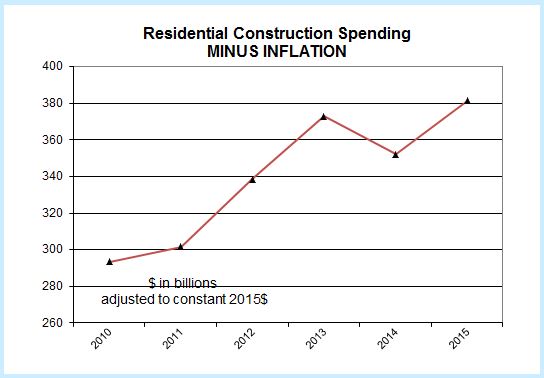
The obvious first question is why don’t all the data agree? Without a lot more information on housing that cannot be answered here, but there are a few reasons that can be considered as cause for variation;
- the average size of housing units being built
- the quality of the components built into the housing units
- the cost to the contractor for the materials used
- the cost of labor wages to build the housing unit
I’m sure there are other reasons to consider as this is not intended to be a complete list of what might cause variances between starts and spending, but it does highlight that starts does not give an exact indication of the growth in spending. There is a fairly consistent growth rate in starts of 20%/year and yet construction spending in current dollars has been growing at only 12.5%/year. Furthermore, a sizable portion of that spending growth is just for inflation. After inflation is taken out we see real construction volume in constant 2015$ has been growing at only 7%/year.
I don’t have an answer to explain these variances. I’m highlighting the data to show these variances exist and we can’t always rely on one data set exclusively. Perhaps this will initiate a discussion as to why these data vary by so much.

