Home » Spending (Page 7)
Category Archives: Spending

2018 Construction Spending – Briefs
1-26-18 updated 3-5-18
Dodge Data posted December construction starts on 1-25-18, showing total starts increased 3% from 2016. However, this compares unadjusted 2017 starts to upwardly revised 2016 starts. Starts are always revised upward in the following year. I expect revisions will show 2017 starts increased by more than 6% over 2016. January starts, released 2-22-18 dropped 2% from December, but Residential starts hit the highest SAAR$ in 11 years and total starts SAAR$ went over $725 billion for 6th time in the last year and the only times since 2007.
Total starting backlog for 2018, currently at an all-time high, has increased on average 10%/year the last three years. 80% of all Nonresidential spending within the year will be generated from projects in starting backlog.
Total All 2018 construction spending is projected to increase 8% to $1.330 trillion.

Spending measured in current 2018$ will reach an all-time high, however, measured more appropriately in constant inflation adjusted dollars, will still come in 14% below the 2005 high. When comparing inflation adjusted constant dollars, 2018 spending is still lower than all years from 1998 through 2007.
In constant inflation adjusted dollars, which more closely reflects volume, 2018 Infrastructure spending will reach a new high but nonresidential buildings is still 4-5 years away from a new high and residential spending is 6-8 years from a new high.
Read more about Constant Dollar Construction Growth

Non-building Infrastructure starts in 2017 are down 2%. However, we can expect post-year revisions to infrastructure starts. I expect, when all revisions are posted, that 2017 will show infrastructure starts increased a few percent from 2016. Starts peaked in 2015 and are still near that high-point. 2018 starting backlog is the highest ever, up 10%+ each of the last 3 years. Spending reached an all-time high in 2015 and stayed within 0.3% of that high for 2016. Although 2017 shows a spending drop of 3.6%, spending is also prone to large upward revisions, particularly in Power, the largest market in Infrastructure. Starting backlog is up 25% in the last two years. Spending for 2018 is projected to increase 8% to an all-time high.
Transportation terminals 2017 new starts jumped 120%. Rail project starts increased more than 100%. Starting backlog for all transportation work, including terminals, runways, rail and dock work is the highest ever, up 80% from 2017, up 100% in the last two years. Spending has been within few % of the 2015 all-time high for 4 years. Spending is projected to increase 20-25%/year for the next two years.
Power plant new starts are down for the 2nd year but had hit an all-time high in 2015, up nearly 150% from 2014. Pipeline starts were up more than 125% in each of the past two years. Starting backlog for all power projects has nearly doubled in the last three years. Spending is projected to increase 5% and 7% in 2018 and 2019.
Highway spending is not projected to change by much, up only 2% in 2018, but it has been within a few percent of the all-time high for the last three years. Backlog from new starts has increased on average 6%/year for the last four years.

Nonresidential Buildings new construction starts in 2017 are up 7%. When all revisions are in, I expect that to climb over to 10%. Total starts for the last 6 months are 10% higher than any time since 2007. Starts are up 60% in four years. 2018 starting backlog is the highest ever, 10% above 2008, up 15% from 2017. Spending for 2018 is projected to increase 8% to 9%.
Office new starts hit an all-time high in 2016 and just missed surpassing that mark in 2017. Starts increased on average 22%/year from 2013 through 2016, but 2017 starts dropped 2%. Starting backlog increased dramatically during that 2013-2016 growth period and backlog is up 50% in the last two years. Spending followed with three years of growth over 20%/year from 2014 through 2016. The 3% spending growth currently recorded for 2017 is an unexplained anomaly. All other data indicates 2017 spending should have followed the pattern set in 2014-2016. Spending in 2018 is forecast to climb 8% and 2019 could increase 12%.
Educational new starts hit an eight year high in 2016 and increased another 6% in 2017. Total new construction starts for the last 6 months are 13% higher than any other 6-month total since 2008. Starting backlog has increased 10%/year for the last three years. The last three years we’ve seen spending increases of 6%, 5% and 3%. For 2018, spending is projected to increase 14%, the strongest growth since 2007.
Healthcare starts jumped 13% in 2016, the first significant increase in nearly 10 years. 2017 starts maintained even level with 2016. Coming into 2018, starting backlog is up 16% over the past two years, a sign for slow moderate growth. 2017 is the first time in 5 years Healthcare spending increased, up 4.3%. For 2018, spending is projected to increase 4%.
Manufacturing posted several very large project starts in 2017, increasing total starts 20% over 2016. This increased starting backlog 8% for 2018. Although still well below the banner years of 2015 and 2016, spending is projected to increase 12% in 2018 and 10% in 2019.
Amusement/Recreation new starts increased only 5% in 2017, but that follows a 30% increase in 2016, to reach a new high in 2017. New construction starts for the last 6 months is the highest 6-month total new starts ever recorded, 1/3rd higher than any time in last 10 years. This will help drive Amuse/Rec spending to double digit growth next two years. Starting backlog has doubled from 2014 to 2018. Spending increased only 5% in 2017 but spending is up 40% in the last 3 years, also reaching a new high in 2017. Spending is forecast to increase 20% for 2018 and 15% in 2019.
This spending category includes sports stadiums which by some accounts may fall 40% in 2018, but that is hard to envision, considering the record new starts over the last 6 months. Sports stadiums is 1/3rd of Amuse/Rec so that would lower my forecast by about 10%. I’m sticking with my forecast.
Lodging experienced six consecutive years of massive growth in starts and spending after losing 75% of its pre-recession market. Starts grew 30%/year from 2011 through 2016. In 2017 starts posted a decline of 5%. Spending averaged 25% growth from 2012 through 2016, but posted only 7% growth in 2017. Backlog is still up slightly to start 2018. Spending is projected to come in at 8% growth for 2018. But backlog drops off 15% for 2019 and spending is expected to follow suit.
Commercial construction is being supported by new starts for warehouse construction which have increased seven consecutive years. In 2010 warehouse construction was only 20% of this market. From 2010, stores grew 50% to a peak in 2015, but warehouses grew 500% to peak in 2017 and are now 50% of the total market. Warehouses are increasing and stores are declining. In 2018, warehouses will make up 60% of the market. Total commercial starts for 2018 will remain equal to 2017 and 2016. The years of big backlog growth occurred from 2012 to 2017. Backlog remains constant from 2017 to 2018 and declines slightly in 2019. After 6 years of spending growth averaging more than 12%/year, spending will increase by only 4% in 2018 and 1% in 2019.

Public share of new construction starts are up only 10% in 3 years. But due to long duration job types, 2018 starting backlog is up 30% in the last 3 years. In 2018, 40% of all spending comes from jobs that started before 2017. Leading 2018 spending growth are Educational and Transportation with a combined total forecast 20% growth. Expect 2018 public spending to increase 6% to 8%, the best growth in 10 years.
Residential spending is more dependent on new starts within the most recent 12 months than on backlog from previous starts. New construction starts for January 2018 are the highest in 11 years. Total starts for the last 6 months are the highest since 2006. Residential starts in 2018 are projected to increase 7% over 2017, almost all of that coming from new single family starts. Residential spending in 2018 is projected to increase only 6% after five years of increases over 10%.
See also
In What Category is That Construction Cost? explains where some specific costs are carried, which may vary between sources. Take particular note of Transportation, Office and Commercial.
Starts Trends Construction Forecast Fall 2017 for a much more thorough handling of the starts forecast.
Indicators To Watch For 2018 Construction Spending?
Spending Summary Construction Forecast Fall 2017

Indicators To Watch For 2018 Construction Spending?
I’ve read several articles recently describing, Why 2018 could be a boom year for construction spending. Several reasons being given to support a potential boom, when we look a little deeper, actually may not be good indicators at all to predict the trend for a strong year in 2018. In my Fall Forecast I do predict 8% growth in 2018 construction spending, but let’s take a look at what gets us there.
Data that doesn’t tell us much about the future trend in construction spending.
Jobs increased in 2017 up 35% over 2016. In 2017 construction added 210,000 jobs, growth of 35% over 2016, but in 2016 jobs growth decreased by 55% from 2015. 2016 growth was the lowest in 5yrs. In 2013 jobs growth increased by 85% and in 2014 by 71%, but in 2015 and 2016 jobs growth slowed. Yet 2015 was one of the best construction spending years on record. And in 2017, jobs growth increased over 2016 but spending growth slowed. The direction of jobs growth is not an indicator of the future trend in spending.
Nov 2017 spending was higher than expected, and YTD is up 4.2%. This is a slippery slope. Actually we won’t know any particular monthly spending until several months after the initial release. All monthly spending values are subject to revision three times after initial release. However, residential spending is higher than expected for the YTD and nonresidential buildings spending is below expectations for YTD. But more importantly, construction spending normally fluctuates. For instance, in the 2nd half of 2015, spending was down 4 out of 6 months, lower than forecast three times, posting a total decline of 2.5%. Yet 2015 finished the year up 10%. Then, in the 1st half of 2016, spending was up 5 out of 6 months, far exceeding forecast 3 times, posting a total increase of 6% in 6 months. 2016 finished up 6.5% for the year. Neither half performance predicted final results within the year or the forecast for the future. Furthermore, after inflation, 2017 spending is currently flat with 2016$, so all we are seeing in the 4.5% spending growth in 2017 is inflation. Current and past spending is not an indicator of the future trend in spending.
What data does give an indication of the future trend in construction spending?
Construction Starts (Dodge Data & Analytics DDA), Backlog, Cash flow from Starts, the Architectural Billings Index (ABI), The Dodge Momentum Index (DMI) and New Residential Permits and # of Units Construction Starts all give an indication of the future trend in spending.
Residential Permits and # of new units started gives a fairly immediate indication of residential activity. The ABI gives an indication of nonresidential building to start construction about 9 months out and the DMI about 12 months out. The ABI and DMI give some indication as to whether future starts will increase or decrease. DDA Starts give an indication of the percent growth in future work, but not when the spending will occur, so cannot be used directly to predict spending. A good example is the new start for airport terminal work recorded as a new start in 2017 at $4 billion. But it may take 5 or 6 years to complete that $4 billion project and only cash flow will show the impact on spending.
Care must be taken to use Starts data properly. It is regularly misinterpreted in common industry forecasting articles. Starts dollar values represent a survey of about 50% to 60% of industry activity, therefore Starts dollar values cannot ever be used directly to indicate spending. Also, Starts do not directly indicate changes in spending per month or per year. Only by including an expected duration for all Starts and producing a forecast Cash Flow from Starts data can the expected pattern of spending be developed. Finally, it is the rate of change in Starts Cash Flows that gives an indication of the rate of change in spending.
Cash flow is the best indicator of how much and when spending will occur. Cash flow from DDA starts gives a prediction over time of how spending from each month of previous starts will occur from all projects in backlog. Cash flow totals of all jobs can vary considerably from month to month, are not only driven by new jobs starting but also old jobs ending, and are heavily dependent on the type, size and duration of jobs.

Of course, data highlighting demand, occupancy rates, labor and material trends and other economic factors affecting construction trends all weigh into determining future spending expectations. However, for nonresidential buildings and infrastructure approximately 75% to 80% of all spending within the year comes from starting backlog. Most economic factors that will have an affect on spending within the year are already captured in projects that have started and are in current backlog. On the other hand, new residential starts are more important. 70% of all residential spending in the year comes from new starts.
The following trend predictions are developed based on using this outline.
Starts Trends Construction Forecast Fall 2017

Spending Summary Construction Forecast Fall 2017
3-15-18 see also 2018 Construction Spending Forecast – Mar 2018
12-2-17
Summary
Total construction spending in 2017 will reach $1,236 billion, an increase of 4.2% over 2016. Residential spending is above 10% growth for the 5th consecutive year.
Year-to-date construction spending growth through October is 4.1%.
Residential leads construction spending growth in 2017 for the seventh consecutive year, up 10.6%. My Nonresidential Buildings forecast has been lowered since July but finishes the year up 2.8%. Only Non-building Infrastructure will not improve over 2016, down 3.7% for the year. However, Non-building Infrastructure has been at an all-time high for the previous two years.

This forecast is down slightly since July due to reductions in both nonresidential buildings and non-building infrastructure. Educational, Office, Power and Highway, four of the five largest markets which together make up half of all nonresidential spending, were all lowered. Some of these markets are prone to very large post-annual upward revisions and that has the potential to add to 2017 spending when those revisions are released in July 2018. In the July 2017 revisions, Power spending for 2016 was revised up by 10%.
History shows spending has been revised up 51 times in the last 55 months. I wouldn’t be surprised to see future revisions smooth out spending in unusually low periods (April and July) and increase total 2017 spending above this forecast. I suspect revisions in July 2018 may show 2017 spending as high as $1,250 billion. The average post-annual total spending revision for the last five years is +2.3%. The total revision to 2016 was only 2.2%.
None of the spending detailed in this analysis includes any projections of potential work from future infrastructure stimulus.
Total construction spending in 2018 is currently forecast to reach $1,334 billion, an increase of 8.0% over 2017. For the first time since pre-recession, Non-building Infrastructure will lead all spending with potential to increase by 10% growth over 2017.
Non-building Infrastructure is forecast to lead 2018 spending with an increase of 10.2% due to very large projects in Power and Transportation. Nonresidential Buildings growth is strong for 2018, forecast up 9.3%. Residential spending in 2018 slows to only 5.7% growth after six years averaging 13%/year.
Total spending will reach a new high in 2018 for the third consecutive year. However, in constant $ adjusted for inflation, spending is just back to the level of 2008. The all-time constant $ high was reached in 2005. Adjusted for inflation, 2018 will still be 12% below that level. At current rates of growth, we would not eclipse the previous high before 2022.

Growth of 8% in 2018 or $100 billion in construction spending demands a few words on jobs growth. Construction requires about 5000 workers for every added $1 billion in construction volume. Construction jobs have never increased by 500,000 in one year. However, $100 billion in added spending is not the same as $100 billion in volume, and jobs grow based on volume. Although spending will increase 8%, construction inflation has been hovering near 4.5% to 5% for the last five years. Real volume growth in 2018 after inflation is expected to be just over 3% or $40 billion. That would mean the need, if there are no changes in productivity, is to add about 200,000 additional workers in 2018, a rate of jobs growth that is well within reach since that is below the average jobs growth for the last seven years.
Residential Buildings Spending
Total Residential spending in 2017 will finish at $523 billion, up 10.6% from 2016. Residential spending is above 10% growth for the 5th consecutive year.
Residential spending was expected to dip between May and October due to a low volume of work contributed from starts cash flows. The actual data shows, after reaching a seasonally adjusted annual rate (saar) of $536 billion in March, the high for the year, spending dropped 3% to 4% to as low as $515 billion saar three times and has averaged only $520 billion saar from April through October. New starts in Q1’17 reached an 11-year high, so I expect the rate of spending to increase at year end. Residential work will close out the year with 10.6% growth, the 5th consecutive year over 10%. Average growth the last six years is 13%/year.
Residential spending is 50% single family, 13% multi-family and 37% improvements.
Residential Improvements has posted 18% growth year-to-date. Single Family spending is up 9% while multi-family is up only 4%. That is compared to 2016 when improvements for the year finished up 10%, SF up 4% and MF up 5%. Census does not include flood damage repairs in improvements but does include full flood damaged structure replacements in improvements.
Total residential spending in 2018 slows to a forecast of $553 billion, only 5.7% growth over 2017.
Due to the shorter duration of projects, nearly 70% of residential spending within the year is generated from new starts. Unlike Nonresidential, backlog does not contribute nearly as much to Residential spending within the year. New Residential starts in Q1’17 reached an 11-year high. Residential starts are at a post-recession high.
Residential spending will reach a 12-year high in 2018. Adjusted for inflation, all years from 1996 through 2007 were higher. Inflation adjusted spending is still 30% below the all-time high reached in 2005.

Nonresidential Buildings Spending
Total Nonresidential Buildings spending in 2017 will come in at $420 billion, up only 2.8% from 2016.
Commercial/Retail is expected to finish the year with +13% growth and Lodging +9%. An unexplained surprise was Office, which by early indicators was predicted to show large gains in spending. Two independent sources reported new office starts in 2016 up 25% to 30%. Starting backlog coming into 2017 was near or at an all-time high. Spending was forecast to jumped at least 20% in 2017. Instead, spending posted declines from May to September and is now forecast to finish with only a 4% gain. This market accounts for the single largest miss in my forecast posted in Feb 2017.
The only major nonresidential building in decline this year is Manufacturing. Manufacturing spending was expected to fall in 2017 after peaking in 2015 from massive growth in new starts in 2014. Spending stayed close to that level in 2016. Based on cash flows from starts, spending was expected to decline in 14 of the last 18 months. It declined in 11 of those months. We are at the point of turn-around with only one monthly decline predicted in the next three months and no spending declines expected next year. For 2017, Manufacturing new starts are up 35%.

Nonresidential Buildings starts in the six months from Aug 2016 to Jan 2017 posted the (then) highest amount of new starts since Jan-Jun 2008, also the year Nonresidential Buildings spending peaked. Then new starts in the six months Apr-Sep 2017 just surpassed both those previous peak highs.
Nonresidential Buildings 2018 starting backlog is 50% higher than at the start of 2014, the beginning of the current growth cycle. Starting backlog has increased for five years at an average 10%/year. Spending from starting backlog, up 10% in 2018, increased for five years at an average 9%/year.
Total nonresidential buildings spending in 2018 is forecast to reach $458 billion, an increase of 9.3% over 2017. Office, educational and manufacturing make up 70% of the growth.
Nonresidential Buildings will reach a new high for spending in 2018, surpassing the previous 2008 high. However, adjusted for inflation, spending is 18% below the all-time high reached in 2000.
Non-building Infrastructure Spending
Total non-building infrastructure spending in 2017 drops to $293 billion, down 3.7% from 2016.
Non-building Infrastructure spending, always the most volatile sector, dropped to yearly lows from June through September. Infrastructure construction spending in August dropped to the lowest since November 2014. However, this was predicted. Cash flow models of Infrastructure starts from the last several years show current dips in monthly spending are being caused by uneven project closeouts from projects that started several years ago.
Current backlog is at an all-time high and spending will follow the expected increased cash flows from the elevated backlog. Environmental Public Works (Sewage/Waste disposal down 16%, Water Supply down 9% and Conservation/Dams & Rivers down 7%) posted the largest declines in 2017 and accentuated the declines in the infrastructure sector. The sector is expected to increase slightly in the last quarter 2017. In recent months there are already substantial gains being posted in Conservation and Transportation.
No future growth is included from infrastructure stimulus and yet 2018 is projected to increase by 10%.

Total non-building infrastructure spending in 2018 is forecast to reach $324 billion, an increase of 10.5% over 2017. My forecast for 2018 is predicting every infrastructure market will post gains, but it is the Power and Transportation markets that account for almost all the growth in 2018. Transportation new starts in 2017 grew 120% due to massive new air terminal and rail projects. Spending growth in the Power market is not quite so apparent. Combined Power new starts are down for both 2016 and 2017, but the spending gains are coming from projects that started in 2015, a year in which starts were up over 120%.
Non-building Infrastructure will reach a new high for spending in 2018. This sector had posted a new high in 2015 and nearly equaled that in 2016. Adjusted for inflation, spending in 2018 will be nearly equal to the all-time highs reached in 2015 and 2016.

Public Spending
Total public spending for 2017 remains flat at $287 billion with most major public markets down for the year.
At midyear, I expected Educational and Highway to support a Public spending increase in 2017. Those gains did not materialize. A decline in Highway spending offset small gains in Educational. By far the largest Public spending decline is in Sewer and Waste Disposal, down 16%.
Public spending hit the low for the year in July. It increased for the last three months, most recently by an 11% increase in Public Educational spending in October. We are now near the high for the year and can expect to see another six months of growth before spending levels off in mid-2018.

When you see graphics that present Residential, Nonresidential and Public spending all on the same plot, they are not additive. Only Residential and Nonresidential can be added to reach total spending. Public is a subset of Nonresidential, composed partly of Nonresidential Buildings (~40%) and partly Non-building Infrastructure (~60%), with a slight amount of residential.
The two largest markets contributing to public spending are Highway/Bridge, 32% of total Public spending, and Educational, 25% of Public spending. The third largest market, Transportation, is only about 10% of Public spending. Environmental Public Works combined makes up almost 15% of public spending, but that consists of three markets, Sewage/Waste Water, which accounts for 8%, Water Supply and Conservation. Office, Healthcare, Public Safety and Amusement/Recreation each account for about 3%.
All of Highway/Bridge is Public spending. Only 80% of Educational spending is Public and only 70% of Transportation is Public. Environmental Public Works markets are 99% Public.

Total Public spending in 2018 is forecast to reach $305 billion, an increase of 6.3% over 2017. Public spending in 2018 will reach the highest year over year growth since 2008.
Educational and Transportation will contribute equally and together account for almost 60% of the Public spending growth in 2018. Transportation new starts in 2017 grew 120% due to massive new air terminal and rail projects. Educational new starts total for the last three months posted the highest quarter in at least seven years. The 2nd highest quarter was also within the last 12 months, so still contributes fully to 2018 spending. 2018 signifies a turn-round in Public spending which has not posted significant growth since the recession.
See this companion post for Starts Trends Construction Forecast Fall 2017 11-8-17
After New Starts, dollars are tracked in Backlog, Backlog Construction Forecast Fall 2017 11-10-17
For more on Jobs and Workload see Construction Jobs / Workload Balance 11-7-17
For effects of inflation see Constant Dollar Construction Growth 11-2-17

In Which Category is That Construction Cost?
Seldom do two sources present information the same way!
In the construction industry, a disconnect exists in the reporting of construction starts data and actual spending data. Problems may arise when data is used to perform comparisons or forecasts between starts and spending. New starts and backlog may be listed in one category and spending for the same markets may be listed in another.
Almost universally, reporting of actual construction spending data follows the U.S. Census Put-in-Place Spending format. I adjust all other construction starts input/forecasting data that I use to conform to these Census Construction Spending Put-in-Place definitions. Here are some pitfalls to be aware of:
The U.S. Census Construction Put-in-Place (Construction Spending) Release follows these definitions.
Residential spending $ includes about 35% renovations and improvements that has no units associated with the dollars, so that portion of $ should not be included in a comparison to housing starts.
In census spending, MF dormitories is in educational and all types of MF healthcare related homes are in healthcare.
Demolition is not included in renovations/improvements. Partial repair of flood damaged homes is NOT included in residential improvements. Full replacement of flood damaged homes is included as improvements, not new single family. Here is the US Census definition of flood repairs
Offices includes pubic buildings such as city halls and courthouses. Includes data centers and bank buildings. Excludes medical office buildings, offices at manufacturing sites and offices at educational or healthcare facilities. Excludes Public Safety.
Commercial includes all retail buildings, warehouses, parking lots and garages. Excludes parking at educational/healthcare facilities.
Census DOES separate the costs for buildings that are mixed use retail/office/residential.
Educational, along with K-12, includes administrative offices, health centers, parking, residence halls, classrooms, educational research labs, food service and sports/recreation facilities at schools or colleges and universities and all associated infrastructure and maintenance facilities at the educational site. Also includes public libraries, science centers and museums.
Healthcare includes similar support and infrastructure to educational. Also includes medical office buildings, non-manufacturing and non-educational research labs.
Amusement and Recreation includes performing arts centers, civic centers, convention centers, sports and recreation facilities not located at schools or colleges.
Transportation includes air freight and passenger air terminals, runways, bus and railroad passenger terminals, light rail and subway facilities, railroad track, railway structures and bridges, docks and marine terminals and maintenance facilities and infrastructure associated with each.
Some sources of design or new construction starts data carry terminal buildings as commercial buildings, institutional buildings or other public nonresidential buildings. Census caries the building cost of all terminals grouped in with the non-building infrastructure costs of Transportation. Some sources carry public buildings such as city halls and courthouses as Public Safety but Census carries cost data for public buildings such as city halls and courthouses in Offices. Some sources classify laboratories as commercial and warehouses as industrial/manufacturing but Census includes warehouses in Commercial and Labs, depending on use, can be either Educational, Healthcare or Manufacturing.
Dodge Data New Construction Starts
Dodge includes monthly New Construction Starts for Terminals and Courthouses in Other Institutional Buildings, a Nonresidential Buildings category. The Census actual spending report includes Terminals in Transportation and Courthouses in Offices.
Although all of these still remain in Non-building Infrastructure, Dodge includes Rail, Mass Transit, Airport Runway and Pipelines in Other Public Works. Although not often mentioned by Dodge, it is assumed Communications is also included in Other Public Works. Census includes all mass transit in Transportation, Communications is listed separately and pipelines are included in Power.
Dodge does not identify Renovations in their residential starts data. Census reports SF and MF spending and Total Residential spending with the difference between Total and SF+MF being Renovations. Multifamily spending accounts for less than 15% of all residential actual spending. Dodge MF starts account for 30% of all residential starts dollars. Furthermore, Dodge totals for MF starts $ for the last 7 years exceed the actual total of MF spending for the year by 30% to 50%. Dodge MF data represents more than just MF starts. Which may mean it includes renovations starts. It might also include student housing.
Constructconnect (CC) Construction Starts Forecast
New starts for Transportation Terminals is in a line by the same name but subtotaled in Commercial (Nonresidential Buildings) starts. Census includes Terminals in Transportation.
CC lists Courthouse starts subtotaled in Institutional. Census carries Courthouses in Office (Commercial).
CC lists Military as a line item subtotaled in Institutional. This might include Office, Housing, Warehouse, etc., which would be carried by Census in Office, Residential, Commercial, etc., respectively.
CC lists Laboratories (Schools & Industrial) together and subtotals all labs in Commercial. Census separates labs by commercial, research and educational and carries spending in Manufacturing, Healthcare or Educational respectively which would subtotal spending in Manufacturing (industrial), or Institutional (Healthcare and Educational).
CC does not list rail or transportation separately, but does list Airport and Misc Civil (Power,etc.). This leads me to think rail is included in the line item with Misc Civil (Power, etc.). Also, CC does not list Communication, which I suspect is included in Misc Civil (Power, etc.) Already noted above is that Terminals is subtotaled in Commercial. Census carries rail, runway and terminals in Transportation and keeps Communication and Power separate from others.
CC provides an alternate table of new starts data that corresponds to a proprietary software, INSIGHT. This table of starts data reshuffles categories very far from anything that would resemble Census spending output.
The AIA publishes a twice annual Consensus Construction Forecast, comparing forecast of Nonresidential Buildings spending using inputs from seven or eight firms. Every firm but one follows a similar organization. The difference is FMI includes both Transportation and Communications in Commercial Nonresidential Buildings. I’m not aware of another other firm that reports these two categories of spending as Nonresidential Buildings. Both are typically carried as Non-building Infrastructure. That these categories include costs for projects such as rail beds, rail right-of-way civil structures, loading platforms, airfield runways and support structures, communication transmission lines and cell towers supports the more standardized inclusion of these items in Infrastructure.
Similar discrepancies may exist when comparing starts or spending to indexes, such as the AIA Architectural Billings Index, which broadly classifies projects as commercial, institutional or residential. Some resources classify Amusement/Recreation as institutional and some as commercial. In particular, the shifting of costs between Nonresidential Buildings and Non-building Infrastructure creates a particularly meaningful disparity between spending forecasts.
As you can see, there are numerous instances where the data are often mixed up. From the point of view of the forecaster, initial input data cannot always be used directly to forecast or match spending output. Some manipulation of the data may be required to make input and output match.
As an example, I move the Dodge data starts for Terminals from nonresidential buildings to non-building infrastructure Transportation, so that really changes my totals from theirs for Nonresidential Buildings to Non-building Infrastructure. My spending output conforms with most all others, most of whom also follow the Census PIP definitions.
What does your source for data take into consideration? Know your data!

Ahead of the Sept Construction Spending Forecast
10-25-17
On November 1, September construction spending will be released. The September spending release is always a solid turning point for the 2017 forecast. Here’s a few facts leading into the forecast which will incorporate this data and be posted soon after the 11-1-17 spending release.
2017 construction spending will come in at $1,250 billion, up 5.5% from 2016.
Largest $ contributors to growth in 2017 spending: Residential $56b, Commercial Retail $12b, Office $6b.
Largest $ declines in 2017 spending: Manufacturing -$8b, Public Works -$6b.
Total construction spending averaged 8%/yr growth last 6 yrs (2014 & 2015 at 11%). Expect 6% in 2018, 5% in 2019
Construction spending on Infrastructure leads growth for the next 3 years and it has nothing to do with an infrastructure spending bill.
Infrastructure spending in 2018 is led by Power and Transportation markets.
Most of the 2018 spending in the Power market will be generated from starts in 2016. Equally strong 2017 starts will generate most of the Power spending in 2019.
Public construction spending in 2018 will reach highest yr/yr growth rate in over 10 years powered by Educational spending.
Commercial/Retail spending in 2018 slows but most other nonresidential buildings still show strong growth, especially Office and Educational.
Residential spending slows to a crawl after more than 100% growth in last 6 years. Currently predicting only 5% to 6% growth over next 2 years.
Residential spending may change during the year because, while spending in all other markets is dependent on starting backlog, residential spending is primarily dependent on new starts within the year
Largest $ contributors to growth in 2018 spending: Power $22b, Office $15b, Educational $10b, Transportation $5b.
Largest $ declines in 2018 spending: none greater than -$2b.
Nonresidential Buildings and Infrastructure construction will both hit new all-time highs for starting backlog in 2017 and 2018. Both will see a 9% increase in spending in 2018.

Infrastructure construction spending never dropped due to the recession as much as Nonresidential Buildings or Residential.
Nonres Bldgs dropped 35% from $438bil in 2008 to $284bil in 2011.
Residential dropped 60% from $630bil in 2005 to $252bil in both 2010 and 2011.
Infrastructure declined only 8% from $274bil in 2009 to $251bil in 2011. It rebounded to $305bil in 2015, a new high.
Nonres Bldgs spending is just 3% below the previous high but residential is still 16% below 2005.
In constant$, adjusted for inflation, Nonres Bldgs peaked at $537bil in 2000 and Residential peaked at $755bil in 2005.
Nonres Bldgs is still 21% below the inflation adjusted peak. Residential is still 30% below.
Infrastructure reached an inflation adjusted peak in 2009 at $300bil. It hit a new high in 2016 at $313bil and in currently down 6% from that high. It will set a another new high in 2018.

Watch for the new 2017-2018 Spending Forecast to be posted within the week after the September data is released 11-1-17.
These other recently posted articles also have information relative to the 2017-18 forecast
Is Infrastructure Construction Spending Near All-Time Lows?
Construction Starts and Spending Trends 2017-2018

So, About Those Posts “construction spending declines…”
You know those articles you’ve been seeing, “Worst year for construction spending since 2010″, well there’s some truth to that, BUT
2017 is the 6th year of the expansion. It has slowed, but… Here comes the BUT!
10-4-17 – Construction numbers are at all-time highs! Slowing or not, activity is very strong. Looking behind the headlines, here’s what we see;
Residential construction spending is slowing the most, from +11% in 2017 to only +2% in 2018 after six years averaging 13%/yr. Nonresidential buildings spending this year just kept up with the rate of inflation (4%), none-the-less, it’s at record highs. It doubles that rate of growth to 8% in 2018. Non-building infrastructure, down 2% in 2017, next year expect growth of 10%+, coming from long duration jobs.
The real performance numbers in Infrastructure are completely hidden. Spending was near flat for three years. But during that time, contrary to every other sector which experienced inflation of 15%, Non-building Infrastructure experienced deflation of 7%. (Gee, didn’t I read somewhere that activity within a sector is a primary driver of inflation?) Anyway, flat spending means volume really increased by 7% during that time. Spending by itself never tells the whole story!
There were some expected dips in spending recently, Manufacturing, Power, Highway, and there will be more in early 2018. BUT, there are also expected boosts in spending, Office, Commercial/Retail. Some of these already have matched up with the forecast, and there are more to come in 2018, Power, Transportation.
All Nonresidential Backlog is at record highs.

Buildings and Infrastructure will both hit new all-time highs for starting backlog in 2017 and again in 2018. For four years, from 2010 to 2013, all nonresidential backlog remained fairly constant. Since then, backlog for infrastructure is up 30% and for buildings it’s up 60%. (75% to 80% of nonresidential spending within the year comes from backlog at the start of the year. For residential, 70% of spending comes from new starts within the year.) Buildings will hit spending records in both 2017 and 2018. Infrastructure spending will hit a new high in 2018.
Ignoring for the moment that comparing any month to the same month last year can be grossly misleading as to the direction the markets are headed (for reasons explained in other recent posts on this blog), 2017 total spending growth is the lowest % yr/yr growth since 2011 (not 2010). Does that make it “worst”?
Spending will gain +5.6% in 2017, the least gain in six years. Last year was +6.5%, 2013 was +6.6%. The average for the last six years is +8%. So 2017 is the worst. Pretty damn good worst!

August Construction Spending 10-2-17
Data released 10-2-17
Preliminary Report August Construction Spending
August construction spending was posted today at $1.218 trillion, up 0.5% from the 1st revision to July.
- Residential spending is up 0.5% from July, up 12.3% YTD.
- Nonresidential Buildings spending is up 1.8% from July, up 4.5% YTD.
- Non-building Infrastructure is down 0.5% from July, down 3.4% YTD.
Year-to-date through August posted at $806 billion, up 4.7% from same period 2016.
What you should know – Revisions:
Since the bottom of the recession in January 2011, through June 2017 (78 months), spending vs the prior month was 1st reported down 42 times. Values were revised up 64 times, but not all months turned positive. After revisions, spending was down vs the prior month fewer than 20 times.
Monthly values are revised the next two months after initial release. Spending has been revised UP 15x in last 18 months. The average revision in following two months is +1.0%. This table shows the growth before and after revisions this year. Notice, spending was 1st reported down vs the prior month 5 times through June. After revisions spending is down only twice.

All values for the year are revised again in following May data report. The final revision has been UP 49 of the last 53 months. Average post-annual revision 2016 +2.2%; 2015 +4.3%; 2014 +4.4%. The average post-annual revision for the last 4 years is just over 3%.
Year-over-year and year-to-date comparisons of construction spending are generally understated by about 2% to 3% until the final revision of spending data is posted in May the following year.
Year-to-date construction spending through August is posted at $806 billion, up 4.7% from same period 2016. However, the post-annual revision has already been applied to all months in 2016. The same revision will not be applied to 2017 data until May 2018 data is published next year, so current YTD is always understated. Based on post-annual revisions for the last 4 years, adjustments range between +2% and +4%. The most recent six months has averaged +2.4%. So YTD 2017 spending will very likely increase and could be in the range of 6% to 8%.
Market Specific Revisions
Specific markets vary both higher and lower than the average revision. For example Power has been revised on average +10%, while Educational was revised less than 2%. Highway and Transportation revisions have averaged less than 1% over the last 18 months.
Construction Spending Revisions After 1st Release Through August Data:
Every month this year except April has been revised UP. The April data looks like such an anomaly (largest monthly decline since the recession) that I expect next May we will see April get revised up by +1% to +1.5%. July data gets revised next month and I expect to see an additional +1% to +1.5%.
- Total Construction UP 49 of last 53 months, avg 3.7%/mo.
- Total Construction UP 17 of last 19 months, avg 2.5%/mo.
- Residential revised UP 30 of last 31 months, avg 6.8%/mo.
- Residential UP 18 of 19 avg 3.6%/mo.
- Commercial UP 18 of 19 avg 5.7%
- Educational UP 13 of 19 avg 1.7%
- Power UP 19 of 19 avg 10.7%
- Commercial/Retail May +6.7%, June +3.8%, July +3.7%
- Lodging May +4.3%, June +0.2%, July +1.4%
- Educational May -0.7%, June +3.4%, July -1.8%
- Transportation May +3.5%, June +2.1%, July -1.8%
Spending Forecast
2017 construction spending is expected to reach $1,252 billion, up 5.6% from 2016. Average annual rate of spending will increase to $1,300 at year end. I wouldn’t be surprised to see future revisions to Mar-Apr-May spending smooth out that erratic period and add to total $ 2017.
In my forecast, I rely on the revision data by market to add a conservative adjustment for expected normal revisions.
My current Forecast has spending year-to-date through August up nearly 6% over 2016. Spending in the 2nd half 2017 will increase 1.5% to 2% over the 1st half 2017 and will increase more than 5% over the 2nd half 2016.
- All sectors have already hit spending lows for the year and will increase 4% to 8% over the next six months.
- Infrastructure will finish the year with totals down 2%, but the annual rate of spending could potentially increase 8% from July to year end. 2018 shows 11% growth.
- Nonresidential Buildings may finish up 5% in 2017, the sixth consecutive year of growth. For 2018 expect 8% growth.
- Residential spending will be up nearly 12% for 2017, the sixth year over 9%. Spending growth in 2018 slows to 2%.
- Backlog and the share of spending within the current year from that backlog is at an all-time high for nonresidential buildings and non-building infrastructure.
- Public work for 2017 will finish down 1.5%. By far the largest public spending declines are in Environmental Public Works, especially Sewer and Waste Disposal.
- Public spending is headed for a sizable rebound in 2018, up 9%.
- Every large Public category is forecast to show solid growth from the 4th qtr 2017 through all of 2018.
- This analysis does not include any spending projections from an infrastructure investment bill.
- Largest declines 2017; Manufacturing -11% ytd; Environmental Public Works -16% ytd.
- Largest increases 2017; Office +10% ytd; Commercial +16% ytd; Residential +13% ytd.

See this article Construction Starts and Spending Trends 2017-2018 for more on spending trends
Construction Starts and Spending Patterns
9-26-17
Construction Starts and Spending trends may not be apparent unless you look deep into the last few years of data.
Construction spending is strongly influenced by the pattern of continuing or ending cash flows from the previous two to three years of construction starts.
Current month/month, year/year or year-to-date trends in starts often do not indicate the immediate trend in spending.
Power market starts and spending provides a good example. Power starts peaked in 2015 at an all-time high, up 142% from 2014 and more than the prior two years combined. Yet Power spending was down 6% in 2015 and up only 3% in 2016. This happened because Power starts were also at an all-time high in 2012, just below the 2015 level, and those starts drove 2014 spending to an all-time high, but then tapered off in 2015. Those peak starts from 2015 will still be contributing spending for several years to come, long beyond typical jobs, and that drives up typical spending growth because it adds more than typical number of months that contribute spending.
Power starts dropped 11% in 2016 and continue to drop in 2017. Year-to-date and year over year comparisons to 2016 show Power starts down in all respects. For the 1st six months of 2017, Power starts are down four out of six months compared to same month in 2016 and year-to-date through June is down a total 20%.
Even though Power starts have been declining since the 2015 high point, Power had several periods with an exceptionally high value of new starts, some of these periods 2x to 3x the normal rate of growth and a year or two longer duration than typical; late 2014, Jan-May 2015, Feb-Jun 2016 and again in Feb-Jul 2017. When we have old, long duration jobs that are still contributing to monthly spending, spending goes up. A large share of the cash flow or monthly spending from all those exceptional starts will occur in 2018 and 2019. Those jobs will elevate Power spending 15% to 20% in 2018 and also in 2019.
- Pattern of cash flows from construction starts is indicating substantial acceleration in spending over next six months in all sectors, perhaps most notable in infrastructure.
- Infrastructure jobs from 2014 with longer than average duration will continue into 2018. These break the average balanced cycle of one month of old jobs ending for every new month of jobs starting. That will increase spending in 2018.
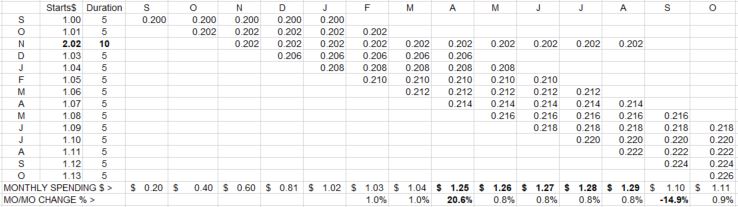
This simplified example shows what happens to monthly spending growth when a long duration job first influences spending past the typical duration and then when it ends. In the example here, starts grow at 1% per month and have a typical duration of 5 months. One month has an unusually large project start that will last for 10 months. A typical month of spending has cash flow from 5 months of starts, but the long duration project creates 6 months of cash flows for the period beyond typical duration.
Notice what happens and when it occurs. When the large project starts it has no unusual affect on spending. When it first extends beyond typical duration, it has a massive +20% growth effect on spending, even though starts had only been increasing at 1%/month for the previous 5 months. When it ends it has a similar downward effect, again, even though starts had been increasing at 1%/month.
Spending growth (or declines), both when an extra large job causes it to increase and then when the extra job ends, is almost entirely influenced by the long duration project, not by normal monthly starts growth rate.
2017 construction spending is expected to approach $1,250 billion, up 6% from 2016. Average annual rate of spending is going to increase 5% from $1,240 to $1,300 at year end. I wouldn’t be surprised to see future revisions to Mar-Apr-May spending smooth out that erratic period and add to total $ 2017.
- All sectors have already hit spending lows for the year and will increase 4% to 8% over the next six months.
- Infrastructure will finish the year with totals down 2% to 3%, but the annual rate of spending could potentially increase 8% from July to year end. 2018 shows 10% growth.
- Nonresidential Buildings are up 4% in 2017, the sixth consecutive year of growth. For 2018 expect 8% growth.
- Residential spending will be up more than 10% for 2017, the sixth year over 9%. Spending growth in 2018 slows to 5%.

2017 construction starts through August total $482 billion, down 1% compared to revised 2016. If 2017 gets revised as expected, even by only 4%, it will show +3% growth over 2016, but we won’t see that growth in the data until next year.
- Starts revisions for the period 2008-2015 averaged +5.8%/yr. For the period 2012-2015 revisions averaged +4.0%.
- The smallest revision to starts data since 2008 was +3.5%/yr. 2016 year-to-date through August revisions are +11%.
- Previous year starts are always revised upwards. Therefore, current year starts year-to-date growth is always understated.
- Starts have been increasing at an average rate of 11%/year for the last 5 years.
- After revisions, I expect 2017 will be the highest amount of new construction starts in 13 years.
Manufacturing spending was expected to fall in 2017 after peaking in 2015 from massive growth in new starts in 2014. However, a few months of exceptional 2015 starts will elevate 2018 spending and late 2016 starts will elevate 2019 spending.
Office spending, down slightly (temporarily) due to timing of completions from old jobs, is on track to reach 10% growth in 2017. Starts have been increasing since 2010 with the strongest growth period of new starts from Sept 2016 through June 2017. So, for the next 10 months we may see year/year comparisons negative, but that high volume of starts from Sept 2016 to June 2017 is going to elevate spending in 2018 and 2019.
Commercial spending early reports for June and July are both well below that predicted by starts cash flows and may be prone to substantial revisions. Commercial spending revisions have been up 17 of last 18 months an average of 6.0%/month. (10-2-17 Commercial spending was revised up by 4% for both June and July) Commercial starts have been increasing every year since 2010.
Educational has seen a slow but steady growth in new starts since 2012. Current dip in spending are not expected to continue. Cash flow from starts is indicating a steady climb in spending from now through the end of 2018.
Healthcare starts from 2015 are ending unevenly, rather than smoothly, causing temporary dips in spending. Growth resumes by Sept-Oct.
Transportation Terminal starts in the first three months of 2017 were more than three times higher than any three-month period in the previous five years. While this helped turn 2017 spending positive, 2017 is still affected by uneven starts from two to three years ago holding down gains in the 2nd half. Transportation will show only a 1% gain in 2017 but double digits gains in 2018. The high volume of 2017 starts has the most affect on 2019 spending.
Highway spending in 2018 will benefit from a scenario exactly as described above in the cash flow chart. Projects that started in 2015 but that have unusually long duration will contribute spending in 2018 beyond the duration that typical projects have ended. It is not recent new starts but old ongoing projects that will increase 2018 spending by 6%.
Public Works cash flow from starts has been indicating declines in spending since last summer. In fact, declines in public works spending (down 20% YTD in Sewage Waste Disposal) is the biggest drag on Infrastructure spending in 2017. However, now spending declines are expected to turn to growth in the 2nd half 2017 and continue growth through 2018.
(This analysis does not include any spending projections from an infrastructure investment bill).
See August Construction Spending 10-2-17 for more trends in spending.
See Starts Trends Construction Forecast Fall 2017 11-8-17 for updated trends in New Starts.
See Backlog Construction Forecast Fall 2017 11-5-17 for updated trend in Starting Backlog for 2018
Why Many Get Construction Spending Wrong
9-2-17
Construction spending for July was released yesterday, posted at $1.211 trillion, down 0.6% from an upwardly revised June. This is the sixth time in seven months of 2017 in which the initial release for monthly spending is down from the previous month. This is actually a very normal occurrence.
The 1st release of monthly spending vs the previous month has been down 15 times in the last 21 months. This may be what leads some analysts and pundits to write that construction spending is heading to recession. Nothing could be further from the truth!
For the last 21 months, in which 15 first reports showed a decline vs the previous month, 18 of the monthly values were revised up. After revisions, only five months remain down vs the previous month. Seven months are still pending further revisions, almost always up.
Construction spending is highly prone to revisions. After the 1st release it is revised each of the next two months and once again the following year. Spending has been revised UP 48 of the last 52 months, 92% of the time. The average upward revision for the last five years is +3.2%/month. In the last 52 months the upward revision averaged 3.7%.

Construction spending revisions after first release of data:
- Total Construction UP 48 of last 52 months, avg 3.7%/mo
- Total Construction UP 16 of last 18 months, avg 2.6%/mo
- Residential revised UP 29 of last 30 months, avg 7.0%/mo
- Residential UP 17 of 18 avg 3.8%/mo
- Commercial UP 17 of 18 avg 6.0%
- Educational UP 14 of 18 avg 2.2%
- Power UP 18 of 18 avg 12.0%
- Commercial/Retail May +3.9%, June +2.6%
- Lodging May +3.8%, June +1.1%
- Educational May +2.8%, June +3.6%
- Transportation May +3.6%, June +2.3%
January through May values have already been adjusted twice in these reports. June has one more revision next month and July gets revised twice. It’s quite likely both June and July values go up. All 2017 months still get one more revision next year when the May data is released (July 1). The post-annual total revision for the last 15 mo averages +2%, close to the long term average. First release values are ALWAYS being compared to previous values that have already been revised, 92% of the time UP. So first release values almost always understate performance. Since July 1st 2017, all 2016 monthly values have been revised three times so monthly releases this year starting with May have the most understated initial % comparison year-over-year because an un-adjusted release is being compared to a 3x-adjusted value.
When judging performance of monthly spending, it is reasonable to predict spending will get revised UP from the first release. Therefore, the most immediate monthly analysis you read, if based on initial release, 92% of the time is under-stating the performance of construction spending.
Construction spending forecasting not only must rely on performance year-to-date, but also on predictive analysis of how much revision there may be to current values. As an estimate, if monthly spending is initially posted as 2% down, 18/mo.averages indicate it will end up at least +2.6% higher after revisions, so would be a positive 0.6% growth month.
A few closing points:
Construction Spending 1st release for July is $1.211 trillion. Expect this to be revised up. YTD Jan-Jun revisions are UP 1.8%. Historical revisions last 5 years predict the final July value will be up 3% from the 1st release.
Construction Spending AVG 2017 Jan-Jul YTD ($1.226tr) has reached an all-time high. We’ve now posted three consecutive quarters of spending all averaging above $1.220 trillion. Spending is on track to total $1.250 trillion for 2017, up 5.5% over 2016.
Construction Spending avg YTD = $1.226tr, is up YTD 4.7% with revisions through May. Without revisions, the 1st releases would have averaged only $1.208tr, up only 3%.
Commercial Retail, Office and Residential lead 2017 construction spending gains, all over 10%. Office spending is at a record high.
After 5 months of stalled construction jobs growth, August added 28,000 jobs and put 2017 growth back on track towards 250,000 jobs. YTD is up 135,000. March thru July added only 19,000 construction jobs. Jan+Feb added 88,000, ending a six-month period, Sep16-Feb17, that added 167,000 jobs.
Harvey related jobs will be muted by jobs lost, I suspect for at least two months. There will be a period of slack records that will take some time to see the real effects of Harvey.
Further reading on this topic
June Construction Spending – What’s Up, or Down?
June Construction Spending – What’s Up, or Down?
8-2-17
Here’s some headlines this month on the June Construction Spending release: Plummets in June; Largest one month drop in 15 years; Clearly Decelerating; US Construction Spending Just Collapsed; and my personal favorite, Construction Spending Plummets to Economic Crisis Levels.
Frankly, I have much more trust in my data than to suggest we are at crisis levels.
In the latest Census construction spending report, June spending dropped 1.3% from May, but May was revised down -0.7%. The consensus of economists predicted spending would be up +0.5% (from the original May value), so the data posted is actually 2.5% below consensus estimates.
I expected May to get revised up 0.6% and the initial June release would be flat vs the revised May value. So the actual came in 2.6% below my expectation.
June construction spending was posted at $1.205 trillion, down 1.3% from May and down 2.7% from March. With the revised data, the May Year-to-date (YTD) vs 2016 was only +5.5% (not +6.1% as initially reported) and for June it’s now +4.8%.
My opinion is this preliminary June value appears suspect. This is sort of like driving a well maintained car that gets 30 mpg and all of a sudden the gauges indicate 20 mpg for the latest tankful of gas. Although the road may be a little bumpy, there does not seem to be any serious mechanical problems, so we have to ask, why did gas mileage drop so much?
The April decline and the Apr-May-June decline are the single largest monthly and 3-month total non-recessionary declines on record. We would need to look at recession data to find similar declines. Spending drops like this just don’t normally occur, especially when cash flow patterns from starts predict 4% growth during the 3-month period. That’s a 6.7% miss over 3 months.
The largest declines in the June Seasonally Adjusted Annual Rate (SAAR) construction spending were Highway and Educational, together 60% of the total monthly decline. (There are other markets with greater mo/mo% declines, however most of those markets have a very small share of the total spending so don’t amount to much). Almost all of the largest declines are public work. In fact, the initial June release shows every public market declined. However, all ten other public markets together don’t equal half of the declines generated by these two major markets. Furthermore, for the past 3 months Highway spending shows a decline of 12.5%, and Educational spending is down 7.6% in 4 months. A review of data back to 2005 shows neither of these markets have ever had any periods where they’ve experienced declines of this magnitude. These would be record declines if they stick. Market trend data simply is not indicating to expect record declines at this time. So I consider these data suspect.
Construction spending initial release is always preliminary data. The June value, released August 1st, will be revised in each of the next two reports and then once again next year when all 2017 data is reviewed. The average revision to June spending data over the last 4 years (similar growth years to current expectations) is +4.8%.

There are three more opportunities for revision to the June data and two more to the May data. We will have a much better idea what really happened on October 1st, but we won’t know the final outcome until the final 2017 revision on July 1, 2018.
So, what data seems to indicate a trend contrary to current declines? The last 12 months of Dodge Data new starts for nonresidential buildings are the highest since 2008 and they peaked from August to October. Residential starts, at their highest since 2006, peaked from December’16 to March’17. Backlog is at an all-time high. There is no indication here that spending will plummet.
Also, one month of Educational or Highway new starts each generate about $250 to $300 million per month in spending, for the next 24 to 36 months. Normally, with some variation, we have the current month of new starts coming into backlog and one month of old starts ending. Since starts have been normal or high recently, the spending declines posted in June would imply that we’ve lost two to three months of backlog from current spending. Again, there are no indications that we have an extreme imbalance or a canceling of backlog.
Most of the nonresidential spending occurring right now is from projects that started between mid 2015 and the end of 2016. Nonresidential buildings projects that started in 2015 or earlier still make up one third of the spending in the 1st half of 2017. Non-building infrastructure projects that started in 2015 and earlier contributed 50% of spending in the 1st half of 2017. Residential projects have shorter duration so most spending is from more recent jobs, but we hit a 10 year peak in new residential starts just a few months ago. All sectors have fluctuations in spending and have down months but the index of long term cash flows out to completion shows normal backlog and spending growth across every sector.

I’m inclined to expect substantial upward revisions to June construction spending in the next two releases. No other data supports a big June drop.
Keep in mind, current construction spending is always being compared to previous months revised spending and growth is almost always being understated. Monthly spending has been revised UP 45 times in the last 48 months. All previous months and all 2016 data have been revised several times. The average revision to ALL spending data over the last 4 years is +3.9%/month. Since January 2016, the average revision is +3.0%/month. The average revision to June spending data over the last 4 years is +4.8%.
June data is un-adjusted preliminary data. Many of the news articles declaring construction spending was a miss are based on this preliminary data which very often gets revised away in following months. For example, The 1st 6 months of 2016 have already been revised up, three times each, by a total of 2.5%. All the months YTD in 2017 still have pending revisions. June 2017 vs June 2016 shows a percent growth of only +1.6%, but June 2016 has already been revised up by 4.7% and June 2017 has not yet been revised at all. June 2017 has a 90% chance of being revised up.
I predict after all the revision are in we will see that June spending did not drop to a low of $1.205 trillion, but that it was closer to $1.250 trillion.
