1-26-18 updated 3-5-18
Dodge Data posted December construction starts on 1-25-18, showing total starts increased 3% from 2016. However, this compares unadjusted 2017 starts to upwardly revised 2016 starts. Starts are always revised upward in the following year. I expect revisions will show 2017 starts increased by more than 6% over 2016. January starts, released 2-22-18 dropped 2% from December, but Residential starts hit the highest SAAR$ in 11 years and total starts SAAR$ went over $725 billion for 6th time in the last year and the only times since 2007.
Total starting backlog for 2018, currently at an all-time high, has increased on average 10%/year the last three years. 80% of all Nonresidential spending within the year will be generated from projects in starting backlog.
Total All 2018 construction spending is projected to increase 8% to $1.330 trillion.

Spending measured in current 2018$ will reach an all-time high, however, measured more appropriately in constant inflation adjusted dollars, will still come in 14% below the 2005 high. When comparing inflation adjusted constant dollars, 2018 spending is still lower than all years from 1998 through 2007.
In constant inflation adjusted dollars, which more closely reflects volume, 2018 Infrastructure spending will reach a new high but nonresidential buildings is still 4-5 years away from a new high and residential spending is 6-8 years from a new high.
Read more about Constant Dollar Construction Growth

Non-building Infrastructure starts in 2017 are down 2%. However, we can expect post-year revisions to infrastructure starts. I expect, when all revisions are posted, that 2017 will show infrastructure starts increased a few percent from 2016. Starts peaked in 2015 and are still near that high-point. 2018 starting backlog is the highest ever, up 10%+ each of the last 3 years. Spending reached an all-time high in 2015 and stayed within 0.3% of that high for 2016. Although 2017 shows a spending drop of 3.6%, spending is also prone to large upward revisions, particularly in Power, the largest market in Infrastructure. Starting backlog is up 25% in the last two years. Spending for 2018 is projected to increase 8% to an all-time high.
Transportation terminals 2017 new starts jumped 120%. Rail project starts increased more than 100%. Starting backlog for all transportation work, including terminals, runways, rail and dock work is the highest ever, up 80% from 2017, up 100% in the last two years. Spending has been within few % of the 2015 all-time high for 4 years. Spending is projected to increase 20-25%/year for the next two years.
Power plant new starts are down for the 2nd year but had hit an all-time high in 2015, up nearly 150% from 2014. Pipeline starts were up more than 125% in each of the past two years. Starting backlog for all power projects has nearly doubled in the last three years. Spending is projected to increase 5% and 7% in 2018 and 2019.
Highway spending is not projected to change by much, up only 2% in 2018, but it has been within a few percent of the all-time high for the last three years. Backlog from new starts has increased on average 6%/year for the last four years.

Nonresidential Buildings new construction starts in 2017 are up 7%. When all revisions are in, I expect that to climb over to 10%. Total starts for the last 6 months are 10% higher than any time since 2007. Starts are up 60% in four years. 2018 starting backlog is the highest ever, 10% above 2008, up 15% from 2017. Spending for 2018 is projected to increase 8% to 9%.
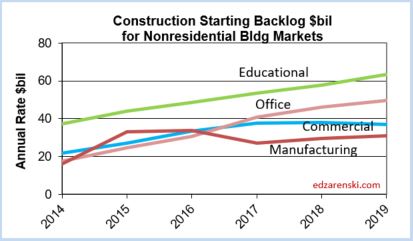
Office new starts hit an all-time high in 2016 and just missed surpassing that mark in 2017. Starts increased on average 22%/year from 2013 through 2016, but 2017 starts dropped 2%. Starting backlog increased dramatically during that 2013-2016 growth period and backlog is up 50% in the last two years. Spending followed with three years of growth over 20%/year from 2014 through 2016. The 3% spending growth currently recorded for 2017 is an unexplained anomaly. All other data indicates 2017 spending should have followed the pattern set in 2014-2016. Spending in 2018 is forecast to climb 8% and 2019 could increase 12%.
Educational new starts hit an eight year high in 2016 and increased another 6% in 2017. Total new construction starts for the last 6 months are 13% higher than any other 6-month total since 2008. Starting backlog has increased 10%/year for the last three years. The last three years we’ve seen spending increases of 6%, 5% and 3%. For 2018, spending is projected to increase 14%, the strongest growth since 2007.
Healthcare starts jumped 13% in 2016, the first significant increase in nearly 10 years. 2017 starts maintained even level with 2016. Coming into 2018, starting backlog is up 16% over the past two years, a sign for slow moderate growth. 2017 is the first time in 5 years Healthcare spending increased, up 4.3%. For 2018, spending is projected to increase 4%.
Manufacturing posted several very large project starts in 2017, increasing total starts 20% over 2016. This increased starting backlog 8% for 2018. Although still well below the banner years of 2015 and 2016, spending is projected to increase 12% in 2018 and 10% in 2019.
Amusement/Recreation new starts increased only 5% in 2017, but that follows a 30% increase in 2016, to reach a new high in 2017. New construction starts for the last 6 months is the highest 6-month total new starts ever recorded, 1/3rd higher than any time in last 10 years. This will help drive Amuse/Rec spending to double digit growth next two years. Starting backlog has doubled from 2014 to 2018. Spending increased only 5% in 2017 but spending is up 40% in the last 3 years, also reaching a new high in 2017. Spending is forecast to increase 20% for 2018 and 15% in 2019.
This spending category includes sports stadiums which by some accounts may fall 40% in 2018, but that is hard to envision, considering the record new starts over the last 6 months. Sports stadiums is 1/3rd of Amuse/Rec so that would lower my forecast by about 10%. I’m sticking with my forecast.
Lodging experienced six consecutive years of massive growth in starts and spending after losing 75% of its pre-recession market. Starts grew 30%/year from 2011 through 2016. In 2017 starts posted a decline of 5%. Spending averaged 25% growth from 2012 through 2016, but posted only 7% growth in 2017. Backlog is still up slightly to start 2018. Spending is projected to come in at 8% growth for 2018. But backlog drops off 15% for 2019 and spending is expected to follow suit.
Commercial construction is being supported by new starts for warehouse construction which have increased seven consecutive years. In 2010 warehouse construction was only 20% of this market. From 2010, stores grew 50% to a peak in 2015, but warehouses grew 500% to peak in 2017 and are now 50% of the total market. Warehouses are increasing and stores are declining. In 2018, warehouses will make up 60% of the market. Total commercial starts for 2018 will remain equal to 2017 and 2016. The years of big backlog growth occurred from 2012 to 2017. Backlog remains constant from 2017 to 2018 and declines slightly in 2019. After 6 years of spending growth averaging more than 12%/year, spending will increase by only 4% in 2018 and 1% in 2019.
Public share of new construction starts are up only 10% in 3 years. But due to long duration job types, 2018 starting backlog is up 30% in the last 3 years. In 2018, 40% of all spending comes from jobs that started before 2017. Leading 2018 spending growth are Educational and Transportation with a combined total forecast 20% growth. Expect 2018 public spending to increase 6% to 8%, the best growth in 10 years.
Residential spending is more dependent on new starts within the most recent 12 months than on backlog from previous starts. New construction starts for January 2018 are the highest in 11 years. Total starts for the last 6 months are the highest since 2006. Residential starts in 2018 are projected to increase 7% over 2017, almost all of that coming from new single family starts. Residential spending in 2018 is projected to increase only 6% after five years of increases over 10%.
See also
In What Category is That Construction Cost? explains where some specific costs are carried, which may vary between sources. Take particular note of Transportation, Office and Commercial.
Starts Trends Construction Forecast Fall 2017 for a much more thorough handling of the starts forecast.
Indicators To Watch For 2018 Construction Spending?
Spending Summary Construction Forecast Fall 2017
