Home » 2016 (Page 4)
Yearly Archives: 2016

Residential Work Flow From Housing Starts
Housing starts can be erratic. It’s not unusual to see monthly housing starts fluctuate up or down by 10%, sometimes 20%. But what affect does this have on the flow of housing work? Not as much as you might think.
Although housing starts is in units, not dollars, we can create a “cash flow” to see how the new starts generate activity over future months. To see the flow of work I’ve created a simple time flow of starts to show the activity generated for new housing starts.
About 2/3rds of housing starts are single family units. These might have a construction duration ranging from 6 to 9 months. The remaining 1/3rd of starts are multifamily units. Those could have construction duration of anywhere from 8 months to 16 months and in some cases longer. For this simple analysis I’ve used a work flow duration of 2/3rds at 7 months and 1/3rd at 17 months. Varying the duration longer or shorter by a few months will not have a big effect on the outcome. It changes the slope of the growth rate but does not change the consistency of the growth pattern.
A time flow of housing starts shows growth rates of; 2013 +13%; 2014 +10%; 2015+12%. Actual construction spending shows growth of 2013 +19%; 2014 +14%; 2015+13%.
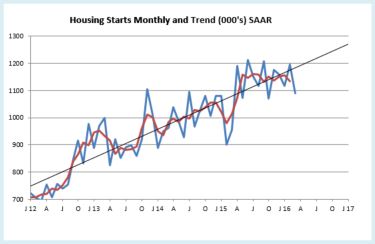
The chart above, “Housing Starts Monthly and Trend” shows the actual monthly starts values and a three month moving average. Monthly starts periodically peak and dip erratically. Look at February 2015, the biggest dip in 5 years. The 1st quarter 2015 was down 7% qtr/qtr. But then notice it took less than 4 months for starts to come right back to the trend line and the trend remained intact. 2015 finished up 11%. This is how the monthly housing starts (# of units) data goes.

The “Work Flow” chart plots the actual work load out over time from the month the work started to completion. The total work flow in any given month is the sum of the work contributed from starts in previous months that have yet to be completed. Residential work flow has averaged +12% for the last 3 years. In 2015, growth was 14%. The very steep climb in early 2013 activity reflects work generated from the 28% rise in new starts in 2012, the largest % increase in new starts in 30 years.
Starts in any given month have only a small % impact on the slope of change in every succeeding month until completion. This is the same concept as cash flow. Construction spending in any given month is the sum of all the ongoing projects from all previous months.
This next plot shows the same workflow, only Not Seasonally Adjusted, so it shows the winter dips in activity and the steeper rate of growth during the more productive months. Although the average slope of growth is similar to the SAAR plot, this shows the real total work activity in any given month varies from that shown by the SAAR plot. However, it is not erratic like the starts plot, it is smooth and repetitive year after year.

It would take a dramatic change in housing starts to significantly alter the progress of work flow and it would need to be a sustained change in starts. If a 20% decline is offset by an corresponding increase in the following month or months, then the future months of work flow will show little affect from the decline.
Construction Expectations 2016
4-6-16
What should we expect in 2016 for construction spending, jobs and cost?
Nonresidential buildings starts (as reported by Dodge Data & Analytics) were well above average from March 2014 through May 2015 but since then have been below average. It takes about 24 to 30 months for nonresidential building starts to reach completion. The effect of below average starts will kick in at the end of this year after strong spending growth.
Non-building infrastructure starts jumped 50% above average from November 2014 to peak in February 2015, then settled back to average in July of 2015. Those very strong starts in early 2015 will be spread out over 4 to 6 years so will not cause spending to spike. They will help support a slow steady increase in spending over the next two years.
Residential starts averaged near 20%/yr growth for 3 years but dropped below average for the entire 2nd half of 2015. That late 2015 dip in starts may not slow residential spending too much until the end of 2016. Overall, the data shows another repeat year of growth similar to the last three years.
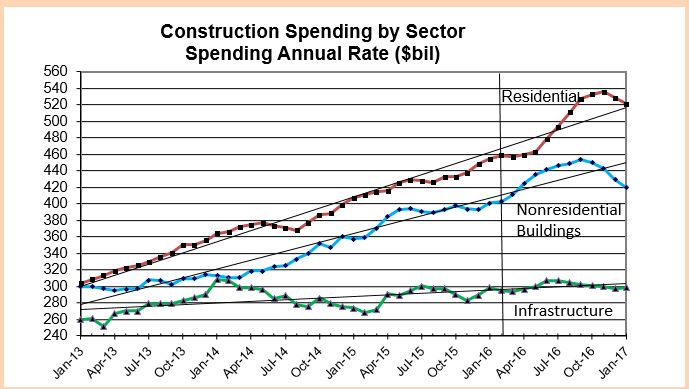
2015 Construction spending finished the year up 10.6% over 2014. After 3 years of growth averaging 9%/year, 2016 total construction spending could climb 11% above 2015, the largest percent gain in over 10 years. Any construction spending slowdown is temporary, baked in from old uneven starts causing uneven cashflow, soon to be ending. By the 2nd quarter 2017 all sectors return to positive growth for strong spending in 2017.
Nonresidential buildings construction spending went from zero growth in 2013 to 9% in 2014 and took off to hit 17% growth in 2015. Nonres bldgs spending could reach 12% growth in 2016 and 7% in 2017.
Infrastructure spending will increase a little in 2016 but we won’t see a sizable increase of 8% until 2017.
Residential spending averaged over 15%/year for the last 3 years and could go over 15% growth in 2016, combining for the best four years of spending growth since 2002-2005.
Don’t be mislead by news that construction spending is close to reaching the previous highs. That may be true of spending, but spending is not the measure of expansion in the construction industry. The measure of expansion is volume, spending minus inflation.
Construction spending is up nearly 40% off the 2011 lows and within 5% of the 2006 highs. But after adjusting for inflation, volume is up only 22% from the 2011 lows and is still 17% below 2005 peak volume. We still have a long way to go. While spending is predicted to reach over 11% growth in 2016 and may do the same in 2017, volume will increase only 5% to 6% each year. The rest is due to inflation.

March 2016 construction jobs increase 37,000 from February and although up and down, have averaged 37,000 jobs per month for the last 6 months. That is the highest 6 month average growth rate in 10 years. That certainly doesn’t make it seem like there is a labor shortage. However, it is important to note, the jobs opening rate (JOLTS) is the highest it’s been in many years and that is a signal of difficulty in filling open positions.
To support the expected 2016 volume growth we need an average 25,000 new jobs per month in 2016, 300,000 new jobs, reaching a three-year gain of nearly 1 million jobs for the period 2014-2016, the highest three-year total jobs growth since 1997-1999. The labor force hasn’t expanded this fast in over 16 years. That can have some undesirable consequences. Rapid jobs growth may result in accelerating wages and lost productivity, compounding the cost to labor.
4-6-16
If we get a construction jobs slowdown in the next few months, it’s not all due to labor shortages and not being able to find people. Construction volume has been growing faster than jobs for more than a year. It means productivity in 2015 is up after several down years. But, while we’ve recorded consecutive years of productivity declines many times, we have not had two consecutive years of productivity gains in the last 22 years. So historically we should expect a decline, not gains this year.
Material input costs to construction are down over the last year, but that accounts for only a portion of the final cost of constructed buildings. The cost of new residential construction is up 5% to 6% in the last year. Several nonresidential building cost indexes are indicating construction inflation between 4% and 5%. The Turner non-residential bldg cost index for 2015 is 4.6%. The 1st qtr 2016 is up 1.15% from the 4th quarter 2015. The Rider Levitt Bucknall nonresidential building 2015 cost index is 4.8% and the Beck Cost Report has 5.0% for 2015. I recommend an average 5.5% cost inflation in 2016 for residential and nonresidential buildings. Non-building infrastructure costs are unique to each individual infrastructure market, so average building cost indices should not be used for infrastructure.
What Drives Construction Spending?
3-23-16
New construction starts drive construction spending. For all the discussion regarding the monthly rise and fall of spending, most of the spending in any given month is already predetermined since two thirds of all construction spending in the next 12 months comes from projects that were started prior to today. This is commonly referred to as backlog.
The pattern of spending does not follow the pattern of new starts which can fluctuate dramatically. It follows the pattern developed by the cashflow from all previous starts. Data for new construction starts is sourced from Dodge Data & Analytics. Cash flow is developed independently. Here’s a much simplified example of cashflow: a new $20 million project start is to be completed in 20 months, therefore we expect this project to generate $1 million of spending every month for the next 20 months.
This plot is an Index, so the ratios of starts and actual spending show the relative volume of each of these three major sectors as compared to each other.

Nonresidential buildings new construction starts were elevated for 16 out of the last 24 months. Starts were strong from February through July of 2015. A slowdown occurred in the second half of 2015 but the last four months have been gaining slowly. It looks like the backlog of elevated starts will keep spending rising at least until the end of 2016 before we see a slight dip in spending.
75% of all nonresidential building spending in 2016 comes from projects that were started between early 2014 and the end of 2015. Each month, new starts generate only 4%-5% of monthly spending. As we start the new year, backlog accounts for 95% of January spending. We know a lot about spending within the next few months, but what we have in backlog for December at the beginning of the year from previous starts accounts for only 50% of December activity. We will add about 4-5% more to December backlog from new starts each month this year.
Five out of six times in the last 18 months that nonbuilding infrastructure new construction starts jumped 25% to 50% above the running average it was due to massive new starts in the power sector. Some of these projects are worth several billions of dollars. While this causes new starts to fluctuate wildly, these projects sometimes take four to five years from beginning to completion, so the cash flow is spread out over a very long period, therefore spending does not experience the same magnitude of monthly change as starts.
80% of all nonbuilding spending in 2016 comes from projects that started from mid-2013 through the end of 2015. New starts each month generate only about 3% of monthly spending.
The average of residential starts for the last three months is higher than any time since 2007 when residential starts were already on the decline by 24% from the previous year. The volume of residential starts predicts that spending should be higher than it is currently. This could mean that some starts have been delayed. Or, it could be because residential starts have the shortest duration, they may be the most difficult to predict spending from starts.
55% of all residential building spending in 2016 comes from projects that started between late 2014 and the end of 2015. New starts each month generate almost 10% of monthly spending.
(6-5-16) RE: a discussion related to a decline in nonresidential permits suggests nonresidential spending will decline. Yes, but at what rate? Permits are directly related to new construction starts. Since every month of new starts has an impact of only 4-5% on nonres spending in every following month for the next 20-25 months, then a 10% drop in permits in a single month would cause only a 0.4% to 0.5% reduction in spending in each of the following 20-25 months. It would take a prolonged trend of declining permits and therefore declining new starts to really see a dramatic decline in spending, and then the greatest effect would be well out into the future.

Construction Volume Vs Construction Spending
Construction volume is not the same as construction spending.

Spending is the number nearly everyone follows. Volume is spending minus inflation.
Two years that show the greatest differences between spending and volume highlight the affect of inflation. In 2004 and 2005 total construction spending grew by 11% and 12.5%, but after inflation, volume grew by only 3% and 2%. In the most recent year, construction spending in 2015 grew by 10.5% but total construction volume grew by only 7.5%.
For the four years 2012 through 2015 construction spending grew by 35% but after inflation volume grew by 21%. Inflation accounts for 14% of spending growth.
Annual construction inflation varies for residential, nonresidential buildings and nonresidential infrastructure, and it varies sometimes so widely that each should be used only to adjust that specific group. Since 1993, long-term annual construction inflation for buildings has been 3.5% per year, even when including the recessionary period 2007-2011. During rapid growth periods, inflation averages more than 8% per year.
Historical average volume growth over the last 22 years is grossly distorted by the recession. Volume declined in 8 of those 22 years. In the worst three years of the recession, 2008, 2009 and 2010, volume declined by 28%. If we take out those three years the typical growth period averages are more apparent. The historical average volume growth in construction with recession data removed and after adjusting for inflation is 2% per year for 19 years.
Adjusting for inflation is changing current dollars to constant dollars.
Current dollars = dollars are reported in the value of the year reported, 2008 = 2008$, 2015 = 2015$. News reports almost always refer to current dollars and therefore do not account for the influence of inflation.
Constant dollars = all dollars adjusted to represent dollars in the year of comparison. This adjusts for inflation so 2008$ (and all other years) are converted to equivalent 2015$.
It’s not too hard to understand why we need to look at constant dollars when you think of it in terms of building a house. For example, a 2,500 sf house built in 2001 may have cost $250,000 then to build. Today to build that exact same house may cost $400,000. The house is no different, so volume remains the same. The only thing that changed is inflation. With respect to constant dollars for the same volume, $250,000 in 2001 dollars would be equal to $400,000 in 2015 dollars.
The common comparison is to look at growth in construction spending from year to year. What that does not tell us is how much of the spending growth is inflation and how much is a real increase in construction volume.
Constant dollars makes a huge difference in the analysis. Adjusting all previous years of spending allows us to compare changes in volume growth from year to year. This plot of total construction dollars shows current dollars would indicate we are now only 7% below the previous high and we’ve had growth of 37% from the recession low. Constant dollars, adjusting for inflation, shows volume is still 17% below the previous cycle high and we’ve had growth of only 22% since the recession lows.
Construction Volume Growing Faster Than Jobs, and That’s a Good Thing.
2-24-16
The most talked about reason for slower jobs growth is the lack of experienced workers available to hire. In fact, recent surveys indicate about 80% of construction firms report difficulty finding experienced workers to fill vacant positions. That certainly cannot be overlooked as one reason for slower jobs growth, but is that the only reason?
Even with all this talk of difficulty finding experienced construction workers, there is a lot of hiring going on. For the 5 year period 2011-2015 we added 1,100,000 construction jobs with the peak growth rate in 2014 at 6.1%. Jobs increased by 20% in 5 years.
For the two years 2014 + 2015 we added 650,000 jobs, the largest number of jobs in two years since 2004 + 2005. In that two years, jobs expanded by 11%, the fastest percent growth since 1998-1999, the fastest pace in 17 years. But peak growth was in 2014 with slower growth in 2015. I expect even slower growth in 2016.
Construction spending hit bottom at the same time as jobs, the 1st quarter 2011. For the same 5 year period 2011-2015 construction spending increased far more than jobs growth. Why is it that jobs don’t increase at the same rate a construction spending? Because much of that spending growth is just inflation. When describing a shortfall of construction workers, jobs growth should not be compared to spending growth. After adjusting for inflation from Q1 2011 to Q4 2015, we find that construction volume increased by 22% in 5 years.
Now it looks like over 5 years jobs seem to be growing nearly the same as construction volume. It even looks like productivity increased, but that’s still not the whole picture.
Real work output growth is total jobs adjusted by the hours worked each year. From 2011 to 2015 construction hours worked increased by 3.6% from near the lowest on record to the highest ever recorded. The reason this has such a huge effect is hours worked gets applied on all 6.5 million jobs, not just the new jobs added. So, a workforce that grew by 20% worked 3.6% longer hours showing that net total work output actually increased 24.3%.

This data shows that over the last 5 years new volume increased by 22% while work output to produce that volume increased by 24%. Data clearly indicates we have added more work output than the volume of work we have produced. This indicates a drop in productivity over the last 5 years.
It is not uncommon at all that productivity declines during rapid growth. This pattern of growth appears prominently in the last two expansions between 1996 and 2006. Firms may be increasing staff based on revenue without strict attention to real volume growth, only to then slow jobs growth and allow volume production to catch up.
By measuring to previous productivity levels, we could say the construction workforce is currently overstaffed. Of course, spending (and net volume after inflation) is expanding rapidly and with it so must the workforce. But, if there is any hope that eventually productivity will return to previous levels, then we must hope for a minimum increase of 2%+ in volume with no matching additional increase in new jobs or hours worked.
Over the next two years I predict construction spending will increase close to 20%, BUT construction volume will increase only 10%, most of that in 2017. In a previous post, “How Many Construction Jobs Will Be Needed” I predicted jobs will grow by 500,000 to 600,000, only about 8%.
Filling positions with workers less qualified than those who were lost accounts for some of the decline in productivity. Working longer hours also leads to productivity loss. To regain lost productivity, new workers need to gain experience AND overall hours need to be reduced and that workload replaced with new jobs. That’s certainly not likely to happen all in one year, but it may account for some of the reason why volume is currently growing faster than jobs, and that’s a good thing. I expect that will continue at least for the next two years.
January 2016 Construction Economics Report
For the latest Construction Economics news follow this link
Construction Economic Outlook
…
…
January 2016 economic report:
BUILDING FOR THE FUTURE
Construction Economics – Market Conditions in Construction.
Construction spending may reach historic growth in 2016. We are currently near the most active 3 year period of growth in construction in more than 20 years, and it’s already been ongoing since 2013-2014.
Construction spending is forecast to increase 9.7% in 2016. Spending could reach a total 30% growth for the three years 2014-15-16. The only comparable periods in the last 20 years are 29% in 2003-04-05 and 27% in 2013-14-15.
Uneven growth rates ranging from rapidly increasing spending to slight dips is more an indication of the effects of uneven new starts patterns than a loss of growth momentum.

SPENDING
Nonresidential buildings spending is forecast to grow 13.7% in 2016 and the three-year total growth could reach 40% for 2014-15-16. The only comparable growth periods in the last 20 years are 40% in 2006-07-08 and 32% in 1995-96-97. Major contributions are increasing from institutional work in educational and healthcare markets. Office, commercial retail, lodging and manufacturing will decline considerably from from the levels in 2015 but still provide support to 2016 growth.
Residential spending increased 46% in 2013-14-15, similar to only one comparable period in the last 20 years, 48% in 2003-04-05. Residential spending will slow several percent early in 2016 before resuming upward momentum to finish the year with 12% growth, slightly less than growth in 2014 and 2015.
Non-building infrastructure projects, in two of the last three years have barely shown any gains, entirely due to declines in power plant projects. This will repeat in 2016. Spending will decline over the next six months due to the ending of massive projects that started 24 to 42 months ago, then resume moderate growth. Following a 0.5% increase in 2015, spending will increase only 1.2% in 2016, held down by a 10% drop in power projects, the second largest component of infrastructure work.
JOBS
Construction added 1.0 million jobs in the five years 2011-2015. 800,000 jobs were added in the last three years. In addition, hours worked increased to an all-time high adding the equivalent of 240,000 more jobs over the last five years.
In the two years 2014-2015, jobs increased the most since 2004-2005. Growth in nonresidential buildings and residential construction in 2014 and 2015 led to significant labor demand and wage growth. To support forecast spending, jobs need to grow by 500,000 to 600,000 in 2016-2017.
From the low-point of the recession in January 2010, the unemployment rate began declining as a result of the unfortunate reason of workers leaving the construction workforce. That decline halted in early 2013, at which point the workforce once again started growing. Since then the unemployment rate has been declining due to the non-working pool being reabsorbed into the the employed workforce.
There are numerous reports of labor shortages in some building professions. Average construction unemployment for Nov-Dec-Jan equaled the lowest on record (for this 3mo period) last seen in 2006, indicating a low available nonworking pool from which to grow jobs. This data supports the argument of labor shortages and potential difficulties ahead in growing employment. However, jobs continue to grow at the fastest rate in 10 years.
INFLATION
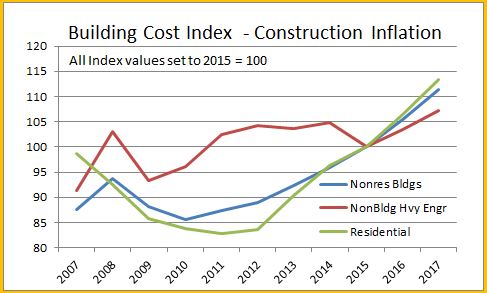
Construction inflation for buildings in 2016-2017 is quite likely to advance higher and more rapidly than previously thought. Long term construction cost inflation is normally about double consumer price inflation. Construction inflation in rapid growth years is much higher than average long-term inflation. Since 1993, long-term annual construction inflation for buildings has been 3.5%, even when including the recessionary period 2007-2011. During rapid growth periods, inflation averages more than 8%.
Spending growth, up 35% in the four-year period 2012-2015, exceeded the growth during 2003-2006 (33%) and 1996-1999 (32%) which were the two fastest growth periods on record with the highest rates of inflation and productivity loss. Construction spending growth for the four year period 2013-2016 is going to outpace all previous periods.
Inflation cost for residential buildings, nonresidential buildings and infrastructure projects do not follow the same pattern. For the last three years, the Gilbane Building Cost Index for nonresidential buildings has been increasing and has averaged just over +4%. Residential buildings cost indices averaged just over +6% but have been decreasing. Both are expected to climb in 2016. Caution: composite all-construction cost indices or indices that do not represent final cost should not be used to adjust project costs.
Infrastructure indices are so unique to the type of work that individual specific infrastructure indices should be used to adjust cost of work. The FWHA highway index dropped 4% in 2013-2014 but increased 4% in 2015 and is expected to increase in 2016-2017. The IHS power plant cost index gained 12% from 2011-2014 but then plummeted in 2015 to an eight year low. The Producer Price Index (PPI) industrial structures index and the PPI other nonresidential structures index both have been relatively flat or declining for the last three years.
Anticipate construction inflation for residential and nonresidential buildings during the next two years closer to the high end rapid growth rate of 6% to 8% rather than the long term average of 3.5%.
The full report provides analysis for what occurred in 2015, data that supports 2016 forecasts and historical trends that shape the construction industry.
Author’s note: I provided all opinion in this economic report. Now, as an independent construction economics analyst, I compile economic information and perform data analysis. You can now find all this analysis here in this new blog format. EdZ

Construction Inflation Cost Index
Note: The post you’ve reached here was originally written in Jan 2016. For the latest information follow this link to the newest data on Inflation. 8-15-19
ESCALATION / INFLATION INDICES
Thank You. edz
Jan. 31, 2016
Construction inflation for buildings in 2016-2017 is quite likely to advance stronger and more rapidly than some estimators and owners have planned.
Long term construction cost inflation is normally about double consumer price inflation. Construction inflation in rapid growth years is much higher than average long-term inflation. Since 1993, long-term annual construction inflation for buildings has been 3.5%/yr., even when including the recessionary period 2007-2011. During rapid growth periods, inflation averages more than 8%/yr.
For the period 2013-2014-2015, nonresidential buildings cost indices averaged just over 4%/yr. and residential buildings cost indices average just over 6%/yr. I recommend those rates as a minimum for 2016-2017. Some locations may reach 6% to 8% inflation for nonresidential buildings but new work in other areas will remain soft holding down the overall average inflation. Budgeting should use a rate that considers how active work is in your area.
Infrastructure projects cost indices on average have declined 4% in the last three years. However, infrastructure indices are so unique that individual specific indices should be used to adjust cost of work. The FWHA highway index dropped 4% in 2013-2014 but increased 4% in 2015. The IHS power plant cost index gained 12% from 2011-2014 but then plummeted in 2015 to an eight year low. The PPI industrial structures index and the PPI other nonresidential structures index both have been relatively flat or declining for the last three years.
These infrastructure sector indices provide a good example for why a composite all-construction cost index should not be used to adjust costs of buildings. Both residential and infrastructure project indices often do not follow the same pattern as cost of nonresidential buildings.
Anticipate construction inflation of buildings during the next two years closer to the high end rapid growth rate rather than the long term average.
Overtime Isn’t Always What It Seems – Lost Productivity Construction
1-30-16
It is sometimes necessary when the situation dictates to increase working hours to achieve a shortened schedule. However, numerous studies can be found to support that Overtime results in lost productivity. There are other factors that affect productivity, but just to address the topic of Overtime, for the moment they will be ignored. This productivity loss set of data is from Applied Cost Engineering, Clark and Lorenzoni, Marcel Dekker, Inc., 1985.
As both hours and number of days worked increases over 5 days and 8 hours, productivity declines. 5 days and 8 hours is considered the norm = 0% productivity loss. Any increase in hours or days above this norm reduces productivity. All values approximate and % loss is loss of production on ALL hours worked.
5 days and 8 hours = 40 hrs @ 0% productivity loss = 40 hrs productive
5 days and 10 hours = 50 hrs @ 7% productivity loss = 46.5 hrs productive
5 days and 12 hours = =60 hrs @ 12% productivity loss = 53 hrs productive
6 days and 8 hours = 48 hrs @ 3% productivity loss = 46.5 hrs productive
6 days and 10 hours = 60 hrs @ 17% productivity loss = 50 hrs productive
6 days and 12 hours = 72 hrs @ 25% productivity loss = 54 hrs productive
7 days and 8 hours = 56 hrs @ 7% productivity loss = 52 hrs productive
7 days and 10 hours = 70 hrs @ 20% productivity loss = 56 hrs productive
7 days and 12 hours = 84 hrs @ 28% productivity loss = 60.5 hrs productive
Not only does overtime produce lost hours, but the cost of the overtime hours increases. Hours over 8 might cost 1.5x normal rate. Days over 5 might cost 2x normal rate. Increasing days and hours rapidly balloons the cost of completing the work. However, if absolutely necessary to meet unusual schedule demands, the cost vs time to complete work can be modeled for each scenario and the least destructive option (whether that be cost constrained or time constrained) can be agreed upon by all parties. The best choice is always that which requires the minimum added cost to achieve the restricted schedule.
See this blog post for an example Construction Overtime – A Common Miscalculation
IF Another Recession, What Would Happen to Construction?
8-15-19 See WHAT IF? Construction Recession 2020
1-27-16
The wheels of construction turn slowly.
There is plenty of talk these days of whether or not we may slip into another recession. On any given day you can read several articles pointing to why or why not we are headed into another recession. I’m not trying to take a position here. I would like to get a rough idea what would happen to this current construction recovery if we do slip into recession.
A starting baseline for this discussion is my forecast for 2016; total spending up 10%. nonresidential buildings up 14% after a 17% increase in 2015, residential up 12% following 13% in 2015 and non-building infrastructure up 1% for a total less than 2% in 2015-2016. So, you can see I’m not predicting a recession.
If you think of a recession as having an immediate affect on total construction, like a quick drop in materials prices or cost of buildings, think again. Construction is sort of like an aircraft carrier, it takes a long time to turn around.
The best indicator of future construction activity is the projected cash flow generated by all the construction starts that have been recorded. Construction starts represent the beginning of spending on new projects. Projects can take many months to reach completion. Some portion of the total project spending occurs in every month over the full duration of the project from start to completion.
We start 2016 with a backlog of projects that will generate about 70% of all the cash flow in 2016. It’s likely that most if not all of the projects already started would move on to completion. But new starts will be cut back.
To get an idea how another recession might affect construction spending, I kept all backlog as is but I reduced future new construction starts for the next two years (2016 and 2017) by 30% for residential and nonresidential buildings, and 15% for infrastructure projects. This mimics the declines we experienced from 2006 to 2009. I then allowed for a 5% increase across all sectors in 2018.
The result is a 5% drop in construction spending in 2016, still higher than 2014, but then a 10-15% drop in 2017 setting us back to near the same level as 2013.
These spending declines would cause a temporary loss of about 400,000 to 500,000 jobs.
Nonresidential buildings could still eke out a slight gain in 2016 but would drop 20% in 2017. Residential construction would drop about 5% in 2016 and then drop another 10-15% in 2017. Nonresidential infrastructure work would decline 10% in 2016, but then rebound to no change in 2017.
After two years of declines, in 2018 nonresidential buildings would climb back to near even with 2017, residential would grow 5% and infrastructure would remain flat. Total 2018 spending would climb only 2% over 2017 and would still only reach spending in 2013.
So, a 30% decline in activity for two consecutive years starting today would set us back four to five years, but the major affect would not be felt until 2017. If that were to happen, obviously spending would be revised, but also I would have much different predictions for inflation and jobs.
There’s a reason we see the dips and rises on the chart in both 2016 and 2017. It reflects the decline in the rate of new starts plus the remainder of old backlog finishing at varying end-dates. Also, given a constant amount of seasonally adjusted new starts, there is a difference in the actual amount of starts in winter months vs summer months. This plays out over time as dips and rises in spending. Spending activity will not be smooth in a recession.

What Did He Say? Fact Checker – Track Record
MY TRACK RECORD
Indoor Masters National Track Championships
masters age group 45-50
Mile – 4:41.7 – 4th place
3000m – 9:25.3 – 3rd place
Oh, wait. That’s not what you are here to read. You want my track record on construction economic forecasts. How good are my forecasts? Do they prove to be accurate? How do they compare to the rest of the industry forecasts? OK. Let’s have a look.
- Bullets show what I forecast.
This is what actually occurred. Actual is in red if I got it wrong.
From Jan 2013
- The ABI, McGraw Hill Dodge new starts and the Dodge Momentum Index (DMI) are all indicating a dip in nonresidential spending potentially from February through May 2013.
- Architecture Billings Index (ABI) went UP from May 2012 to January 2013 with only December down slightly (see figure B). This is a very good leading indicator for new construction work starting in Q3-Q4 2013.
- I expect a dip in nonresidential buildings work between January and May 2013, at which point all indicators point to sustained growth through year end.
From February 2013 through June 2013 actual spending on nonresidential buildings dropped by 2%. Then from June through November spending increased by 6%.
From Jan 2013
- As spending continues to increase, contractors gain more ability to pass along costs and increase margins. However, contractors almost always are playing catch-up. In the most recent three-month period, contractors’ costs began to climb faster than whole building costs went up, due to both increasing material costs and declining productivity.
- Once growth in nonresidential picks up and both residential and nonresidential are active, we will begin to see apparent labor shortages and productivity losses.
For 2013 and 2014 construction spending increased 7% and 10%. During that 2 year period, total labor and materials inputs increased only 2% to 3%, but construction inflation measured 4.5%. Margins increases drove up the total inflation cost. Available (nonworking) workforce declined to about 400,000, near the lowest on record. Productivity declined by 2%.
From Jan 2013
- Construction Spending for 2013 will be pushed higher by huge growth in residential construction, a rate of spending growth that increased by 30% from Q1 to Q4 2012
Residential spending in 2013 grew at a rate of 1.5% per month, largest one year growth since 2004.
From Jan 2013
- The National Association of Home Builders consensus estimate for new residential units is growth of 23% in 2013 and 33% in 2014. 2012 grew by 28%.
- The NAHB projections are for an increase of 150,000 units in 2013 and 230,000 in 2014, 20% and 27% growth the next two years. There’s a possibility we could achieve that. But, especially in 2014, that would exceed the fastest growth rates, both volume and total jobs, achieved in the last 30 years.
- Mark Zandi, economist for Moody’s, in the same article is quoted as saying his more optimistic forecast has residential construction growing to 1.1mil in 2013 and 1.7mil new housing starts in 2014, growth of 46% and then 54%. I say NO WAY
- A more reasonable projection is new housing starts may reach 850K to 900K in 2013 and 1.0 to 1.05 million in 2014, new homes growth rates of 15% to 20% and total residential spending growth of 12% to 15%. That still has the workforce expanding rapidly, but at least at a not unheard of rate.
Housing starts reached 925,000 in 2013 and 1,003,000 in 2014, well below the 30 year historical annual growth.
From Jan 2013
- Future escalation, in order to capture increasing margins, will be higher than normal labor/material cost growth. Lagging regions will take longer to experience high escalation.
- I’m advising a range of 4% to 6% for 2013, 5% to 7% for 2014 and 6% to 8% for 2015.
- Expect residential escalation near the upper end of the range.
Actual total construction cost inflation 2013 = 4.3%, 2014 = 4.7% 2015 = 2.9%. All inflation values were held to lower totals due to infrastructure work which did not have more than 2% inflation during that period and actually experienced deflation in 2015. Residential buildings inflation for 2013-14-15 was 8.9%, 7.1% and 4.1%.
Posted April 2014
- Construction Spending “residential buildings” expect $379 billion in 2014
- Construction Spending “nonresidential buildings” expect $325 billion in 2014
- Construction Spending “totals” expect $960 billion in 2014
Posted August 2014
- Construction Spending “residential buildings” expect $365 billion in 2014
- Construction Spending “nonresidential buildings” expect $314 billion in 2014
- Construction Spending “totals” expect $961 billion in 2014
2014 Residential spending = $354 billion
2014 Nonresidential spending = $320 billion
2014 Total Construction spending = $960 billion
These values prior to U.S. Census major correction to data.
Posted August 2014
- If you are pricing future construction jobs the way you always have, with 2-3 pct escalation, you are already in trouble!
- If you’re an owner with plans to construct a building in the future and you are inflating cost by only 2-3 pct, you’ve missed the boat.
Total construction inflation for 2013-14-15 was 4.3%, 4.7% and 2.9%. All years were reduced by a lack of inflation in infrastructure work. Inflation for nonresidential buildings was 3.5%, 4.2% and 4.8%. Residential buildings inflation was 8.9%, 7.1% and 4.1%.
Posted September 2014
- Real Construction Volume in 2014 (construction spending minus inflation) will grow less than 2 percent
Real construction volume in 2014 increased 4.9%. Commercial nonresidential construction started it’s current boom.
Posted Dec 2014
- Construction Spending “residential buildings” expect $405 billion in 2015
- Construction Spending “nonresidential buildings” expect $364 billion in 2015
- Construction Spending “totals” expect $1,040 billion in 2015
Posted Jan 2015
- Cash flow of new starts for nonresidential buildings indicates a 15% increase in the monthly rate of spending over the next 10 months.
- Both ABI and Starts cash flows indicate a mild slowdown in nonresidential buildings construction spending at the end of 2014 before a strong upturn in spending in 2015. Expect another drop in spending late in 2015
For the period Nov 2014 through Feb 2015, spending on nonresidential buildings stalled flat for 4 months. The monthly rate of spending increased 14% over the 10 months from Oct 2014 to September 2015. Since Sept 2015 spending has been flat.
Posted March 2015
- Even if new starts turn flat for rest of 2015, starts already recorded are indicating Nonresidential buildings construction spending for 2015 will reach 15%+ growth. My closest competitor is forecasting 12.5% growth. The average of all other industry forecasts is 8% growth.
Spending for nonresidential buildings actually hit +17% growth over 2014.
Posted July 2015
- Construction Spending “residential buildings” expect $388 billion in 2015
- Construction Spending “nonresidential buildings” expect $397 billion in 2015
- Construction Spending “totals” expect $1,067 billion in 2015
2015 Residential spending = $390 billion
2015 Nonresidential spending = $387 billion
2015 Total Construction spending = $1068 billion
These values prior to U.S. Census major correction to data.
Posted July 2015
- Nonresidential Buildings spending growth 2015 vs 2014.
- My forecast (Average all others) [closest competitor]
- Educational 7.1% (3.8%) [5.6%]
- Healthcare 6.0% (3.9%) [4.0%]
- Commercial/Retail 5.5% (11.8%) [8.4%]
- Lodging 24.0% (13.7%) [17.1%]
- Office 21.1% (13.5%) [19.2%]
- Manufacturing 49.6% (15.9%) [24.6%]
Educational 6.7%
Healthcare 4.6%
Commercial/Retail 8.4%
Lodging 30.8%
Office 21.9%
Manufacturing 47.3%
So there you have it. Several years of forecasts and how they turned out. You can get an idea of my track record. You be the judge. 🙂
