
PPI Tables 2022 Producer Price Index to NOV’22
PPI tables show input costs and final costs monthly to nonresidential buildings and residential. Here I use that information to track year-to-date (ytd). SEE the latest information at the bottom of this post.
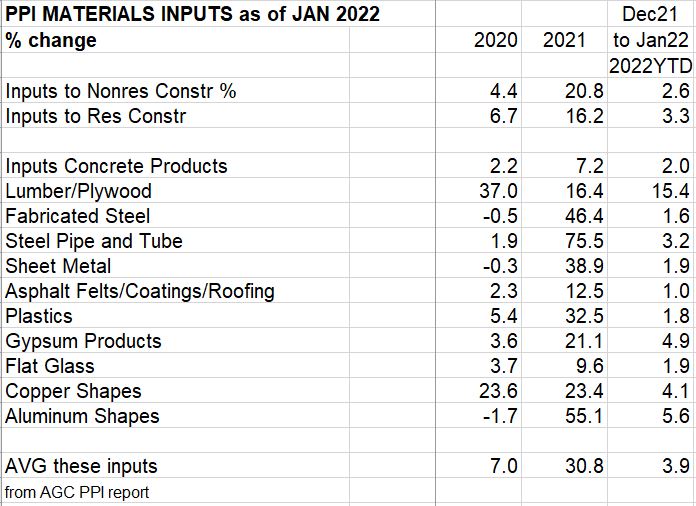
January Inputs PPI is up 2.6% in nonresidential and 3.3% for residential. Most of the inputs reported here are up less than 2% YTD, but Lumber/Plywood is up 15%. Final costs of contractors is up 1% to 5% and final cost of buildings is up 3% to 6%. SEE also Construction Inflation 2022

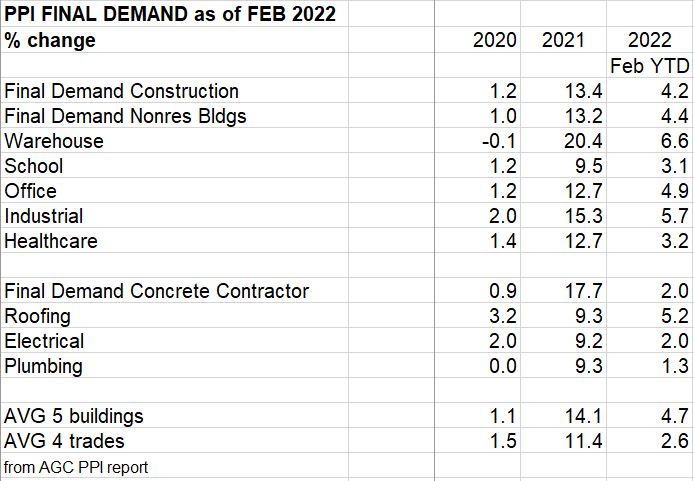
3-23-22 update Input Costs through February 2022 to nonresidential buildings up 4.5% year-to-date, residential up 6.4%. Inputs to residential went up 3.0% in Feb. In a typical year of 4% inflation, costs would increase only 0.25% to 0.50% per month. Residential is up 6%+ after the first two months! Most of the inputs reported here are up less than 2% for February, except Lumber/Plywood up 4.1% and Aluminum up 6.2%. Year-to-date, for two months, Lumber/Plywood is up 20% and aluminum is up 12.1%. Watch copper, up 4.9% ytd, for potential world situation interfering with supply. Final costs of contractors and final cost of buildings changed very little in February. Range is mostly up 2% to 4% ytd, but up to 6% year-to-date. 4-12-22 edited, corrections.

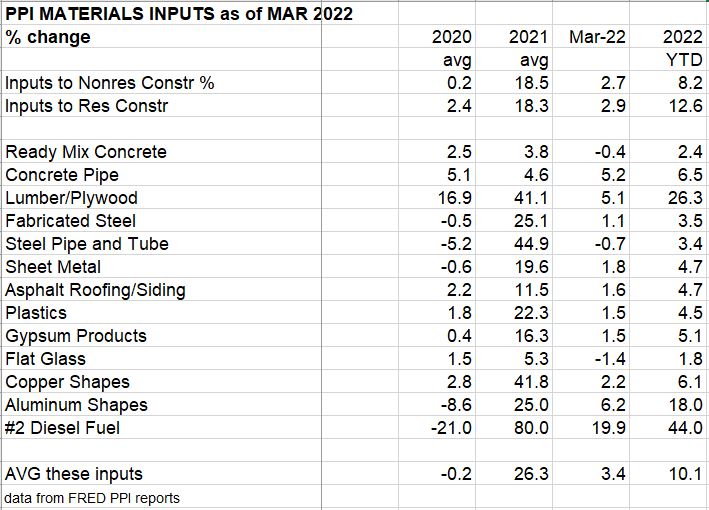
4-13-22 update > Input Costs through March 2022 to nonresidential buildings up 7.5% year-to-date, to residential up 9.5% ytd. In a typical year of 4%-5% inflation, costs would increase only 0.25% to 0.50% per month. Residential is now up 9% after the first 3 months of 2022! Keep in mind when reading these year-to-date (YTD) results, these are cumulative for 1st quarter 2022. That’s not a guess at year end results.
The only inputs reported here up more than 2% for March are Lumber/Plywood, up 5.1%, and Aluminum, up 6.2%. Year-to-date, for 3 months, Lumber/Plywood is up 26% and aluminum is up 19.1%. Watch copper, up 7.2% ytd, for potential world situation interfering with supply. Final costs of contractors and final cost of buildings changed very little in February or March. The final cost average of 5 building types is up 5.2% ytd in the first 3 months of 2022.


The PPI inputs through the 1st quarter is putting pressure on the nonres bldgs index for 2022 to move higher than forecast.
5-8-22 Correction to 2020 and 2021 Totals
I had taken the 2020 and 2021 totals from the AGC PPI reports. However, all analysis by Construction Analytics reports inflation as the annual average. AGC reports the annual growth as the December value, so compares Dec to previous Dec. That does not represent annual growth. For example, some costs in 2021 maintained a level 3% annual growth rate for 9 months then rapidly increased to 9% in the final 3 months. AGC reports the annual growth at 9%, whereas the annual average is 4%. Inflation rate reporting must be consistent, you cannot mix Dec/Dec and annual average. Therefore, all PPI data has been edited using the original source data from Bureau of Labor Statistics.

5-12-22 Construction PPI for April Construction Inputs post slowest monthly gains so far this year.
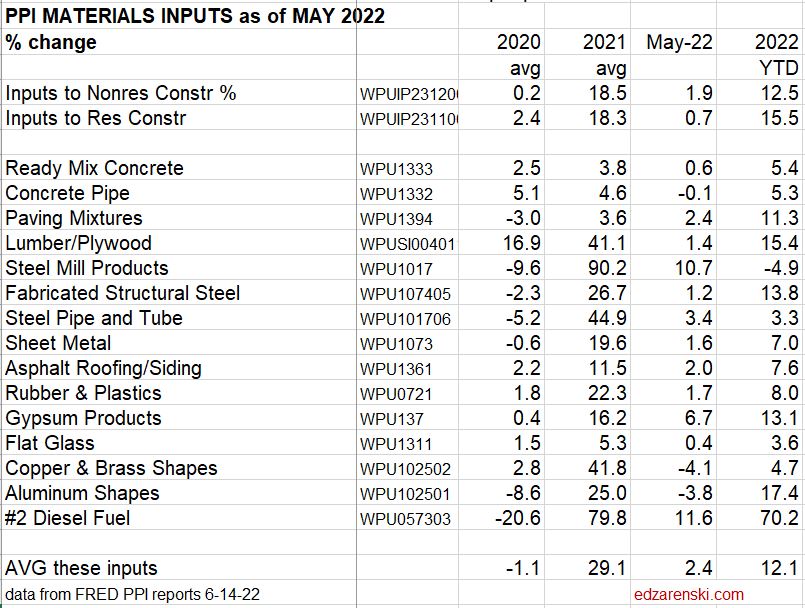
Nonresidential Inputs up 0.9% in Apr, up 10.0% YTD. Residential Inputs up 0.8% in Apr, up 15.6% YTD
Final Demand (Selling Price) Nonres Bldgs post strong gains in 1st 4 months, up 4.1% in April, up 9.0% ytd. Warehouses up 12% ytd.


6-14-22 Construction PPI for MAY Construction Inputs to residential post, for second consecutive month, slowest monthly gains so far this year.
May PPI data for construction > Big gainers from 2021 have slowed in 2022, Lumber, Steel, Sheet Metal, Rubber/Plastics, Copper. New gainers in 2022 are Ready Mix Conc, Conc Pipe, Paving Mixtures, Gypsum. We could see the same levels of inflation as last year, just from different products.
Final Demand pricing is updated every 3-4 months. Just had a major revision in April, some items increased by 50-75%. May increases look low, but the next revision month could change that, as did April. Better to look at this indicator quarterly, after the revision month.

7-14-22 Construction PPI for JUNE Construction Inputs to residential down for thrid consecutive month.
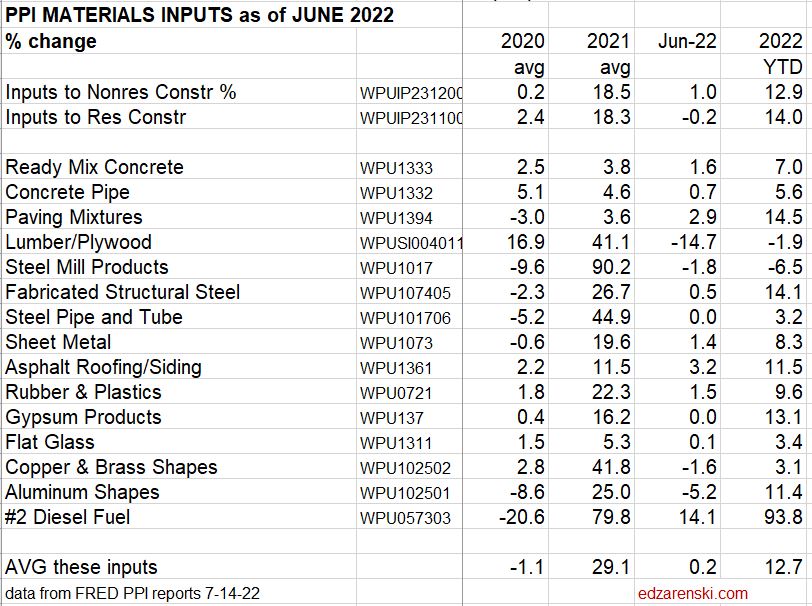
June PPI data for construction > Biggest gain in June is Deisel Fuel, up 14.1%, up 93.8% year-to-date. Biggest decline is Lumber/Plywood, down 14.7% in June, now down 1.9% ytd.
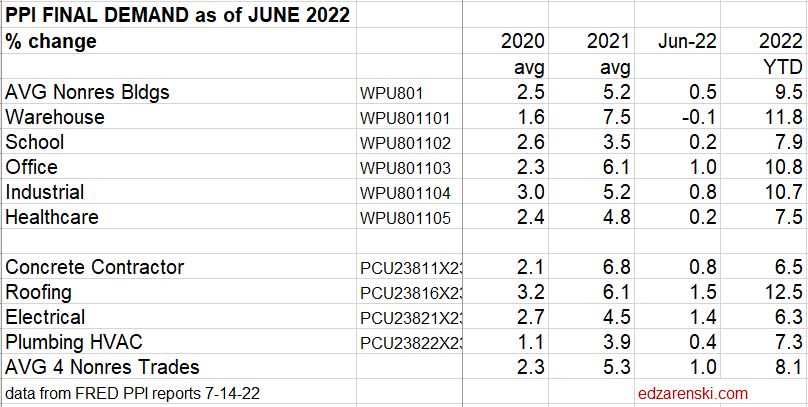
Final Demand (Selling Price) of nonresidential buildings and trades continues to climb, buildings on average up 0.5% in June, up 9.5% ytd, trades up 1.0% for June, up 8.1% ytd.
In this June report, there are many instances where FRED has revised number in previous 2022 months, mostly in the prior two months, but in some cases back to January. So, the year-to-date change from May to June will not match the May ytd previously reported x the June change.
8-12-22 Construction PPI for JULY Construction Inputs to residential down for third consecutive month.
July PPI data for construction > Biggest gainers in July – Ready Mix Concrete posts largest monthly gain of the year, up 2.7%. Now up 9% in 7 months, also up 9.3% compared to same 7 mo 2021. Biggest decliner – Diesel Fuel, down 16% for the month. Now up 62% for first 7mo of 2022, but up 77% compared to same 7mo in 2021.
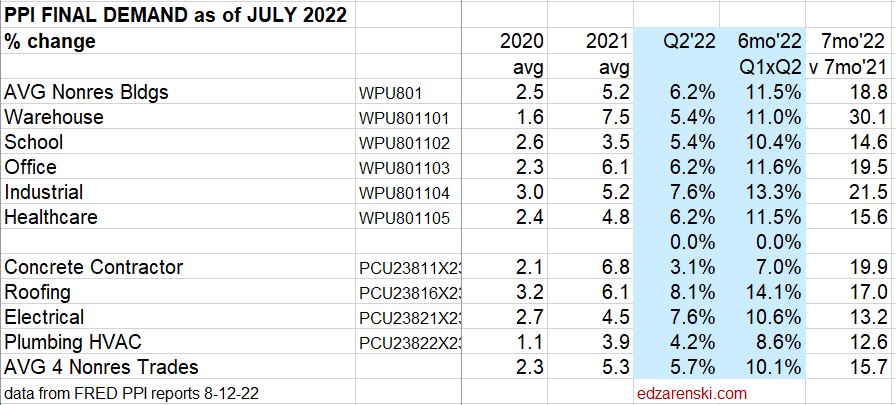
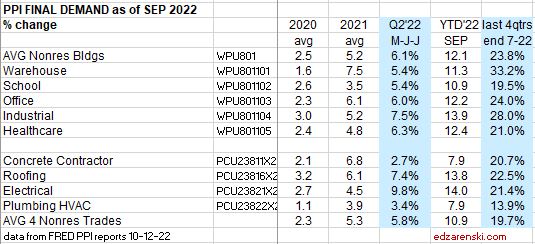
Final Demand (Selling Price) of nonresidential buildings and trades continues to climb, buildings on average up 6.2% for 2nd quarter (M,J,J), up 12% ytd. Trades up 5.7% for Q2, up 12.5% ytd.

Material Inputs PPI represents change in cost of producing those materials. Average material cost is about 50% of final bldg cost. But with several margins tacked on before install, PPI $ represents less than half of final bldg cost, perhaps 40%.
Final Demand PPI, or Selling Price, represents contractors bid price to client. Includes labor, mtrl, equip, overhead and profit. Labor includes change in wages and productivity. Every three months (Jan, Apr, Jul, Oct) BLS performs an update survey to correct these Final Demand indices. For the past three quarterly updates about 80% to 90% of the change in the index was posted in the update month. Therefore, they should not be referenced monthly. These are quarterly indices.
9-14-22 Construction PPI for AUGUST
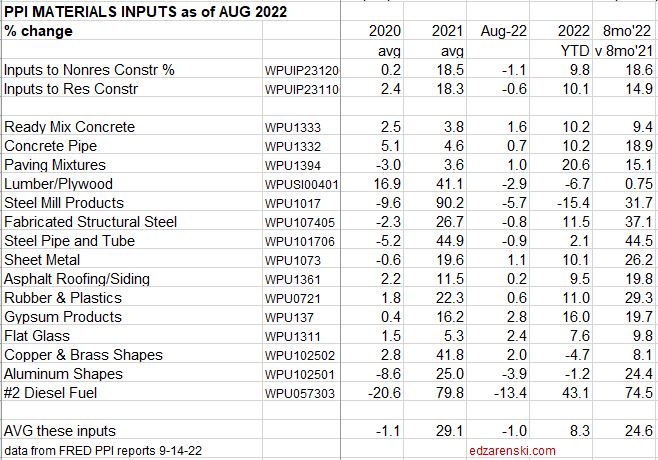
Construction Inputs to nonresidential buildings dropped for the second consecutive month after posting only a 0.4% increase in June, now down -2.4% for the past three months, but still up 9.8% year-to-date. Residential inputs are down for the fourth consecutive month, down -4.4% since April, up 10.1% ytd. Costs are still high, but are moving in the right direction after 1st quarter costs that averaged +10% to +15%. Historically, most cost increases are posted in the 1st quarter and the least in the 4th quarter.
Average of all inputs for nonresidential buildings is up 18.6% for eight months 2022 compared to the same months 2021. Avg inputs for residential compared to 2021 is up 14.9%
- Ready Mix Concrete, up 7 of 8 months, ytd is up10.2%
- Lumber/Plywood, down 4 of the last 5 months a total 28%, ytd down -6.7%
- Fab Str Steel, down -2.1% the last two months, up 11.5% ytd
- Diesel Fuel, down -28% in last 2mo, up 43% ytd
PPI $ represents less than half of final bldg cost, perhaps 40%.
It will take two more months before we see the effect these changes have on Final Demand PPI, which is updated every three months. Next update is to October data released mid-Nov. Every three months (Jan, Apr, Jul, Oct data) BLS performs an update survey to correct these Final Demand indices. For the past three quarterly updates about 80% to 90% of the change in the index was posted in the update month. Therefore, they should not be referenced monthly. These are acting like quarterly indices.

10-14-22 Construction PPI for SEPTEMBER
Construction Inputs to nonresidential buildings dropped for the third consecutive month after posting only a 0.4% increase in June, now down -3.1% for the past three months, but still up 9.5% year-to-date. Residential inputs are down for the fourth consecutive month, down -6.0% since April, up 8.3% ytd. Several major cost components have been on decline the last few months: Lumber/Plywood, Steel Mill Products, Fabricated Steel, Steel Pipe and Tube, Aluminum and Diesel Fuel. Costs are still high, but are moving in the right direction after 1st quarter costs that averaged +7% (28%annual) to +8%. Historically, most cost increases are posted in the 1st quarter and the least in the 4th quarter.
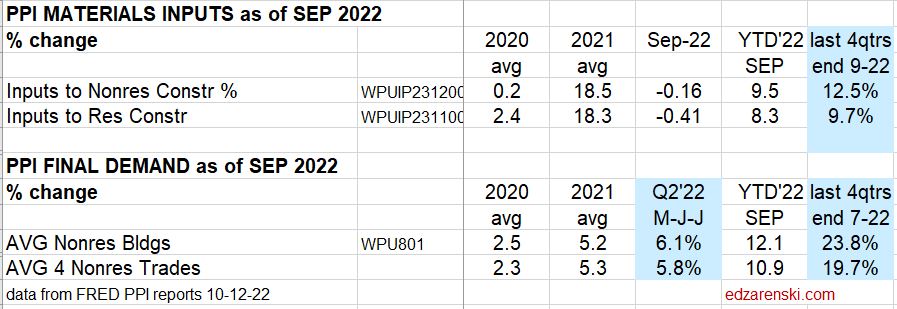
Costs for the last four quarters for all inputs for nonresidential buildings are up 12.5%. Avg inputs for residential for the last four quarters are up 9.7%. The average cost for the last 4 quarters (last 12 months) for the 15 input products I track is up 13.9%.
- Ready Mix Concrete, up 10.7% year-to-date (YTD), up11.6% last 12 months.
- Lumber/Plywood, up 30% in Q1 but down 11.4% ytd, up 9.1% last 12 months
- Fab Str Steel, up 11.2% ytd, up 16.6% last 12 months
- Diesel Fuel, down -17% in 2 of last 3mo, up 60% ytd, up 66% last 12 months
PPI $ represents less than half of final bldg cost, perhaps 40%.

Final Demand PPI is updated every three months. Next update is to October data released mid-Nov when we will see the third quarter, Aug-Sep-Oct, for 2022. Every three months, (Jan, Apr, Jul, Oct data), BLS performs an update survey to correct these Final Demand indices. For the past six quarterly updates about 80% to 90% of the change in the index for the previous quarter was posted in the update month. Therefore, they should not be referenced monthly. Two months are extremely low to the average and the third month is extremely high. Also, the January index is an update month, so most of the index reported that month refers to Nov and Dec, so should not be counted in 2022. Therefore, I chose to report the quarters as reported and updated by BLS. The quarters are FMA, MJJ, ASO, NDJ.
11-15-22 Construction PPI for OCTOBER 2022
Since June, PPI Input costs have been in decline. However Final Demand costs lag and have not posted any declines in at least the last 6 quarters.
Construction PPI Data for Oct’22 > Inputs to Nonres Bldgs UP 9.5%ytd, 12.4% last4qtr. Inputs to Rsdn UP 7.6%ytd, 9.2% last4qtr
FRED corrects Final Demand values quarterly, Jan,Apr,Jul,Oct. Oct value corrects entries for Aug&Sep. Most recent qtr lowest in last4qtrs.
Final Demand PPI is updated every three months. October Final Demand data released mid-Nov represents the correction value for the third quarter, Aug-Sep-Oct. Every three months, (Jan, Apr, Jul, Oct data), BLS performs an update survey to correct these Final Demand indices. For the past six quarterly updates about 80% to 90% of the change in the index for the previous quarter was posted in the update month. Therefore, they should not be referenced monthly. Two months are extremely low to the average and the third month is extremely high. Also, the January index is an update month, so most of the index reported that month refers to Nov and Dec, so should not be counted in 2022. Therefore, I chose to report the quarters as reported and updated by BLS. The quarters are FMA, MJJ, ASO, NDJ.

12-10-22 Construction PPI for NOVEMBER 2022
Since June, PPI Input costs have been in decline. However Final Demand costs lag and have not posted any declines in at least the last 6 quarters. PPI Input$ represent only about 30% to 40% of Final Demand cost.
Construction PPI Data for Nov’22 > Inputs to Nonres Bldgs UP 9.2% ytd, 12.5% last4qtr. Inputs to Rsdn UP 8.2% ytd, 9.3% last4qtr.
For the last 6 months Inputs to nonresidential construction are down -3.0% and to residential are down 5.9%.

FRED corrects Final Demand values quarterly, Jan, Apr, Jul, Oct. Oct value corrects entries for Aug & Sep. Most recent qtr lowest in last4qtrs. We will not get another reliable indicator to Final Demand cost until January when FRED will issue the corrections to Nov and Dec.
Final Demand PPI is updated every three months. October Final Demand data released mid-Nov represents the correction value for the third quarter, Aug-Sep-Oct. Every three months, (Jan, Apr, Jul, Oct data), BLS performs an update survey to correct these Final Demand indices. For the past six quarterly updates about 80% to 90% of the change in the index for the previous quarter was posted in the update month. Therefore, they should not be referenced monthly. Two months are extremely low to the average and the third month is extremely high. Also, the January index is an update month, so most of the index reported that month refers to Nov and Dec, so should not be counted in 2022. Therefore, I chose to report the quarters as reported and updated by BLS. The quarters are FMA, MJJ, ASO, NDJ.
PPI TRENDS
A few years back I looked at PPI historical data. This is what I found.
- 60% of the time, the highest increase of the year in the PPI is in the first quarter.
- 75% of the time, two-thirds of the annual increase occurred in the first six months.
- In 25 years, the highest increase for the year has never been in Q4.
- 60% of the time, the lowest increase of the year in the PPI is in Q4.
- 50% of the time, Q4 is negative, yet in 25 years the PPI was negative only four times.
Since the onset of the pandemic, Feb 2020, residential construction inflation is up 33%, nonresidential up 20%. If you are a residential contractor, take 33% off the top of your revenue growth from Feb20 to Nov22. What remains is your business volume growth. Is your business growing?
Current and predicted Inflation rates updated 12-10-22:
- 2020 Rsdn Inflation 4.5%, Nonres Bldgs 2.6%, Non-bldg Infra Avg -0.3%
- 2021 Rsdn Inflation 13.9%, Nonres Bldgs 7.4%, Non-bldg Infra Avg 7.8%
- 2022 Rsdn Inflation 15.4%, Nonres Bldgs 12.2%, Non-bldg Infra Avg 13.6%
- 2023 Rsdn Inflation 6.0%, Nonres Bldgs 4.8%, Non-bldg Infra Avg 4.3%

Construction Inflation 2022
The most watched indicators of the rate of inflation are the costs of various construction materials and the labor needed to install them. However, the level of construction activity has a direct influence on labor and material demand and margins and therefore on construction inflation.
One of the best predictors of construction inflation is the level of activity in an area. When the activity level is low, contractors are all competing for a smaller amount of work and therefore they may reduce margins in bids. When activity is high, there is a greater opportunity to submit bids on more work and bid margins may be higher. The level of activity has a direct impact on inflation.
This analysis is national level data.
this post last updated 12-10-22
SEE 2023 data here Construction Inflation 2023
2-10-22 See the bottom of this post to download a PDF of the complete article.
update 5-3-22 This article AND the attached PDF downloadable document have been updated to include 1st qtr 2022 inflation updates.
update 5-8-22 This article AND the attached PDF downloadable document have been updated to include changes in inflation in PPI factors.
update 8-12-22 See Summary. Revisions to 2022 inflation.
update 9-19-22 SEE INDEX TABLES AND PLOTS updated to Q2 2022. Note these tables and plots are updated here in the blog post only. Original article attached IS NOT updated.
update 11-16-22 PPI INPUTS table and FINAL DEMAD table for October updated 11-16-22.
update 12-1-22 PPI INPUTS table for November updated 12-10-22. Also INDEX TABLES AND PLOTS updated to Q3 or Q4 where available.
End of updates
The construction data leading into 2022 is unlike anything we have ever seen. Construction starts were up in 2021, but backlog leading into 2022 is down. That is not normal. Backlog is rarely down and then usually when starts have been down the previous year. In this case the starts declined in 2020, but that 2020 decline was so broad and so deep, even with an increase in starts in 2021, backlog to start 2022 has not yet recovered (to the start of 2020). Spending for 2021 was up 8%, but after adjusting for inflation, real volume after inflation was down. Last time that happened was 2006 and 2002, the only two other times that happened in the last 35 years.
Summary
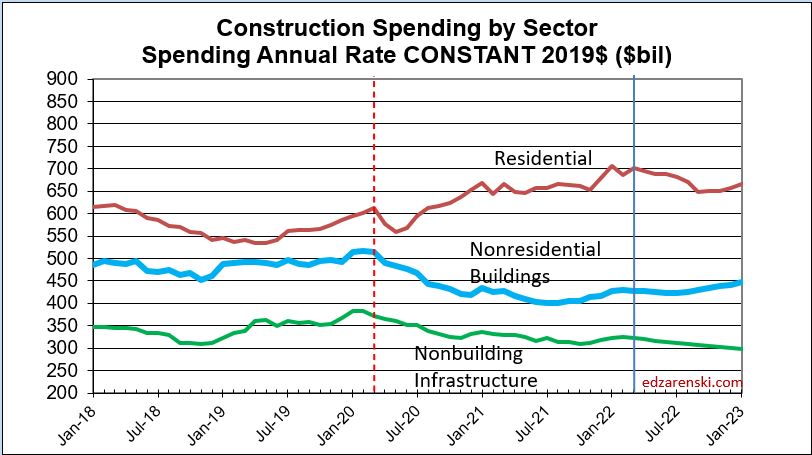
A significant impact of the pandemic on construction is the loss of spending due to the massive reduction in nonresidential construction starts in 2020. Those lower starts reduced nonresidential construction spending in 2020, but more-so in 2021, and in some markets will extend lower spending into 2022 and 2023. The most unexpected change was that residential spending continues a strong increase.
- 2020 new starts declined -7%. Res +6%, Nonres Bldgs -18%, Nonbuilding -15%.
- 2021 new starts increased +18%. Res +22%, Nonres Bldgs +18%, Nonbuilding +8%.
- Forecast 2022 starts are up +11%. Res +10%, Nonres Bldgs +18%, Nonbuilding +2%.
Nonresidential construction volume appears now will experience only slight dip mid-2022, the maximum downward pressure from the pandemic is past. Total All Volume, spending minus inflation, is expected to again reach the same bottom in mid-2022 as in 2021. That should impact jobs, but we haven’t seen jobs react to volume losses as would be expected. Jobs growth without volume growth to support those jobs is a productivity decline, increasing inflation.
Spending for 2021 is up 8%, but nonresidential buildings spending is down 4%. Almost all gains in 2021 spending are due to the 23% gain in residential.
Deflation is not likely. Only twice in 50 years have we experienced construction cost deflation, the recession years of 2009 and 2010. That was at a time when business volume dropped 33% and jobs fell 30%. During two years of the pandemic recession, volume reached a low down 8% and jobs dropped a total 14%. But we gained back far more jobs than volume. That means it now takes more jobs to put-in-pace volume of work. That increases inflation.
No one predicted 2021 construction inflation. In Jan 2021, I predicted Inflation for nonresidential buildings near 4% and Residential inflation at 5% to 6%. Looking back, we now see nonresidential buildings inflation is 7%, the highest since 2006-2007 and residential inflation is 13%, the highest since 1977-1979, in part driven by the highest rates of increase in materials on record.
- 2020 Rsdn Inflation 4.5%, Nonres Bldgs 2.6%, Non-bldg Infra Avg -0.3%
- 2021 Rsdn Inflation 13.2%, Nonres Bldgs 6.7%, Non-bldg Infra Avg 7.5%
- 2022 Rsdn Inflation 11.7%, Nonres Bldgs 6.3%, Non-bldg Infra Avg 5.5%
edit 8-12-22 Much more information from a number of reliable sources is now available regarding recent inflation. Among several inputs, there is a recent BLS update to the Final Demand indices. See latest PPI tables. 2022 Residential Inflation 12.8%, Nonres Bldgs 9.4%, Non-bldg Infra Avg 5.6%.
edit update 9-19-22 inputs revise 2022 construction inflation as shown here. See Tables below:
- 2020 Rsdn Inflation 4.6%, Nonres Bldgs 2.7%, Non-bldg Infra Avg -0.3%
- 2021 Rsdn Inflation 13.4%, Nonres Bldgs 6.8%, Non-bldg Infra Avg 7.8%
- 2022 Rsdn Inflation 14.6%, Nonres Bldgs 9.9%, Non-bldg Infra Avg 12.0%
Cost Indices
General construction cost indices and Input price indices that do not track whole building final cost do not capture the full cost of inflation on construction projects.
Selling Price is whole building actual final cost. Selling price indices track the final cost of construction, which includes, in addition to costs of labor and materials and sales/use taxes, general contractor and sub-contractor margins or overhead and profit.
When construction activity is increasing, total construction costs typically increase more rapidly than the net cost of labor and materials. In active markets overhead and profit margins increase in response to increased demand. These costs are captured only in Selling Price, or final cost indices.
Consumer Price Index (CPI), tracks changes in the prices paid by consumers for a representative basket of goods and services, including food, transportation, medical care, apparel, recreation, housing. This index in not related at all to construction and should not be used to adjust construction pricing.
Producer Price Index (PPI) for Construction Inputs is an example of a commonly referenced construction cost index that does not represent whole building costs. The PPI is a materials cost index. Engineering News Record Building Cost Index (ENRBCI) and RSMeans Cost Index are other examples of commonly used indices that do not capture whole building cost.
Construction Analytics Building Cost Index, Turner Building Cost Index, Rider Levett Bucknall Cost Index and Mortenson Cost Index are all examples of whole building cost indices that measure final selling price (for nonresidential buildings only).
Residential inflation indices are primarily single-family homes but would also be relevant for low-rise two to three story building types. Hi-rise residential work is more closely related to nonresidential building cost indices.
A nonresidential buildings index would be representative of commercial construction or hi-rise residential construction, since hi-rise residential is quite similar too commercial construction and in fact substantial portions of the building are constructed by firms classified as commercial constructors.
The Construction Analytics Infrastructure composite index is useful only for adjusting the total cost of all non-building infrastructure. Individual types of non-building infrastructure require attention to specific indices related to that type of work.
History
Post Great Recession, 2011-2020, average inflation rates:
Nonresidential buildings inflation 10-year average (2011-2020) is 3.7%. In 2020 it dropped to 2.5%, but for the six years 2014-2019 it averaged 4.4%. In 2021 it jumped to 9%, the highest since 2006.
Residential 8-year average inflation for 2013-2020 is 5.0%. In 2020 it was 5.3%. In 2021 it jumped to 14%, the highest since 1978.
30-year average inflation rate for residential and nonresidential buildings is 3.7%. Excluding deflation in recession years 2008-2010, for nonresidential buildings is 4.2% and for residential is 4.6%.
- Long-term construction cost inflation is normally about double consumer price index (CPI).
- In times of rapid construction spending growth, nonresidential construction annual inflation averages about 8%. Residential has gone as high as 10%.
- Nonresidential buildings inflation has average 3.7% since the recession bottom in 2011. Six-year 2014-2019 average is 4.4%.
- Residential buildings inflation reached a post-recession high of 8.0% in 2013 but dropped to 3.5% in 2015. It has averaged 5.3% for 8 years 2013-2020.
- Although inflation is affected by labor and material costs, a large part of the change in inflation is due to change in contractors/supplier margins.
- When construction volume increases rapidly, margins increase rapidly.
Historically, when spending decreases or remains level for the year, inflation rarely (only 10% of the time) climbs above 3%. Avg inflation for all down/flat years is less than 1%. In 2021, spending was down for nonresidential buildings and non-building. Inflation for both was over 8%.
Nonresidential buildings inflation, after hitting 5.3% in 2018 and 4.8% in 2019, fell to 2.5% in 2020, lower than the 4.5% average for the previous four years. In 2021 it was 9.0%. Nonresidential buildings spending has not kept up with inflation since 2016. Spending needs to grow at a minimum of inflation, otherwise volume is declining. Since 2016, inflation exceeded spending by almost 20%.
Nonbuilding Infrastructure inflation, from 2013 to 2017 averaged less than 1%, but then jumped to 5% in 2018 and 2019. Inflation fell to -0.2% in 2020, but jumped to 9.1% in 2021.
Residential construction inflation in 2019 was only 3.4%. However, the average inflation for six years from 2013 to 2018 was 5.2%. It peaked at 7% in 2013 but dropped to 3.2% in 2015 and 3.4% in 2019. Residential inflation is 2021 was 14.0%.
Producer Price Index (PPI) Material Inputs (which exclude labor) to new construction averaged less than 1%/yr. from 2012 to 2017. Cost decreased in 2015 and 2016, the only negative costs for inputs in the past 20 years. Input costs averaged over 5% for 2018-2020. Then in 2021 input costs soared to 22%, the highest ever recorded.
2020 Performance
Even though material input costs were up for 2020, nonresidential inflation in 2020 remained low, possibly influenced by a reduction in margins due to the decline in new nonresidential buildings construction starts (-18%), which is a decline in new work to bid on. An 18% drop in new nonresidential buildings starts within one year equals a loss of near $100 billion of spending that would occur over the next 2-4 years. Nonbuilding starts were down 15%, equivalent to a loss of $50 billion in new work that would likely have been spread over 2-5 years. Residential starts in 2020 increased 6%, adding about $35 billion in new spending spread over 2 years.
Nonresidential buildings inflation for 2020 dropped to 2.6%, the first time in 6 years below 4%. Spending fell only 1.8% but after accounting for 2.6% inflation, volume decreased 4.4%. Nonresidential volume dropped every month in 2020 after the February 2020 peak, down 19% by December, but that’s not the bottom. Declines continue into 2021.
Nonbuilding Infrastructure in 2020 posted mild deflation of -0.3% after +5% in 2019, but averaged only 2%/yr. since 2011. 2020 spending increased only 0.7%. After accounting for -0.3% deflation, volume increased 0.4%. Public infrastructure inflation, up only 1.2% in 2020 after reaching over 4% in 2018 and 2019, averaged 2.7%, since 2011.
Residential inflation averaged 4.5% for 2020. Remarkably, spending increased 15% and 2020 volume was up 10%. Residential business volume dropped 9% from the March 2020 peak to the May bottom, but then by December recovered 16% to hit a post Great Recession high, 11% above Dec 2019.
2021 Performance
Most nonresidential construction markets had a weaker spending performance in 2021 than in 2020. Approximately 40%-50% of spending in 2021 is generated from 2020 starts, and 2020 nonresidential starts ranged down 10% to 25%, several markets down 40%.
Nonresidential buildings starts fell 18% in 2020, but gained 18% in 2021. Nonbuilding starts were down 15% in 2020, then added 8% in 2021. Residential starts increased 6% in 2020 and 22% in 2021.
Nonresidential buildings spending fell 4.4% in 2021. Nonbuilding spending was down 1.1%. Residential spending was the star of the year, up 23%, the largest yearly % gain on record.Nonresidential buildings inflation in 2021 jumped to 6.7%, the highest since 2007. Non-building average inflation was 7.5%, the highest since 2008. Residential inflation in 2021 jumped to 13.2%, the highest on record back to 1967.
After adjusting for inflation, total all construction volume in 2021 was down -1.1%. Residential volume for 2021 was up +10% while Nonresidential Bldgs volume was down -10% and non-building volume was down -7%. Jobs average over the year 2021 increased +2.3%. Volume was down -1.1%.
Current Inputs
U.S. Census Single-Family house Construction Index gained only 4% in 2020. The index is up 11.7% for 2021. The index has posted steady growth throughout 2021. Thru February 2022, over the last 4-5 months, the year/year rate of increase in this index has jumped from 12% yoy to 17% yoy. https://www.census.gov/construction/nrs/pdf/price_uc.pdf
Turner Construction Cost Index average annual for 2021 is up only 1.9% from 2020. That is unusually low, well below the range of 5% to 16% and the average of 9% for other nonresidential buildings indices. http://turnerconstruction.com/cost-index
Rider Levitt Bucknall nonresidential buildings index average for 2021 is up 4.8% from 2020. https://www.rlb.com/americas/
Mortenson’s cost index of nonresidential buildings data is posted through Q4 2021. The annual average inflation for 2021 is up 16% over 2020. https://www.mortenson.com/cost-index
RSMeans Nonresidential buildings index for 2021 is up 9.11%.
Engineering News Record (ENR) BCI inputs index for 2021 is up 10.0%. The BCI is up 5.3% year-to-date for the first 4 months of 2022.
Producer Price Index tables published by AGC show input costs to nonresidential buildings up about 18% for 2021. Final costs of contractors and buildings is up 5.3%. PPI Inputs for March show residential inputs up 8.2% and nonresidential buildings inputs up 12.6% ytd for 3 months. Also the average final demand increase cost for residential is up 16% and final demand cost for nonresidential bldgs is up 4.8% in the 1st quarter. https://www.agc.org/learn/construction-data
A caution here. AGC reports inflation for the year as the value reported in December of the year. Many others report the average inflation for all 12 months. These two reporting methods cannot be mixed. Construction Analytics has recently revised PPI data to reflect annual average inflation.
AGC April Construction Inflation Alert “The construction industry is in the midst of a period of exceptionally steep and fast-rising costs for a variety of materials, compounded by major supply-chain disruptions and difficulty finding enough workers—a combination that threatens the financial health of many contractors. No single solution will resolve the situation.”
New construction starts reported by Dodge thru Feb are up 15% over the same period in 2021, with residential at a new high and nonresidential near the previous high. Feb 2022 total was the highest level of new starts on record. High levels of activity often lead to higher levels of inflation.
Wage offerings are increasing (up 6% in 2021), productivity is declining (down 7% in last 4 years) and there are many instances of material shortages or delays in delivery (lumber, windows, roofing, cabinets, mechanical equipment, appliances, etc.). These issues are all present now and all work to increase inflation.
PPI INPUTS table updated 11-16-22
Steel Mill Products prices are up over 100% in 2021, but steel mill products includes all kinds of steel for all uses including automobiles and appliances. Construction uses slightly less than 40% of all steel and that is predominantly fabricated structural steel.
Fabricated Structural Steel prices are up 25% in 2021.
Here’s an example of how a PPI cost change affects the total final cost of the product installed. The mill price of steel is about 25% of the final price of steel installed. The other 75% of the cost is detailing, fabrication, delivery, lifting, labor and equipment for installation and markup. What affect might a steel cost increase have on a building project? It will affect the cost of structural shapes, steel joists, reinforcing steel, metal deck, stairs and rails, metal panels, metal ceilings, wall studs, door frames, canopies, steel duct, steel pipe and conduit, pumps, electrical cabinets and furniture, and I’m sure more. Assuming a typical structural steel building with some metal panel exterior, steel pan stairs, metal deck floors, steel doors and frames and steel studs in walls, then all steel material installed represents about 14% to 16% of total nonresidential building cost. Structural Steel only, installed, is about 9% to 10% of total building cost. The other 6% of total steel cost applies to all buildings. If mill price is up 100%, then subcontractor final cost is up 25%. With all steel representing 16% of total building cost then final cost of building would be up 4%.
Steel Prices Reach Levels Not Seen Since 2008 by The Fabricator
2021 Input costs for Residential and Nonresidential Buildings is the highest on record. Materials prices support high inflation into 2022. But some sources expect gains to moderate from 2021.
PPI FINAL DEMAND updated 11-16-22

For up to data 2022 PPI see Producer Price Index PPI Tables 2022
Inflation
Could a recession bring on deflation?
Deflation is not likely. Only twice in 50 years have we experienced construction cost deflation, the recession years of 2009 and 2010. That was at a time when business volume went down 33% and jobs were down 30%. In 2020, business volume dropped 7% from February to May. By October, volume reached a low for the year, down 8%. Volume of work seemed to be recovering in the first quarter of 2021, up 3% from the October low, but then struggled most of the year. As of December 2021, volume is still down 7% from the February 2020 peak and up only 2% from the 2020 low. Jobs dropped 14%, 1,100,000+ jobs, in two months! But jobs recovered all but 3% by December 2020. As of December 2021, jobs are down 2% from February 2020 peak. We have now gained back 1,000,000 jobs. But we gained back far more jobs than volume. That means it now takes more jobs to put-in-place volume of work. That increases inflation.
Here’s a list of some 2021 indices average annual change and date updated.
- +6.7% Construction Analytics Nonres Bldgs Mar
- +5.4% PPI Average Final Demand 5 Nonres Bldgs Dec
- +5.3% PPI average Final Demand 4 Nonres Trades Dec
- +1.9% Turner Index Nonres Bldgs annual avg 2021 Q4
- +4.8% Rider Levett Bucknall Nonres Bldgs annual avg 2021 Q4
- +16% Mortenson Nonres Bldgs annual avg 2021 Mar
- +11.7% U S Census New SF Home annual avg 2021 Dec
- +7.4% I H S Power Plants and Pipelines Index annual avg 2021 Dec
- +7.1% BurRec Roads and Bridges annual avg 2021 Q4
- +6.0% FHWA Fed Hiway annual avg 2021 Q4
- +9.11% R S Means Nonres Bldgs Inputs annual avg 2021 Q4
- +10.0% ENR Nonres Bldgs Inputs annual avg 2021 Dec
Take note of the top six indices reported here. They all represent nonresidential buildings final cost. The spread is from 2% to 16%, wider than ever seen in any other year. The average of these six is 6.7%.
Future Inflation Forecast
Typically, when work volume decreases, the bidding environment gets more competitive. We can always expect some margin decline when there are fewer nonresidential projects to bid on, which typically results in sharper pencils. However, when materials shortages develop or productivity declines, that causes inflation to increase. We can also expect cost increases due to material prices, labor cost, lost productivity, project time extensions or potential overtime to meet a fixed end-date.
After adjusting for inflation, total volume in 2021 is down 1.1%. Residential volume for 2021 is up +10% while Nonresidential Bldgs volume is down 10% and Non-bldg volume is down 7%.
Total volume for 2022 is forecast up only 1.7%. After adjusting for inflation, Residential volume for 2022 is forecast up only 2%. Nonresidential Bldgs volume is forecast up 4% and Non-bldg volume is forecast down 2%.
Volume declines should lead to lower inflation as firms compete for fewer new projects. However, aside from remarkable cost increases for materials, if jobs growth continues while volume declines, then productivity declines, and that will add to labor cost inflation. Since 2010, Construction Spending is up over 100%, but after adjusting for inflation, Volume is up only 31%. Jobs are up 41%.
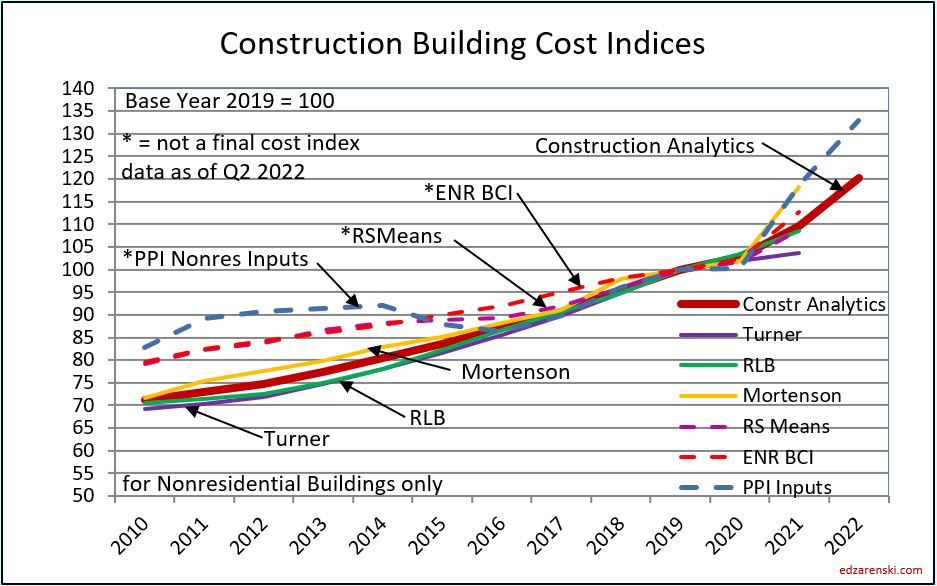
Notice in this next plot how index growth for ENR BCI and RSMeans, both input indices, is much less than for all other selling price final cost indices. From 2010 to 2020, Construction Analytics total final cost inflation is 103/71 = 1.45 = +45%. Input cost indices total inflation over the same period is only 103/79 = 1.30 = +30%, missing a big portion of the cost growth over time.
Nonresidential Buildings Selling Price Indices vs Input Indices updated 9-19-22

Several Nonresidential Buildings Final Cost Indices averaged over 5%/yr. in 2018 and 2019 and over 4%/yr. from 2015 to 2019 averaging +25% inflation for 5 years. Input indices that do not track whole building cost averaged only 12% inflation for those five years, much less than final cost growth. As noted previously, most reliable nonresidential selling price indexes have been over 4% since 2014. All dropped to between 2% to 3.5% in 2020.
Current and predicted Inflation rates updated 12-10-22:
- 2020 Rsdn Inflation 4.5%, Nonres Bldgs 2.6%, Non-bldg Infra Avg -0.3%
- 2021 Rsdn Inflation 13.9%, Nonres Bldgs 7.4%, Non-bldg Infra Avg 7.8%
- 2022 Rsdn Inflation 15.4%, Nonres Bldgs 12.2%, Non-bldg Infra Avg 13.6%
- 2023 Rsdn Inflation 6.0%, Nonres Bldgs 4.8%, Non-bldg Infra Avg 4.3%
Construction Analytics Building Cost Index updated 12-10-22

As of April 2022, not all nonresidential sources have updated their Q4 inflation index. A few are still reporting only 2% to 4% inflation for 2021, but several have moved up dramatically, now reflecting between +10% to +14%. One national resource is reporting only 1.9% inflation for 2021! The 2015-2023 table has been updated to include all Q1 2022 data where available. We can still expect some minor change to 2021 and future forecasts.
The tables below, from 2015 thru 2023, updates 2021 data and includes Q1’22 data when available and provide 2022-2023 forecast. The three major sector indices, highlighted, are plotted above. NOTE, in this table and these plots all indices are set to a base of 2019=100. All original data is gathered for all indices, but since all indices have different index dates (start in different years), all data is modified to a common base date, in this case 2019. That allows all indices to be easily compared. These indices are annual average index reported at midyear. All forward forecast values, whenever not available, are estimated by Construction Analytics using long-term avg.
Index Table updated 12-10-22 for older indices see Construction Inflation Index Tables + Links

How to use an index: Indexes are used to adjust costs over time for the effects of inflation. To move cost from some point in time to some other point in time, divide Index for year you want to move to by Index for year you want to move cost from. Example: What is cost inflation for a building with a midpoint in 2021, for a similar nonresidential building whose midpoint of construction was 2016? Divide Index for 2021 by index for 2016 = 111.7/87.0 = 1.284. Cost of building with midpoint in 2016 x 1.28 = cost of same building with midpoint in 2021. Costs should be moved from/to midpoint of construction. Indices posted here are at middle of year and can be interpolated between to get any other point in time.
Non-building infrastructure indices are so unique to the type of work that individual specific infrastructure indices must be used to adjust cost of work. The FHWA highway index increased 17% from 2010 to 2014, stalled from 2015-2017, then increased 15% in 2018-2019. During that time, the average of non-building indices would have given +12% from 2010-2014, +13% for 2015-2017 and +10% for 2018-2019. The IHS Refinery, Petrochemical plants index fell 10% from 2014 to 2016. In that same two-year period the IHS Pipeline, LNG index fell 25%. The CA Infrastructure composite index is useful only for adjusting the grand total cost of all non-building infrastructure.
Infrastructure Table updated 12-10-22

Volume of Work – The Impact of Inflation on Jobs
Volume is spending minus inflation.
Construction Spending drives the headlines. Construction Volume drives jobs demand. Total Volume is forecast flat to down over the next 12 months. Residential dips 4% then recovers to current level, nonresidential buildings volume increases 6% and Non-building infrastructure volume will fall 7%.
To differentiate between Revenue and Volume you must use actual final cost indices, otherwise known as selling price indices, to properly adjust the cost of construction over time.
When spending increases less than the rate of inflation, the real work volume is declining. In 2020, Nonresidential buildings spending was down 2%, but with 2.5% inflation, so volume was down 4.5%. The extent of volume declines impacts the jobs situation. In 2021, Nonresidential Buildings jobs increased by slightly less than 1%, but construction volume was down 10%. Total all construction jobs increased by 2.3%, but construction volume was down 1.1%. Jobs are supported by growth in construction volume, spending minus inflation. If jobs increase faster than volume, that adds to productivity losses and adds to inflation.
Many construction firms judge their business growth by the revenues passing through from all jobs under contract. The problem with that, for example, is that Nonresidential Buildings spending (revenues) are expected to grow 10% in 2022, but after adjusting for inflation the actual volume of work will be up by only 4%. By this method, in part, these firms are including in their accounting an increase in inflation dollars passing through their hands. Spending includes inflation, which does not add to the volume of work and does not support jobs growth.
Total volume for 2022 is forecast up only 1.7%. Residential volume for 2022 is forecast up 2.3%. Nonresidential Bldgs volume is forecast up only 4% and Non-bldg volume is forecast down 2.4%.
Construction Spending Current Dollars
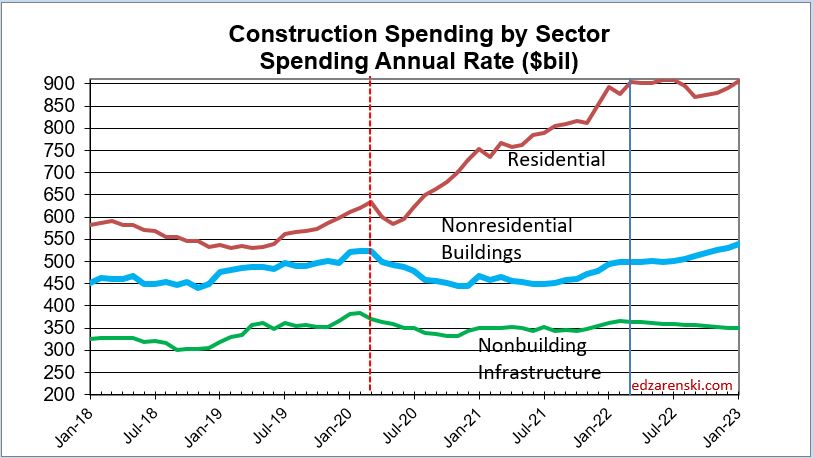
Spending includes inflation which does not add to the volume of work. Before we can look at the effect on jobs, we need to adjust spending for inflation. The plot above “Spending by Sector” is current dollars. The sector plot below is adjusted for inflation and is presented in constant $. Constant $ show volume. Notice future residential remains in a narrow range after adjusting for inflation.
Constant $ = Spending minus inflation = Volume
Residential business volume is no stranger to hefty increases in spending and volume. In three years 2013-2015, spending increased 57% and volume was up 35%. For 2020-2021, spending increased 42% and volume was up 20%. Although residential spending remains near this elevated level for the next year, volume growth slows down in the 2nd half of 2022. Residential spending is forecast up 13% for 2022, but a forecast for 11.7% residential inflation slows volume growth to 2.3% for the year.
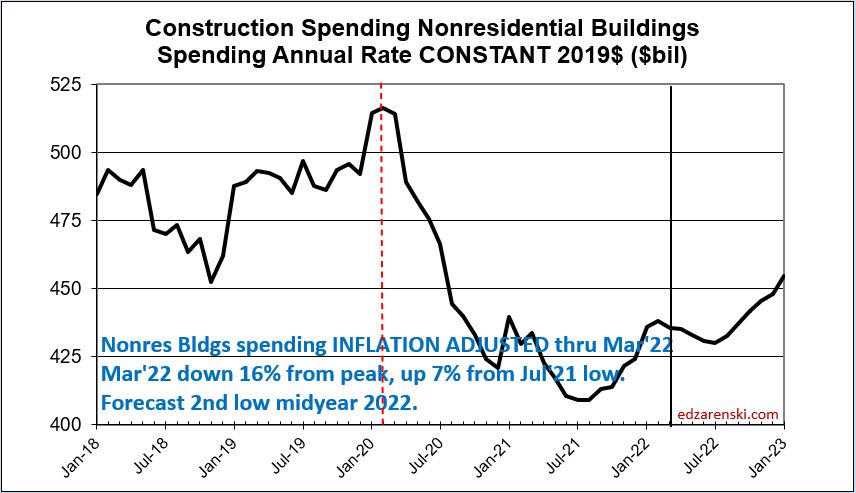
In January 2021, I had forecast by 3rd quarter 2021, nonresidential buildings volume would be 25% below the Feb 2020 peak. By 3rd qtr 2021 volume was down 21%. This follows the 20% decline in new starts in 2020. Most of the spending from those lost starts would have taken place in 2021. For 2022, spending is forecast to increase 10%, but inflation is forecast at 6%, resulting in volume growth of 4%.
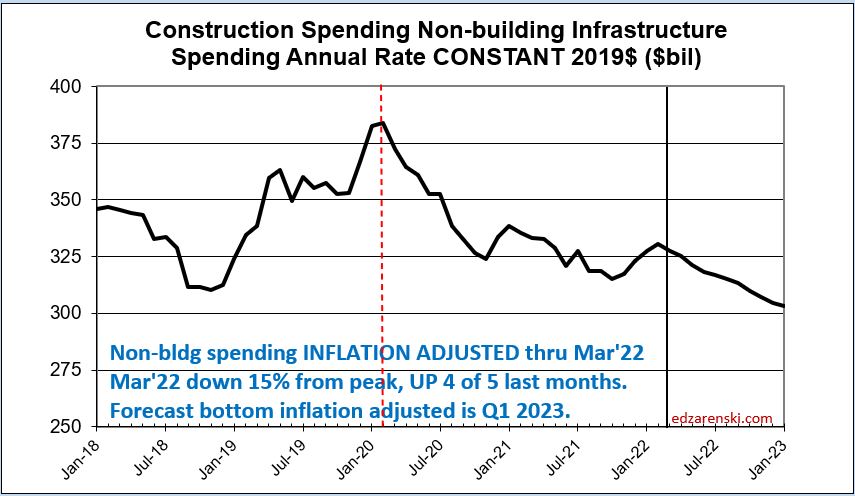
In 2021, nonresidential buildings volume dropped 10%. Non-building volume dropped 7%. In 2022, nonresidential buildings volume should climb 4% but non-building volume falls 2.4%. In fact, the forecast shows non-building volume still drops another 4% in 2023. Although Power plants posted a massive gain in starts in 2019, declines in pipeline starts offset some of that gain. Transportation, a source of long duration projects, is also contributing to that decline. Although transportation starts were up 16% in 2021, that follows a 33% decline in starts in 2020-2021.
Below is the non-building plot, inflation adjusted. Both the nonresidential buildings and the non-building plots show there has been no substantial increase since Feb 2020 in volume to support jobs growth, and there is little to no help in 2022.
Jobs are supported by growth in construction volume, spending minus inflation. If volume is declining, there is no support to increase jobs. Although total volume for 2022 is forecast up 1.7%, with Residential volume forecast up 2.3%, Nonresidential Bldgs volume up 4% and Non-building volume forecast down 2.4%, we will not see total construction volume return to Feb 2020 level at any time in the next three years. By the end of 2023 volume is still down 3% from Feb 2020.
Construction Jobs Growth
When we see spending increasing at less than the rate of inflation, the real work volume is declining. For example, with construction inflation increasing at 3% annually, a nonresidential building spending decline of -2% would reflect a work volume decline of 5%. The extent of volume declines would affect the jobs situation.
There is a difference comparing growth to same month last year versus comparing annual averages. For Dec’21 vs Dec’20, Residential jobs are up 75k, Nonresidential Bldgs up 61k and Nonbuilding up24k. But annual averages tell a much different story.
AVG 2021 vs AVG 2020, Rsdn+153k (+5.3%), Nonres Bldgs +28k (+0.8%), Non-bldg +9k (+0.9%).
Dec vs Dec simply compares jobs at 2 points in time, without the benefit of what occurred in the other 11 months of the year, so does not tell us what took place over the year. Total labor production for the year must take into account all months. The annual average gives a much clearer indication of jobs growth over the year because it accounts for the peaks and dips of all 12 months during the year.
Jobs average over the year 2021 increased +2.3%. After adjusting for inflation, total volume in 2021 is down -1.1%. Residential volume for 2021 is up 10% while Nonresidential Bldgs volume is down 10% and Non-building volume is down 7%. Those are remarkable nonresidential declines, not seen that deep since 2010.
If jobs are increasing faster than volume of work, productivity is declining. For example, nonresidential buildings volume declined 10%, but nonres bldgs jobs increase 0.8%. That’s a 11% swing in productivity. Since labor is about 30% to 35% of the cost of a project, if productivity declines by 11%, then inflation rises by 11% x 35%, or 3.8%. The most recent year drop in volume, while jobs increased, added 4+% to nonresidential buildings inflation for the year. But some jobs counted as Nonresidential actually work on residential construction, so the individual sector data is skewed and there is insufficient detail to count those jobs. Better to look at all volume vs all jobs.
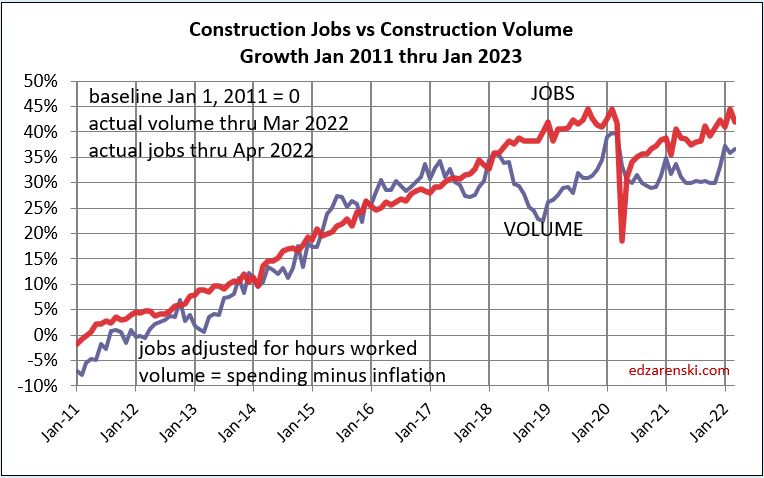
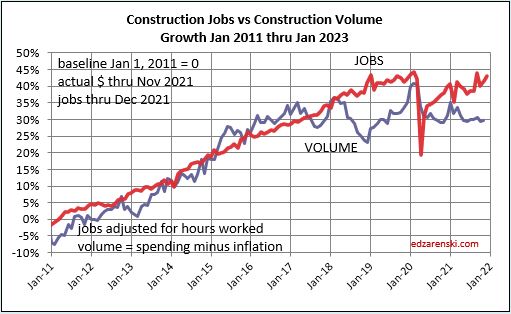
Jobs and Volume of work growth should move in tandem, as seen in the above plot from 2011 to Jan 2018. With exception of 2006, when jobs increased by 10%, but volume dropped by 5%, a negative impact 15% spread, similar to 2018, these plot lines have been moving in tandem like this, with minor differences, back to 1992. If jobs grow faster than volume, productivity is declining (a negative impact). When these plot lines grow wider apart with jobs above volume, that is a sign of a productivity decline. That loss of productivity for the workforce is a hidden aspect of inflation, not shown in pricing or wages.

Jobs are supported by growth in construction volume, spending minus inflation. Unless volume of work increases or job growth slows, by the end of 2022, volume will be lower than today.
What does that hidden loss of productivity for the workforce look like? How can we tell the magnitude of this impact on inflation when it is hidden, not seen in wages? It shows up in this following plot, the volume of work Put-In-Place per job.
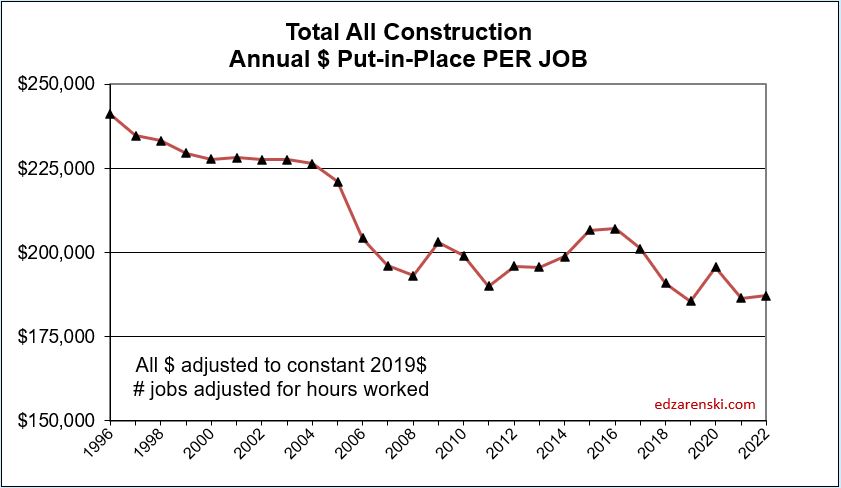
If jobs are increasing faster than volume of work, can we tell if it’s production employees or supervisory employees? BLS reports ALL construction jobs (~7.5million) and Production jobs (~5.5million). The difference between these two data sets is supervisory employees.
Looking at the average number of construction jobs in the last 4 years, the average of 2021 jobs vs the average of 2017 jobs, production jobs increased +5%, but supervisory jobs increased +12%.
In 2011, supervisory jobs was 24% of all construction jobs. Now it is 35%. Growth in supervisory jobs has had a greater negative impact than production jobs on the spread between jobs and volume.
In January 2021, I had forecast We will not see construction volume return to Feb 2020 level at any time in the next three years. Well, unprecedented residential growth outperformed with 10% volume growth in both 2020 and 2021. Nonresidential and non-building volume since Feb 2020 are down 15% to 16%. Total construction volume since Feb 2020 is still down 2.5%. It is expected to fall another 3% in 2022. And the forecast still shows total construction volume from Feb 2020 down 2% by the end of 2023. That is a difficult environment to see jobs growth.
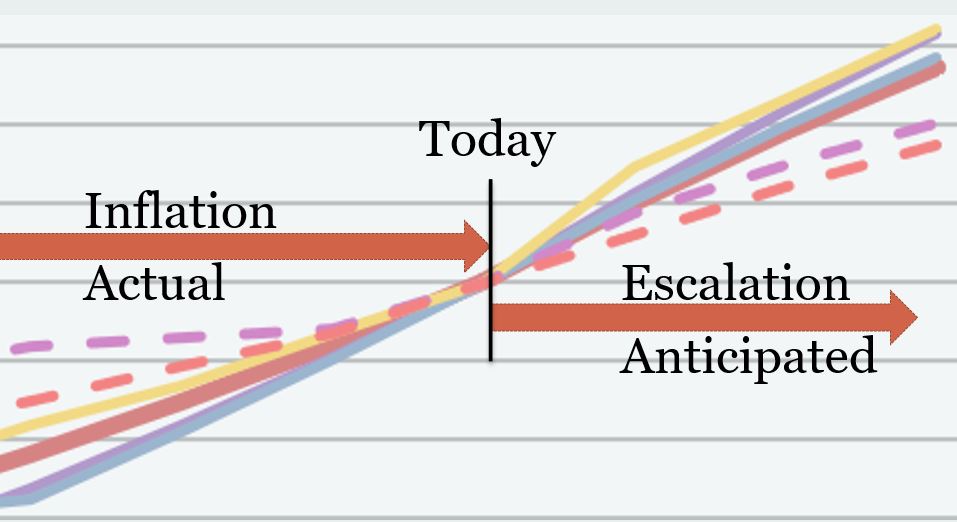
A final word about terminology: Inflation vs Escalation. These two words, Inflation and Escalation, both refer to the change in cost over time. However, escalation is the term often used in a construction cost estimate to represent anticipated future change, while more often the record of past cost changes is referred to as inflation. This graphic might represent how most owners and estimators reference these two terms.
Links to Articles and Data
The U.S. Census Single-Family house Construction Index
NAHB – Prices of goods used in residential construction
The Producer Price Index tables published by AGC
Construction Analytics Construction Inflation Index Tables for indices related to Nonbuilding Infrastructure work and for many more links to sources.
See this post on my blog Construction Economic Outlook 2022
Construction Jobs Report 2-4-22
On Feb 4, BLS released the January 2022 jobs report. With that report BLS revised jobs for all months back to 2017.
There were minor revisions in 2018-2019. The largest revisions were all in the last 15 months, all down, 30k to 50k jobs per month.
From Dec 2019 to Dec 2020, Construction lost 172,000 jobs. From Dec 2020 to Dec 2021, construction gained 171,000. Dec Jobs count is now back to where it was at the end of 2019.
A better indicator that picks up all the peaks and valleys throughout the year is the annual average. Annual avg we lost 237k jobs in 2020 and gained back 155k in 2021. So the total annual average for 2021 is still 82,000 jobs lower than the average for 2019.
Often overlooked, but equally as important, is the hours worked. Avg jobs from 2019 to 2021 were down 1.1%, but total hours worked is down 1.8%. Avg jobs in 2021 vs 2020 increased 2.3%, but total hours worked increased 2.1%.
ALL of the 155,000 construction jobs gains in 2021 were residential. There were no jobs gained in nonresidential buildings or non-building infrastructure (Heavy/Civil).
Actually, I would have expected even more jobs added to residential and more lost from nonresidential and civil. In 2021, Residential construction volume (spending minus inflation) was up 8%. Nonresidential Bldgs volume down 12%. Civil volume down 9%.
However, there are cross-over jobs classified as nonresidential that actually work in residential. For example, if you are employed by a subcontractor, steel, concrete, masonry, windows, drywall, flooring, roofing, etc., whose primary workload is predominantly nonresidential buildings, your entire firm and all employees are classified as nonresidential, even if you work on a multifamily high-rise. The classification does not change for some employees and does not change for some of the workload. The firm is classified based on the predominant type of work the firm performs.
Don’t jump through hoops trying to compare residential construction jobs to residential volume of work. There will always be hidden jobs data that you can’t uncover. Although residential jobs did not increase to match volume growth and nonresidential jobs did not decrease even though volume was down 12%, there is some part of those inconsistencies that is explained by nonresidential firms building residential buildings.


2021 Forecasts Comparison to 2021 Year-end Results
How did we do?
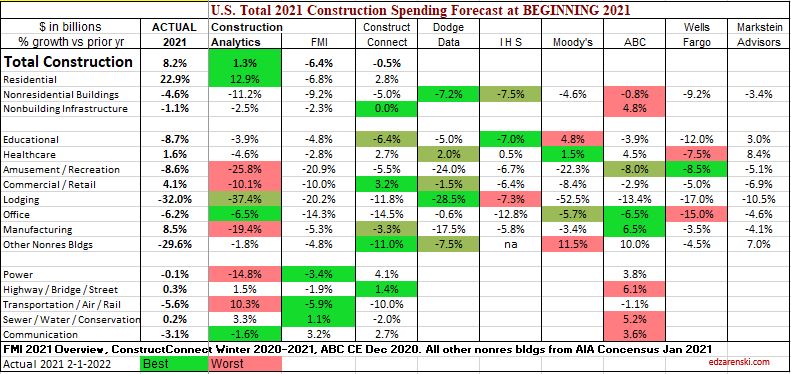
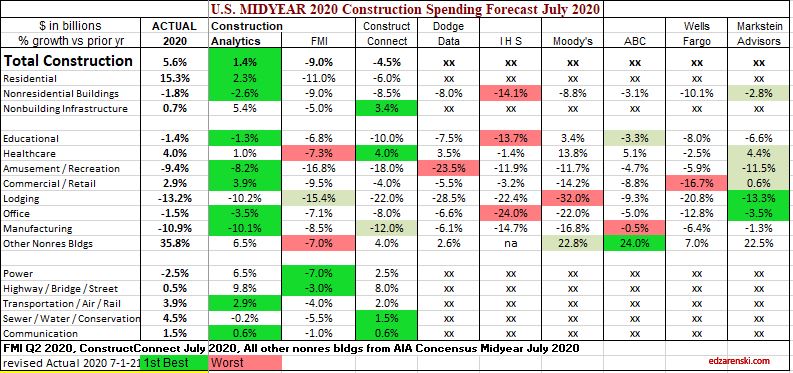
These colorful tables show the 2021 construction spending forecasts from 8 firms published in the January 2021 and July 2021 AIA Consensus Outlook. Construction Analytics (my forecast) Beginning year and Midyear forecasts are included for comparison. The actual spending year end published by U.S. Census on 2-1-22 is included. Forecast are highlighted in bright green (Best), dull green (2nd best) and red (worst).
FMI’s forecast is modified to move Transportation and Communication into the nonbuilding category to conform with other forecasts and also to conform with how Census reports these items. Other Nonres Bldgs is the total of Religious (15% of $) and Public Safety (85% of $) combined. Not all firms provide forecasts for residential or nonbuilding infrastructure.
All too often, forecasts are published but no one looks back to see how the actual results compared to the estimates. Also, looking at the Jan 2021 and Jul 2021 forecasts, you can see if and by how much each firm revised their estimate for the year.
This is the initial Census release of actual 2021 data. Results always get revised with the release of May data (July 1) in the following year. On July 1, 2022, any significant revisions to 2021 actual spending data will be revised and these table will be reissued.
Forecast at the Beginning of 2021
Forecast at MIDYEAR 2021
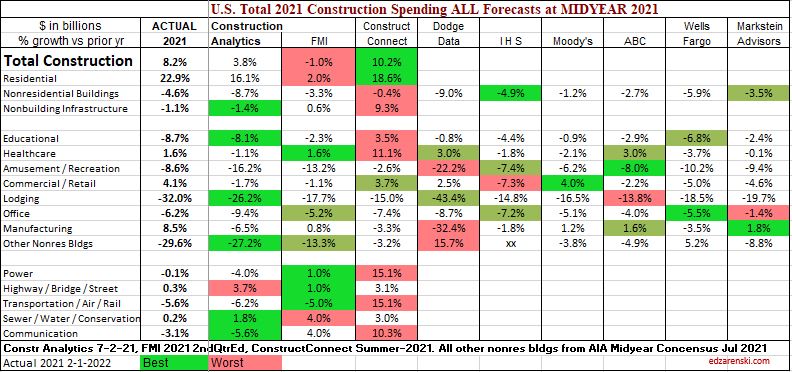
Construction Analytics (my forecast) didn’t fare so well in the 2021 Beginning of year forecast, but then did quite well in the Midyear forecast. My forecasts are based on cash flow of Dodge forecast of construction starts. When starts get revised, my forecast gets revised. Dodge revised the forecast of 2021 starts substantially after the beginning of the year, so that revised my forecast.
Below is the same data for AIA Midyear Outlook 2020 and my respective forecast at that time. My midyear forecast in 2020 had more best estimates than all other forecasts combined. Although it should be noted, no one got residential even close in 2020, I just happened to be least wrong.
Forecast at MIDYEAR 2020
A word on averages. Generally, the more inputs to an average, the closer the average will be to accurate. But it’s probably worth your while to take a look at the spread between forecasts on any particular line item. When you see 7 out of 8 estimates within a tight range of 5 points, and then one varies by 30 pts., it might be a good idea to question the validity or throw out the outlier.
Also, recognize that the Midyear forecast is a much different animal than the Beginning of Year forecast. At midyear, we already have 5 or 6 months of actual data to influence the value of the forecast at the end of the year. If we have 6 months of actual data that is already UP 10% year-to-date, and a forecast predicts the year will end DOWN 10%, each of the final 6 months of the year would need to come in at -30%. I wrote about that in detail several times last year. See https://edzarenski.com/2021/10/01/construction-spending-update-10-1-21/
