Home » Behind the Headlines (Page 16)
Category Archives: Behind the Headlines
Construction Jobs – Behind The Headlines
10/13/16
Headline comparisons we read are often what happened this month versus last month or year-to-date versus last year. For comparisons to construction spending and jobs it is perhaps beneficial to look at recent and longer term trends. Here I will discuss construction jobs growth versus spending growth and highlight some of the pitfalls when comparing these values for productivity.
The most talked about reason for slower jobs growth is the lack of experienced workers available to hire. In fact, recent surveys indicate about 70% of construction firms report difficulty finding experienced workers to fill vacant positions. That certainly cannot be overlooked as one reason for slower jobs growth, but that is not the only reason?
Even with all this talk of difficulty finding experienced construction workers, there has been very good jobs growth. For the 5 ½ year period from the bottom in January 2011 to the present (August 2016) we added 1,240,000 construction jobs.
- Jobs increased by 23% in 5 ½ years with peak growth in 2014 and 2015.
- For the two years 2014+2015 we added 650,000 jobs, the largest number of new jobs in two years since 2004+2005.
In 2014-2015, jobs expanded by 11%, the highest number of jobs in a two-year span since 2004-2005 and the fastest two-year percent growth since 1998-1999. Peak growth was 6.1% in 2014 with slower growth in 2015. I expect even slower growth in 2016.
- For the 6-month period including Oct’15 thru Mar’16 construction gained 214,000 jobs, the fastest rate of consecutive months jobs growth in 10 years. Then, after 3 months of losses, July shows a modest gain.
Jobs growth from October 2015 through March 2016 was exceptional, 214,000 construction jobs added in 6 months, topping off the fastest 2 years of jobs growth in 10 years. That is the highest 6-month average growth rate in 10 years. That certainly doesn’t make it seem like there is a labor shortage. However, it is important to note, the jobs opening rate (JOLTS) is the highest it’s been in many years and that is a signal of difficulty in filling open positions.
I would expect growth like that to be followed by a slowdown in hiring as firms try to reach a jobs/workload balance, after such a robust period of jobs growth. It appears we may have experienced that slowdown. Jobs have been down four of the last six months and up most recently.
- Q2’16 jobs declined all 3 months. Keep in mind, this immediately follows the fastest rate of jobs growth in 10 years. But it also tracks directly to three monthly declines in spending. (I predicted this jobs slowdown in my data 9 months ago. I predicted the 1st half 2016 spending decline more than a year ago).
It is not so unusual to see jobs growth slowed in the 2nd quarter. It follows directly with the Q2 trend in spending and it follows what might be considered a saturation period in jobs growth. The last two years of jobs growth was the best two-year period in 10 years. It might also be indicating that after a robust 6 month hiring period there are far fewer skilled workers still available for hire. The unemployed available for hire is the lowest in 16 years.
Construction spending hit bottom at the same time as jobs, the 1st quarter 2011. For the same 5 ½ year period, Jan 2011 to Aug 2016, construction spending increased 52%, far more than jobs growth. For 2014+2015, spending increased close to 11% per year, the fastest spending growth in more than 10 years.
- For the same 6-months, Oct’15 thru Mar’16, Q4’15 spending was flat but by the end of Q1’16 spending had increased more than 4% in 6 months, to an annual rate of +8%.
- 2nd quarter 2016 spending came in 2% below 1st quarter.
- Total 1st half spending finished 7.2% above the 1st half 2015.
Although spending slowed in the 2nd quarter this year, in part it’s because the 1st quarter was so strong. They combined for a strong 1st half up 7.2% over last year.
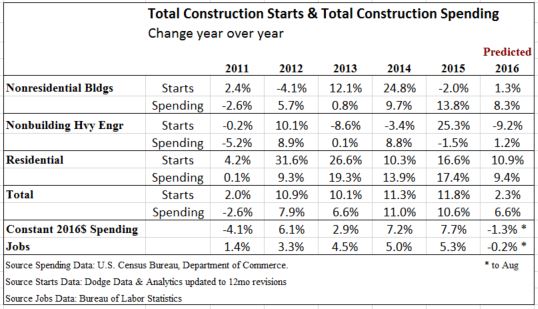
Why is it that jobs don’t increase at the same rate as construction spending? Because much of that spending growth is just inflation, not true volume growth. Volume is construction spending minus inflation. To get volume we need to convert all dollars from current $ in the year spent into constant $ by factoring out inflation.
- Jobs growth should not be compared to spending growth.
- Spending increased 52% from Jan/Feb 2011 to Jul/Aug 2016.
- After adjusting for inflation from Q1 2011 to Q3 2016, we find that construction volume increased by 28% in 5 ½ years.

So, it looks like volume (+28%) still increased much more than jobs (+23%) in the same period and this would indicate increasing productivity. But this still is not the whole picture. Jobs need to be adjusted.
- Jobs needs to take into consideration the hours worked.
Before the dramatic decline in jobs from 2007 through 2010, hours worked ranged between 37hrs/wk and 38hrs/wk. But by 2015, and into 2016, hours worked has been consistently over 39hrs/wk. So not only did the workforce grow by 1.24 million jobs (+23%), but also the entire 7.0 million work force is working about 4% more hours/week. This must be considered to get net jobs, or work output.
- After adjusting for hours worked from Q1 2011 to Q3 2016, we find that net jobs growth increased by 28% in 5 ½ years.

- Since Q1 2011 the constant $ value of construction spending increased by 28%.
- Since Q1 2011 Jobs/hours worked output also increased by 28%.
Since Jan 2011, volume increased 28% and workforce output increased 28%, for a net productivity balance, but in 2011 we had a significant productivity loss and a smaller loss in 2013. The huge 2011 productivity loss is probably in part explained by the resumption of hiring after historic job cuts, particularly in 2009 when the work force was cut 16% but, while spending declined by 16%, work volume declined only 11%, which may have overshot the balance mark. That helps account for the huge productivity gain in 2009, but also leads to the losses in 2010 and 2011.
From Jan 2014 to Dec 2015 volume increased by 15% and workforce output increased by only 10.5%. Total hours worked compared to total constant value of spending shows productivity increased for those two years. Historically, we should not expect to see productivity growth continue for a third year and as of August it is down year-to-date.
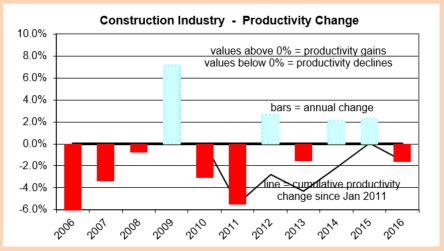
I expected to see a turn-around in jobs growth in the 2nd half of 2016, and so far, for the 3-month period July-Sept we’ve added 34,000 jobs. That’s starting out perhaps a little slower than I thought. For much of 2014 and 2015 volume growth was exceeding jobs growth, but for 10 months from August 2015 through May 2016, volume growth mostly stalled and jobs growth, which just had 6 months of record high growth, exceeded volume growth by 3%. Only in the last few months has volume growth begun to outpace jobs growth again. But I suspect it is this slow down in real volume growth that has led to slow jobs growth. This leads me to think if spending plays out as expected into year end 2016, then construction jobs may begin to grow faster in late 2016. However, availability could have a significant impact on this needed growth.
Availability already seems to be having an effect on wages. Construction wages are up 2.6% year/year, but are up 1.2% in the last quarter, so the rate of wage growth has recently accelerated. The most recent JOLTS report shows we’ve been near and now above 200,000 job openings for months. With this latest jobs report, that could indicate labor cost will continue to rise rapidly.
As wages accelerate, also important is work scheduling capacity which is affected by the number of workers on hand to get the job done. Inability to secure sufficient workforce could impact project duration and cost and adds to risk, all inflationary. That could potentially impose a limit on spending growth. It will definitely have an upward effect on construction inflation this year.
For all of 2016 and 2017, I predict construction spending will increase about 15%, BUT after inflation construction volume will increase only about 6% to 7%, most of that in 2017. For all of 2016 and 2017, I predict jobs will grow by 350,000 to 450,000, only about 5% to 6%.
Reference Source Information:
U.S. Census released August Construction Spending 10-3-16
BLS released the September jobs Report 10-7-16
Reference Posts:
Construction Jobs Show 3rd Qtr Growth
Construction Jobs – Is July a Turning Point?
BLS Says +790,000 Construction Jobs by 2024. Let’s Look Behind The Headlines.
In a report released December 8, 2015 the Bureau of Labor Statistics (BLS) predicts jobs growth for industries. Construction is pegged as a leader with expected 790,000 new jobs from 2014 to 2024. Robert Deitz at NAHB provides a good summary of the BLS report.
Let me provide a few historical averages and break this down so we can see how it stacks up.
The prediction period is from 2014 through 2024, so all of 2014 is already in the BLS baseline. The average number of construction jobs in 2014 was 6,138,000 and BLS uses that baseline. BLS says 2024 will average 6,928,000 construction jobs, growth of 790,000 jobs over 10 years, from which we can infer 12.9% growth in 10 years or a 1.22% compounded growth rate.
In 2015 we’ve already gained 215,000 ytd through November. The average jobs for 2015 is currently 6,390,000, so that leaves 540,000 expected over the remaining 9 years. That would imply a growth rate of 8.5% in 9 years or an average compounded growth rate of only 0.9% per year.
Now here is where it gets interesting.
Spending growth is predicted by several firms between 5% and 10% per year for the next 4 years. My own forecast has 2016 growth at 11%. Average of forecasts for the period 2016-2019 are currently 8%, 7.5%, 6% and 7%.We need to take out inflation to get real volume growth, so we will assume 4% inflation per year for the next 4 years. Long term construction inflation is 3.5% per year, but in rapid growth years it has reached 6%-8% per year. For the period 2013-2015 construction inflation averaged 4%. Adjusting for inflation at 4% results in volume growth for 2016-2019 at 4%, 3.5%, 2% and 3%. This is much faster growth than the BLS average, so we will remain more conservative in this analysis.
Historical volume growth over the last 22 years is grossly distorted by the recession. Volume declined in 8 of those 22 years. In the three worst three years of the recession, 2008, 2009 and 2010, volume declined by 28%. When we take out those three years the typical growth period averages are more apparent. The historical average volume growth in construction with recession data removed and after adjusting for inflation is 2% per year for 19 years.
Jobs growth over the last 20 years averaged 1.6% per year, even when we include the catastrophic losses during the recession years of 2007 through 2010. The BLS is predicting 1.22% growth for 10 years, lower than the average with a recession. Without the four worst recession years of job losses the average growth jumps to 3.7% per year, almost triple the BLS predicted growth. Minus the recession years, there has never been a prolonged period where jobs growth has averaged growth less than 2% per year, so we shouldn’t expect such low growth.
BLS assumes productivity will increase 1% per year. This would lower the number of jobs needed. Construction productivity has never done this before. My records show over the last 20 years there has not even been two consecutive years of construction productivity increases. Long term productivity in the construction industry has declined by 1% per year. Data would indicate jobs growth must be greater than volume growth to make up for productivity losses.
We have differences based on my analysis of historical growth and productivity. Forecasts show expectations of rapid growth in the next few years. These differences would produce dramatically different estimates of jobs growth in coming years. How much different? Let’s see.
Let’s be conservative with assumptions. Based on:
- No productivity increases or losses. Therefore jobs will grow at the same rate as volume.
- Volume growth of 1.5% per year will be less than forecast and less than the historical non-recession average. This allows for some years to decline.
- There will be no recession, but there will be down years.
- Starting from 2015 baseline of 6,390,000 jobs
Jobs need to grow at 1.5% per year compounded for 9 years. That’s 14.3% in 9 years from the 2015 baseline of 6,390,000. Growing 14% in nine years adds 895,000 jobs by 2024. We’ve already gained 215,000 jobs in 2015. For the period of the BLS analysis, my conservative prediction is a total gain of 1,110,000 jobs over 10 years, 320,000 more than the BLS prediction.
Jobs reached a peak in 2006-2007 at 7,700,000. At conservative growth rates we will not reach the previous peak by 2024. However, if construction volume and jobs growth follow a little more closely to historical 20 year patterns, we will add 1,300,000 jobs from 2014 to 2024, but still be short of the previous peak. This scenario adds 500,000 to the BLS prediction.
If volume growth does reach forecast levels and if jobs growth does include some losses in productivity then my estimate for jobs is double BLS and we could reach the previous peak in jobs several years earlier.
Construction Spending or Construction Starts – Media Headlines That Get it Confused
Here’s a headline published recently.
“Construction spending rose year-over-year during first 9 months of 2015”
What they really meant to say
“Construction STARTS rose year-over-year during first 9 months of 2015”
Why make a big deal out of this. Well, here’s an example. The brief states “nonbuilding work climbed 35%” during the first nine months of 2015 compared to same months 2014. TRUE, if we look at new construction STARTS, but construction spending for non building work is down 2.5% during the first 8 months of 2015 vs 2014 (Sept spending won’t be available until November 2nd).
Construction starts help us understand where future spending is headed. Construction spending is based on how much is occurring this month from all the projects that started in the previous 12 to 30 months.
Let’s use an example to understand new construction starts vs construction spending:
Assume:
All the nonresidential building projects that start in a given month have a schedule duration of 20 months.
The total starts in this month is $60 billion.
Over a duration of 20 months they will average a put-in-place construction spending of 60/20 = $3 billion a month. Spending follows a typical bell curve, starts out slow, gets real strong in the middle and finishes slow. The spending cash flow from these new starts will begin slowly at a rate of perhaps $1 to $2 billion/month, it will peak in about 10 to 12 months at perhaps $4-5 bil/mo, and then will taper to the finish again at about $1-2bil/mo. It will take 20 months to spend this $60 billion in new starts from this single month.
The point here is this: Current spending is based on the last 2 to 3 years of starts. New starts will generate the next 2 to 3 years of spending. Don’t get the two confused. Big increases in new starts is not telling us how much spending is going on right now, it’s telling us how much spending to expect in the future. And to get the real picture of what to expect in the future we need to look at the cumulative cash flow that occurs in any given future month from all the previous starts that are still ongoing. Furthermore, the construction starts values that are published every month represent a sampling of new construction activity, approximately 50% to 60% of total construction activity. While the total reported construction starts for a year might be $500 to $600 billion, the total spending in that year will be more like $1.0 to $1.1 trillion.
 Construction Analytics