Home » Behind the Headlines (Page 15)
Category Archives: Behind the Headlines
Infrastructure – Ramping Up to Add $1 trillion
1-30-17
How long would it take to accommodate adding $1 trillion of new infrastructure construction spending?
I read this in another recent article on the topic; “If passed, the ripple effect of an estimated $100 billion a year in new infrastructure construction would undoubtedly be felt throughout the industry.”
The article seems to imply the industry could absorb $100 billion in new infrastructure work and maintain that $100 billion added spending for 10 years. The infrastructure sector could not accommodate that massive amount of instantaneous growth. Let’s look at maximum historical rates of growth to understand why.

To really understand construction growth rates we need to look at all historical spending in constant dollars (inflation adjusted).All constant dollars in this analysis are converted to 2016$.The following spending historical data goes back to 1993. Jobs data goes back to 1970.
- Construction Industry total spending fastest rates of growth:
- Maximum growth one year, 2015, +$107 billion, in 2016$= $87 billion
- 2011 – 2015, 4 yrs, +$324 billion, in 2016$ = +$240 billion = $60bil/yr.
- 1995 to 1999, 4 yrs, +$200 billion, in 2016$ = +$200 billion = $50bil/yr.
- Infrastructure Sector spending fastest rates of growth:
- Maximum growth one year, 2007, +$40 billion, in 2016$= $36 billion
- 2005 – 2008, 3 yrs, +$87 billion, in 2016$ = +$52 billion = $17bil/yr.
- 1997 – 2001, 4 yrs, +$50 billion, in 2016$ = +$46 billion = $15bil/yr.
- Construction Industry Jobs fastest rates of growth:
- Maximum growth one year, 1999, 397,000 jobs
- 4 years from 1995 to 1999, average 317,000 jobs/year.
- 3 years from 2012 to 2015, average 266,000 jobs/year.
- Infrastructure Sector Jobs fastest rates of growth:
- Maximum growth one year, 2004, 65,000 jobs
- 3 years from 2003 to 2006, average 48,000 jobs/year
- 3 years from 2011 to 2014, average 26,000 jobs/year
The fastest one-year growth for the entire construction industry is $87 billion in 2015, but the fastest growth rate is never maintained for long. The period 2011-2015 is the highest average rate of growth at $60 billion/year. The entire industry has had jobs growth of more than 300,000/year only 6 times since 1970. 1995 to 1999 is the only period to average over 300,000 jobs/year longer than 2 years.
Infrastructure is only 25% of all construction work. The entire construction industry best growth rate ever achieved (in 2016$) absorbed $1 trillion in new spending over 5 years. Infrastructure has not absorbed $1 trillion newly added work in 25 years. The fastest one-year growth for the Infrastructure sector is $36 billion in 2007, but the highest average rate of growth is $17 billion/year. The current rate of growth since the recession is $10 billion/year.
The infrastructure sector has had jobs growth of more than 40,000/year only 3 times since 1993. Maximum jobs growth hit 65,000 in 2007. The best average jobs growth is 48,000 jobs/year and that has not occurred in the last 10 years. It’s the only period with average growth more than 26,000 jobs.
Let’s assume the fastest rates of growth can be duplicated once again. Let’s also assume that longer term growth will come closer to the long term average highs. So, infrastructure growth might reach $36 billion in a given year but could fall back to an average growth of $17 billion/year. Jobs could grow by 65,000/year but would probably average less than 48,000/year.
However, even with the addition of a new influx of infrastructure work, most of the other growth, which has been fairly constant for the last 25 years, is not going to go away. Since the recession, infrastructure has been increasing at $10 billion/year and jobs have been increasing 20,000/year. Assuming we maintain that level of normal infrastructure growth, then the remainder is what we might expect to accommodate in growth from new infrastructure stimulus.
If we could achieve maximum rates of growth we could increase infrastructure additionally through new stimulus by $26 billion/ year and increase jobs by 45,000/year.
If we could maintain long term best average rates of growth we could increase infrastructure through new stimulus by $7 billion/year and increase jobs by 28,000/year. Even if a portion of the normal growth goes away, it looks like the infrastructure sector could only accommodate adding about $10 billion/year in new stimulus work.
It must be noted that a large portion of infrastructure spending is private work, not publicly funded. Power is 90% private, 10% public. Highway is 100% public. Transportation is 30% private, 70% public. Sewage, Water and Conservation are 100% public. Communication is 100% private.
Fully 35% of all infrastructure work is private. Most of the huge increases in spending over the years are associated with the Power market. So this analysis counters any argument that publicly funded infrastructure can grow much faster. In fact, if only public works were taken into account, spending targets here would need to be reduced by 35% and the total duration to complete would be increased by 50%.
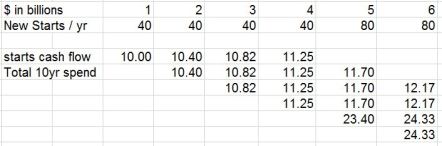
A cash flow schedule of all newly added work provided the plan needed to balance spending. All new work is assumed to take 4 years to complete. In the first year, $40 billion of new work starts, but only $10 billion gets spent. Spending flows at the rate of $10 billion/year for 4 years. New starts are added at a rate to continuously increase spending by $10 billion/year. By the 5th year we need to add $80 billion in new starts to get $20 billion in spending since all of year 1 work is now completed.
This table gives an indication of how cash flows. The full 13 year table is below.
I have assumed that inflation will add 4%/year to future spending. Five years from now the equivalent to adding $10 billion a year will be $12.2 billion a year. Due to inflation, we would spend $1 trillion to build the equivalent of $750 billion in today’s dollars. Increasing spending by the inflation adjusted equivalent of $10 billion per year, it would take 12 to 13 years to spend $1 trillion.
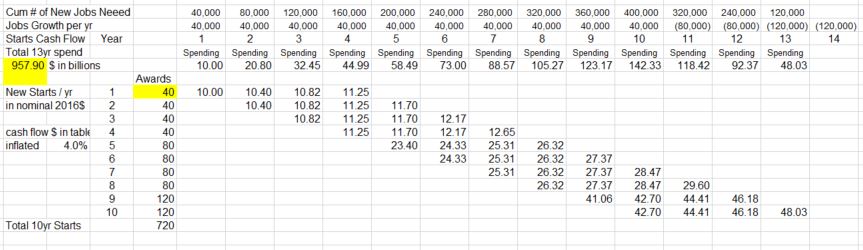
This scenario would push total infrastructure spending to the highest rates of long term growth on record. It’s not very likely growth like that could be sustained for very long. So, it’s possible total growth would fluctuate yet that we still keep our sights on achieving those long term growth rates. This allows for no economic downturn at any time in the next 10 years.
Another restraint to maximum growth rates is jobs. Infrastructure is only 25% of all construction. Maximum all construction jobs growth has exceeded 300,000/year a few times, but infrastructure jobs have increased by more than 40,000 only rarely and only once averaged over 40,000. While it takes about 5,000 to 6,000 workers to put-in-place $1 billion in construction, it takes only about 3,000 to 4,000 workers to put-in-place $1 billion of infrastructure. To reach maximum growth of $36 billion in infrastructure would require 110,000 to 140,000 new jobs per year, two to three times the long term growth. This analysis does not take into consideration any shortfall in jobs due to labor availability.
Setting spending growth to $10 billion/year results in 10 years of continuous record jobs and spending growth. Expectations of increasing infrastructure spending (not to be confused with starts) by $40 billion/year or $50 billion/year have not taken into consideration the maximum sustained growth rates in the industry. Talk of increasing infrastructure spending by $100 billion in a year is fantasizing.
added 2-2-17
In recent reading I came across a comment that both Educational and Health Care markets potentially could be included in Infrastructure funding. I take that to mean the public portion of those markets. Educational could be considered infrastructure and is 80% public ($70/$88bil). I would guess also Public Safety and Public Power could be included. Educational public spending is $70 billion/year. The others are $8 billion each. The short version of all the explanation above is that new infrastructure investment can grow a market at about half of the best total long term average growth of 10%/year. So these markets could absorb growth of about 5% or about $5 billion/year more.

More about Infrastructure written 3-6-17 Calls for Infrastructure Problematic
Behind The Headlines – Construction #s
1-28-17
Stuff you won’t read in the headlines.
- Total Construction spending for the last 3 months is at a 10 year high. However, in constant inflation adjusted dollars, construction spending is still 16% below 10 years ago. Are We at New Peak Construction Spending?
- In the last 36 months, there were 16 Census construction spending releases that initially showed a decline vs the previous month. Five months showed a decline vs the previous year. After revisions every month was revised up from the original posted amount. There remained only 2 significant mo/mo declines. There were no remaining year/year declines. Construction Spending Gets Revised UP
- Nonresidential Bldgs new starts (by Dodge Data) in the 2nd half of 2016 posted the best #s since the pre-recession boom. New Construction Starts 2016
- Nonresidential construction spending within the year is far more dependent on construction starts from previous years than on new starts within the year. Only 20%-25% of all spending within the year comes from new starts within the year. Behind The Headlines – Construction Backlog
- If Nonresidential New Starts for 2017 fall short of projections by 10%, it would reduce total 2017 nonresidential spending by 2.0% to 2.5%.
- 25% of all spending on nonresidential bldgs in 2017 comes from projects that started in 2015.
- 25% of all spending on non-building infrastructure in 2017 comes from projects that started between July 2014 and May 2015. That unusually high period contributes more to 2017 spending than all new infrastructure starts in 2017. Infrastructure Outlook 2017
- Monthly rate of spending for nonresidential bldgs will reach a new all-time current dollar high by midyear 2017. Behind The Headlines – Nonres Bldgs Construction Spending
- In constant inflation adjusted dollars, 2017 nonresidential bldgs spending will still be lower than any year from 1995 to 2009, 16% below the 2000 peak. Behind The Headlines – Nonres Bldgs Construction Spending
- New construction starts in 2016 for Office buildings as compared to 2015 went from -1% year-to-date in July to +30% ytd in September. Good example that we need to be careful because monthly variation sometimes messes up those comparisons. New Construction Starts 2016
Behind The Headlines – Construction Backlog
1-16-17
tables updated 2-1-17
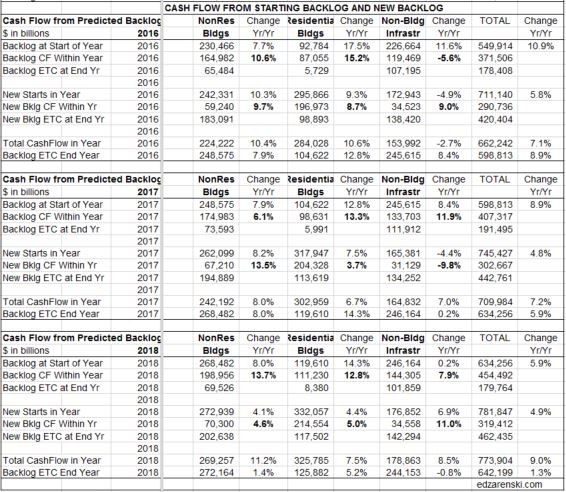
New Backlog is the total value of project revenues under contract that are about to start construction, or new starts. The entire value of a project is considered in backlog when the contract is signed. Projects booked in December 2016 or before are in backlog at the start of 2017. Simply referencing total backlog does not give a clear indication of spending within the next calendar year. Just because backlog is up going into a new year does not necessarily mean revenues will be up that year. You must understand some very important distinctions about backlog to determine how much revenue will occur within the next year.
Projects, from start to completion, can have significantly different duration. Whereas a residential home may have a duration of 8 or 9 months, an office building could have a duration of 18 to 24 months and a billion dollar infrastructure project could have a duration of 3 to 4 years.
Backlog at the start of 2017 could include revenues from projects that started last month or as long as several years ago. For a project that has a duration of several years, the amount in starting backlog at the beginning of 2017 is not the total backlog amount recorded for the project at its start date, but is the amount remaining to complete the project or the estimate to complete (ETC).
The only way to know how much of total backlog that will get spent in the current year and following years is to prepare an estimated cash flow from start to finish for all the projects that have started in backlog. Then add up the amounts from all projects in each month to find the cumulative cash flow in that month, or in that year.
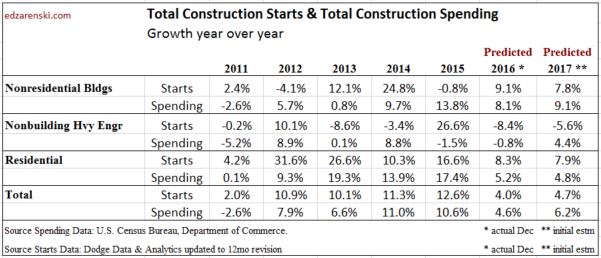
Construction Starts provide the values entering backlog each month. Except for residential, new project starts within the year contribute a much smaller percentage to total spending in the first year than all the backlog ETC on the books at the start of the year. New residential projects contribute the most to spending within the year started because generally residential projects have the shortest duration. Residential projects started in the first quarter may reach completion before the year is over. New infrastructure projects generally have the longest duration and may contribute some share of project value to backlog spread over the next several years.
The distinction between backlog, backlog ETC and cumulative cash flow is necessary to predict spending. For example:
We start the year with $100 billion of residential projects in backlog and $100 billion of infrastructure projects in backlog. All of the residential projects could have durations of 12 months or less. Therefore residential spending could total $100 billion within the year. However, the infrastructure projects could have durations of 2 years, 3 years or 4 years. Spending from infrastructure backlog this year might total only $50 billion with $30 billion in spending occurring next year and $20 billion the following year. Although both sectors start the year with the same total amount in backlog, we can see the amount spent within the year is determined by the duration of the projects and the cash flow schedule.
Backlog totals may not be a good indicator of total revenue spending within the year. In fact, backlog could be up and total revenues for the year could end up lower than the previous year. Unless you have a clear picture of the types and duration of projects that make up the backlog, you will not have a clear picture of spending activity in the coming year.
See Also Construction Backlog 2017 3-21-2017
Are We at New Peak Construction Spending?
1-4-17
Total construction spending peaked in Q1 2006 at an annual rate of $1,222 billion. For the most recent three months it has averaged $1,172 billion. It is currently at a 10 1/2 year high at just 4% below peak spending. But that ignores inflation.
In constant inflation adjusted dollars spending is still 18% below the Q1 2006 peak.
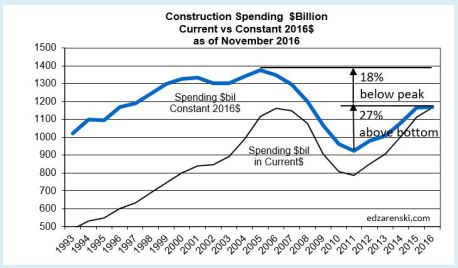
Current headlines express exuberance that we are now at a 10 1/2 year high in construction spending but fail to address the fact that is comparing dollars that are not adjusted for inflation.
In the 1st quarter of 2006 total spending peaked at a annual rate of $1.2 billion and for the year 2006 spending totaled $1,167 billion. We are within a stone’s throw of reaching that monthly level and 2016 will reach a new all-time high total spending by a slim fraction. But all of that is measured in current dollars, dollars at the value of worth within that year, ignoring inflation.
Adjusting for inflation gives us a much different value. Inflation adjusted dollars are referred to as constant dollars or dollars all compared or measured in value in terms of the year to which we choose to compare. To be fair, we must now compare all backdated years of construction to constant dollars in 2016. What would those previous years be worth if they were valued in 2016 dollars?
By mid-2017 total construction spending will reach a new all-time high, but in constant inflation adjusted dollars will still be 17% below 2006 peak. We will not reach a new inflation adjusted high before 2020.
Residential construction spending is still 32% below the 2006 peak of $690 billion. In constant inflation adjusted dollars it is 39% below 2006 peak.
Nonresidential Buildings construction spending is only 3.5% below 2008 peak of $443 billion. However, in constant inflation adjusted dollars it is 18% below 2008 peak.
Non-building Infrastructure construction spending pre-recession peaked in 2008 at at an annual rate of $290 billion. However, post recession it peaked in Q1 2014 at $314 billion. It is now 8% below the 2014 peak. In constant inflation adjusted dollars it is 12% below the 2014 peak.
For more on inflation SEE Construction Cost Inflation – Midyear Report 2016
Saturday Morning Thinking Out Loud #6
Just a few thoughts on forecasting construction spending
If we look at actual data through September, with ~75% of the actual annual construction spending already in the year-to-date and only 25% of annual spending in the estimate to complete in the 4th quarter, if forecasts for year-end totals are not already within 2.5% of the final, that means the projections for the final quarter are off by more than 10%.
Cash flows from construction starts are the strongest predictor of total spending next month. Projects that already started are in backlog. Backlog is used to develop projections for spending. For next month we already have 96% of all work in backlog. The remaining 4% will be new starts next month. For two months out we have 92% and for three months out we have 88% already in backlog. So, the uncertainty on spending in the near term is pretty low. Even averaged over a quarter rather than being exact every month, it takes a major event to have a big miss on projections for the next quarter.
Although exact monthly values in spending may be difficult to predict, trends for monthly changes in spending are easier to predict. Often these trends have very small changes month to month. Monthly changes in spending of +/- 5% are uncommon and changes of +/- 10% are quite rare.
Some forecasts I’ve seen for construction spending would demand that month to month changes in the final quarter exceed 20% to 30%. It’s just not going to happen folks.
Saturday Morning Thinking Outloud #5 – Jobs Growth
For all of 2014-2015-2016
- Total Construction jobs increased from 5,950,000 to 6,700,000, +12.6%
- Total Construction spending increased from $960bil to $1,170bil, +22%
BUT, much of that spending increase is inflation. We need to compare to constant dollars which = Volume. Inflation was particularly high in residential work, over 15% for the 3 years, which means $1.00bil in spending 3 years ago would be worth more than $1.15bil today. Converting everything to constant Oct 2016 dollars, after inflation we get:
- Total Construction volume increased from $1,070bil to $1,170bil, +9.4%
So, for the 3 years, jobs increased by 12.6% while real work volume increased by 9.4%.
A more thorough analysis, which takes hours worked into consideration, shows from the Jan 2011 bottom of the recession in construction to current, both jobs and volume have increased equally by 28%. But jobs growth is often out-of-balance with real volume growth. In the beginning of the recession years of 2008-2011 firms let go of people much faster than work volume declined. 2009 showed a big gain in productivity. By 2010-2011 firms hadn’t let go enough to match the loss in spending. Then from 2012-2014 workload grew faster than firms filled jobs. Since 2011 we are sort of on an even keel.
For the last 3 years, jobs increased more than real construction volume. I pointed this out in my last detailed jobs report. The 6 months from Oct 2015 – March 2016 encompassed the fastest new construction jobs growth period in a decade. It’s no surprise to me that jobs growth has been slow since March this year. Frankly, I wouldn’t be the least bit surprised if it remains slow for awhile. When we look at jobs growth vs. volume growth, there is reason to believe that slow jobs growth is not entirely due to labor shortages. Part of the blame is due to recent over-hiring.
Behind The Headlines – Construction Data
12-2-16
Just a few important facts here (that you won’t read in the headlines).
- Jobs have increased by 23% since the recession bottom January 2011. Construction spending has increased 52% in same period.
- Adjusting jobs for hours worked and spending for inflation, both work output and constant volume construction grew at 28% since recession bottom.
- Residential construction jobs are down 22% from the 2006 peak. In constant $ after inflation, real residential volume of work is down 39%.
- Nonresidential buildings construction jobs are down 8% from the 2008 peak. In constant $ after inflation, real nonres bldgs volume of work is down 17%.
- Construction spending average for the last 3 months is at a 10 year high. Construction volume in constant $ after inflation is still 18% below 10 years ago.
- Census construction data is ALWAYS revised in the following two months after initial release. Census updates all the values for the previous year, usually with the May data release (on July 1) the following year.
- In 2016, 7 times the first release of spending showed a decline vs the previous month. After revisions, the values show no declines vs the previous month.
- In the last 36 months, there were 16 spending releases that originally showed a decline vs the previous month. After revisions there were no mo/mo declines.
- It’s hard to add $100 billion in new construction spending in one year. Since 1993 it’s happened only 3 times; 2004, 2005 and 2015.
- It’s real damn hard to add $100 billion in new construction volume in a year. After adjusting for inflation, construction volume has never increased by $100 billion. It has increased by $75 billion 4 times and 3 more times by $50 billion.
- It takes about 6,000 jobs to put-in-place $1 billion of construction in a year. $100 billion in new work would require 600,000 new jobs in a year. The largest construction jobs growth ever recorded is about 700,000 jobs in 2 years.
- Now think of #9, #10 and #11 in terms of ONLY the Infrastructure sector. Infrastructure, about 25% of total construction spending, added spending more than $25 billion in a single year only once. The average annual growth for the past 20 years is less than $10 billion/year. The average growth in jobs (excluding all recessionary years because they would make the result approach zero) is about 25,000/year.
- The Aug-Sep-Oct 3mo average of construction starts for Nonresidential Bldgs (by Dodge Data) is the best 3mo since Q1 2008. Q1 2008 was the PEAK of the nonresidential buildings construction boom.
- More infrastucture projects started construction in the 1st 6mo of 2015 than any time in history. This will boost infrastructure spending through 2017. Infrastructure spending is low in 2016 due to a low volume of starts in 2014.
Saturday Morning Thinking Outloud #4 -YTD
11/26/16
In 2015, nonresidential buildings starts were very high in the beginning of the year and dropped off in the later part of the year. In 2016 it’s just the opposite. This skews year-to-date total comparisons and for most of this year makes it appear as if there may be no growth in new starts.
Here’s a simple example:
Let’s say 4 months in 2016 had starts of $6, 8, 10 and 12 billion and the same months in 2015 had starts of $10, 9, 8 and 7 billion. The year-to-date change for 2016 vs 2015 after the 1st month (6 vs 10) is down 40%. After two months it’s 14 vs 19 (6+8 vs 10+9), down 26%. In the 3rd month 2016 has better performance than 2015 (10 vs 8), but the year-to-date (24 vs 27), down 11%, is still strongly influenced by the earlier months. But in the 4th month we get 36 vs 34 and finally the year-to-date shows 2016 growth of 6% over 2015. That is the current scenario.
Construction Starts for nonresidential buildings for the 1st 4 months in the 2nd half of 2016 (Jul-Oct) are 30% higher than the average of the 1st half 2016 and almost 40% higher than the same 4 months in 2015, and yet the year-to-date % change 2016 vs 2015 is ZERO.
To keep from being misdirected, year-to-date comparisons require knowing not only the direction of the current year trend but also the direction of the previous year trend.
The most recent 3 month (Aug-Sep-Oct) average of nonresidential buildings construction starts by Dodge Data represent the best 3 months since Q1 2008. Although year-to-date performance of zero growth would seem to indicate a slow down, starts are doing just fine. I’m forecasting the final two months of the year to be up 40% from 2015.
But wait, there’s more!
Every year, starts from the previous year are adjusted, always higher. 2016 starts won’t be adjusted up until 2017. But that means all current 2016 (un-adjusted) starts are being compared to 2015 that has already been adjusted up. This causes the year-to-date comparison to be always understated. The average adjustment to nonresidential building starts for the last few years has been about +5%. If that trend remains consistent then next year we should see that 2016 starts were approximately 5% higher than first posted and growth was really much better than current values would seem to indicate.
With 10 months of data in hand, year-to-date starts for nonresidential buildings show no change from 2015. However starts are doing very well and I’m predicting the 2016 volume of starts will lead to 8% growth in spending in 2017.
Saturday Morning Thinking Outloud #2 – Headlines
11-5-16
I publish a lot of analysis for various construction data. I also read many other articles posted by other pundits in the industry, including MSM news sources. What I would say regarding construction data is this; an informed knowledge of construction data and how it’s used helps you understand if some article you are reading is accurate or relevant.
What I try to do here is not only report on the latest significant construction data, but also explain how the data must be used to make accurate and valuable analysis.
Here’s just three examples of how news analysts get it wrong:
> Post new construction starts as if those numbers represent construction spending.
A new start this month worth $10 billion adds a huge amount to the starts this month and will most certainly drive up the mo/mo and yr/yr starts numbers. But that new project could take 24 or 36 or 48 months to complete, so we can’t discern the impact on spending until we cash flow the value of the project which gives us the spending over its complete life span. In any given month the total amount of all spending is the summation of the spending this month from all the projects still ongoing that have started in previous months. Spending next month is 95% dependent on the flow of projects that started over the last 24 or 36 months.
> Suggest that two to three months of declines in spending indicates a downturn.
One of the biggest factors that determines spending this month is the values contributed this month from all the previous starts not yet completed. In a sector such as nonresidential buildings, in which the average duration of a project might be 24 months, the amount of spending this month gets some contribution from projects that started in each of the previous 24 months. One of the greatest influences on spending in any given month is the fluctuation (which could have occurred many months ago) in the amount of starts. So sometimes when we see a monthly spending dip it has nothing to do with a current declining trend in overall spending, but might have more to do with erratic new starts up to 18-24 months ago.
Starts can be quite erratic. Although we might see annual starts climbing at a modest rate of 6% or 7% per year, within that year we might see starts increase or decline by 50% or 100% from month to month. This is normal. But what it does to spending, particularly when a very large volume of project spending (from some month in the past that had huge new starts) finishes and drops out of the current spending, it causes dramatic fluctuations from month to month. Much of what we see in month to month changes in spending was predetermined months ago by the pattern of starts.
Normal rates of new starts, if always constant in growth rate, would create a constant rate of growth in spending. Erratic rates of change in starts create erratic changes in spending when those projects come to an end.
> Compare current $ this year to any $ from years past, without taking inflation into consideration.
I recently read an article that claimed construction was back to pre-recession levels. What really was being identified in that article was that current 2016$ were back to the level of current 2006$. That’s like saying $100 today buys you the same products that $100 bought you in 2006. I bet it wouldn’t be too hard to find a few examples where that would not be true.
Comparisons of dollars over time almost always need to be made using constant dollars, that is, adjusted for inflation and all converted to the same point in time, usually today. Sure spending today is up more than 50% off the bottom and in current dollars is higher than the previous peak in 2006. But if we adjusted those 2006$ for inflation the dollars spent in 2006 would be worth much more today. Although current dollars are now higher than any time in the past, after adjusting for inflation we are still 18% below peak spending.
Saturday Morning Thinking Outloud #1 – Infrastructure
10-29-16
Can the construction industry even accommodate adding $1 trillion of new infrastructure spending over 10 years?
It takes about 5000-6000 new jobs to support $1 billion of new construction work for a year. For infrastructure the number is lower. So $100 billion per year continuous for next 10 years would support about 400,000 new jobs for 10 years. Well, that’s not how it will happen, so let’s look a little closer.
- Historically the fastest rate of growth in spending takes about 3 years to increase 50%. That is for selected markets, never for the entire industry.
- Infrastructure spending grew 50% in 4 years from 2004 to 2008, when that sector was half the size what it is today.
- Infrastructure, about 25% of total construction spending, added spending more than $25 billion in a single year only once. The average annual growth for the past 20 years is less than $10 billion/year.
- Historical growth in jobs rarely exceeds 300,000 new jobs per year. It has never averaged that rate of growth for more than a 3 year stretch. That is for the entire industry.
- Spending after inflation (real volume growth) for all construction increased an average of $50 billion per year for the last 4 years. The same is expected in 2017.
- Jobs increased an average of 250,000 per year for the last 4 years.
- We could expect approximately the same growth in volume and jobs in 2018.
So here’s what we know. The entire construction industry has been growing on average at about $50 billion in volume and 250,000 jobs every year in recent data. Even with the addition of a new influx of infrastructure work, most of that other growth is not going to go away. But how much growth can the entire industry accommodate without bursting at the seams. Let’s make some broad assumptions to see what happens.
Let’s assume for the next 10 years the normal rate of new construction growth gets cut in half. In reality it probably wouldn’t, but we need to push some numbers to extremes to see what happens. So normal new volume, not including any boost from new federal infrastructure spending, might only grow at $25 billion per year and that would absorb 100,000-125,000 new jobs per year. That accounts for HALF of the entire industry volume growth and jobs growth. How much room does that leave for new growth or expansion in industry growth rates?
If we fill the difference with work from added new infrastructure spending, we can add $25 billion per year in new infrastructure spending and that will add about 100,000 new jobs per year. To account for how the work might be contracted out, let’s just assume in the first year we commit to $250 billion in contracts that are spread over 10 years to get to $25 billion a year in spending. In the 2nd, 3rd and 4th years we could also commit each time to another $250 billion in 10 year contracts that spread the spending out to $25 billion per year for 10 years.
By year 4, we’ve added $100 billion per year in new spending that will stretch out for the next 6 to 10 years ( note: this pushes spending $1 trillion out to 13 years). This spread of money over time, or cash flow, results in increased spending in the government infrastructure markets by 50% in 4 years, matching the best ever industry growth rates. We’ve increased jobs by 100,000 per year for 4 years to a total of 400,000 new jobs and they will all have funds to continue work for the next 6 to 10 years. All that just due to added infrastructure spending.
But let’s not forget the rest of the industry. This would push total spending growth and total industry jobs growth to the highest rates of growth on record. So this is a scenario that is unlikely to be achieved, and it’s not very likely that growth like that could be sustained for very long. It’s also not likely the rest of all the new growth in the industry is going to get cut in half to leave room for new added infrastructure work. So, it’s possible total growth over the next 4 years would be less than anticipated here. This allows for no downturn at any time in the next 10 years.
It begins to seem like it might be pretty difficult to add $1 trillion in spending to the infrastructure construction sector, which is only 1/4 of the entire industry, to be spent in the next 10 years.
When sometimes we push numbers to extremes just to see what happens, we get an unexpected picture of what might, or might not, be possible.
 Construction Analytics