Home » Starts (Page 6)

Category Archives: Starts

Starts Point to Robust 2017 Spending

10-20-16

Starts Point to Robust 2017 Spending

Construction Starts for September were released 10-18-16 from Dodge Data and Analytics. Here’s some of the major points that can be developed from the data:

starts-vs-spending-10-19-16

The six Nonresidential Buildings markets, Office (+30% YTD), Lodging (+50%), Educational (+10%), Healthcare (+20%), Commercial Retail (+15%) and Amusement/Recreation (+15%) make up 80% of all nonresidential buildings spending and account for combined growth of 16.5% in YTD new starts. Office and Lodging in 2016 will reach the 5th consecutive annual increase. Educational Markets, Commercial Retail and Amusement/Recreation will each record the 4th consecutive annual increase in total value of new starts. Spending combined for these six markets peaked in 2008 and dropped 37% to a bottom in 2012. For the last 3 years spending growth has ranged between 9%/yr and 12%/yr. For 2017, expect spending growth of 8%.

Manufacturing makes up 18% of nonresidential building market share. New starts 2016 YTD are down 54% from 2015. However, in 2014 and 2015 this market posted the fastest growth of any market in a decade and posted the two highest years on record for this market. It is currently settling back to a normal growth range. In 2014 starts increased 90%. In 2015 spending increased 33% to the highest ever recorded for manufacturing buildings. Spending will be down 2% to 3% in 2016 and down another 13% more in 2017, but 2017 will still be the 3rd highest year of spending on record.

Non-building Infrastructure starts will be down nearly 10% in 2016 but were up 25% in 2015. Power and Highway/Bridge/Street make up 2/3rds of non-building infrastructure spending. In 2015, Power starts increased 150% to an all-time high and Highway/Bridge/Street finished just shy of a 6-year high. It is not unexpected that starts in these markets will be down for 2016. The volume of monthly spending from projects started in 2014 and 2015 in this sector will contribute to spending for several years to come. Spending in 2017 will be the highest ever in this sector, up 7% from 2016.

Residential starts are having the best year since 2005-2006. Residential starts bottomed in 2009 and are now in the 7th consecutive year of growth. Although new starts will increase only about 7%-8% for 2016, that follows 4 years of growth averaging more than 20%/year. Spending peaked in 2005-2006 and dropped 60% to a low in 2009-2010. Spending has bounced 90% off the bottom in large part due to 17%/year average growth in 2013-2014-2015. Both starts and spending slowed in 2016 but still expect 7% to 8% spending growth in both 2016 and 2017.

Starts are recorded in full in the month a project starts but the total project budget gets spent over a long duration, so the effects on spending are spread over the next 2 to 3 years. Total starts are Up 10%/yr to 12%/yr for the last 4 years. The current forecast for 2016 is growth of only 3.5%, but that now leads us to a very important factor that must be considered when using starts data to predict future spending.

There is a major factor that keeps new starts in the current year from appearing as good as they should. Dodge Data continually revises starts. In every monthly release, the previous month is revised AND the last year’s year-to-date is revised. Dodge does incorporate other (usually minor) revisions at a later date, but the “12 month” revision to the previous year-to-date values captures a large part of all revisions.

So this September report includes revisions to the total 2015 YTD values through September 2015. None of the 2016 values yet include that equivalent “12 month” revision and won’t until next year. But the current year YTD not-yet-revised values are being compared to the previous year YTD revised values which has the affect of making current year growth appear lower than it should.

In the last 10 years the YTD revisions have never been down. Usually, most of the revisions occur to nonresidential buildings, about 5% to 6% per year, with only a 2% to 3% revision each to infrastructure and residential.

For total nonresidential buildings, so far year-to-date 2015 values through September have been revised UP by 9%. So while the 2016 year-to-date nonresidential buildings value this month is noted as down 2% compared to last year, much of the reason it is down is because 2015 values have had revisions applied that increase the 2015 base by 9%. We won’t get those equivalent “12 month” revisions applied to 2016 values until next year. When all the revisions are in, new starts for nonresidential buildings (typically revised up by 5% to 6%) in 2016 are on track to equal or exceed 2015 and perhaps record the third consecutive year of over $220 billion. We are within easy striking distance of the all-time high for nonresidential buildings starts reached in 2007!

For residential starts, if 2016 values get revised up next year by only 2%-3%, then 2016 will have grown by nearly 10% over 2015. Unless we experience a severe downward trend in new residential starts, which is NOT predicted, 2016 will post an all-time high for new residential starts.

(Year-to-date by market and month/month values by market are not published.)

starts-vs-spending-table-10-12-16-with-jobs

See also this post on Construction Spending Sept 2016

New Construction Starts Much Better Than Might Appear

09-23-16

Dodge Data and Analytics yesterday released August new construction starts. The August number came in right about where I expected it, just over $700 billion. August starts are 21% higher then July which was an 8 month low. However, year-to-date through August totals $439 billion, down 7% from the same period 2015.

August came in at a seasonally adjusted annual rate (SAAR) of $711 billion, the highest since May 2015. In fact, this is only the fourth month since January 2008 that registered new starts over a SAAR $700 billion. The other three were in the 1st half of 2015.

starts-nonres-bldgs-aug16

Nonresidential Buildings new starts for August came in at a seasonally adjusted $267 billion, the second highest month since early 2008. The year-to-date is down compared to last year because 2015 had some very high months that helped the first half of 2015 reach an average of $214 billion, but the first five months of 2016 had some soft months that averaged only $189 billion. New starts for the last three months average $212 billion and starts have been increasing since May.

Residential new starts reached a SAAR of $291 billion in August, the third time this year over $290 billion, averaging over $280 billion so far for 2016, the highest since 2007.

Non-building Infrastructure starts for August total SAAR of $153 billion. Infrastructure starts fluctuate much more than any other and this year have ranged from $121 billion to $200 billion. Last year they ranged from $127 billion to $261 billion. Since 2006 Infrastructure starts annual totals have been between $140-$160 billion, except for last year when they shot up to $180 billion. So even though 2016 is coming in near the high end of the average from 2006-2014, it’s still well below last year because last year was so unusually high.

But there is another major factor that keeps new starts from appearing as good as they should look. Dodge Data continually revises starts. In each monthly release we can see not only the previous month revision but also the previous year-to-date revision. They do incorporate other revisions at a later date, but the “12 month” revision to the previous year-to-date values captures a large part of all revisions. So this August report includes revisions to 2015 values through August 2015. None of the 2016 values yet include that “12 month” revision. In the last 10 years the revisions have never been down. Usually, most of the revisions occur to nonresidential buildings, about 5% to 6% per year, with only a 2% to 3% revision to infrastructure and residential.

For nonresidential buildings, so far year-to-date 2015 values have been revised UP by almost 8%. So while the 2016 year-to-date nonresidential buildings value this month is down 10% compared to some very strong starts in early 2015, part of the reason it is down is because 2015 values have had revisions applied that increase the 2015 base by 8%, but we won’t see those equivalent “12 month” revisions applied to 2016 values until next year. When all the revisions are in, new starts for nonresidential buildings in 2016 are on track to equal or exceed 2015 and perhaps record the third consecutive year over $220 billion. We are within easy striking distance of the all-time high for nonresidential buildings starts reached in 2007!

For residential starts, if 2016 values get revised up next year by only 2%-3%, then 2016 will have grown by nearly 10% over 2015. Unless we experience a severe downward trend in new residential starts, which is NOT predicted, 2016 will post an all-time high for new residential starts.

Residential Work Flow From Housing Starts

Housing starts can be erratic. It’s not unusual to see monthly housing starts fluctuate up or down by 10%, sometimes 20%. But what affect does this have on the flow of housing work? Not as much as you might think.

Although housing starts is in units, not dollars, we can create a “cash flow” to see how the new starts generate activity over future months. To see the flow of work I’ve created a simple time flow of starts to show the activity generated for new housing starts.

About 2/3rds of housing starts are single family units. These might have a construction duration ranging from 6 to 9 months. The remaining 1/3rd of starts are multifamily units. Those could have construction duration of anywhere from 8 months to 16 months and in some cases longer. For this simple analysis I’ve used a work flow duration of 2/3rds at 7 months and 1/3rd at 17 months. Varying the duration longer or shorter by a few months will not have a big effect on the outcome. It changes the slope of the growth rate but does not change the consistency of the growth pattern.

A time flow of housing starts shows growth rates of; 2013 +13%; 2014 +10%; 2015+12%. Actual construction spending shows growth of 2013 +19%; 2014 +14%; 2015+13%.

Housing Starts Actuals for Workflow 4-16

The chart above, “Housing Starts Monthly and Trend” shows the actual monthly starts values and a three month moving average. Monthly starts periodically peak and dip erratically.  Look at February 2015, the biggest dip in 5 years. The 1st quarter 2015 was down 7% qtr/qtr. But then notice it took less than 4 months for starts to come right back to the trend line and the trend remained intact.  2015 finished up 11%. This is how the monthly housing starts (# of units) data goes.

Housing Starts Workflow 4-16 SAAR


The “Work Flow” chart plots the actual work load out over time from the month the work started to completion. The total work flow in any given month is the sum of the work contributed from starts in previous months that have yet to be completed. Residential work flow has averaged +12% for the last 3 years. In 2015, growth was 14%. The very steep climb in early 2013 activity reflects work generated from the 28% rise in new starts in 2012, the largest % increase in new starts in 30 years.

Starts in any given month have only a small % impact on the slope of change in every succeeding month until completion. This is the same concept as cash flow. Construction spending in any given month is the sum of all the ongoing projects from all previous months.

This next plot shows the same workflow, only Not Seasonally Adjusted, so it shows the winter dips in activity and the steeper rate of growth during the more productive months. Although the average slope of growth is similar to the SAAR plot, this shows the real total work activity in any given month varies from that shown by the SAAR plot. However, it is not erratic like the starts plot, it is smooth and repetitive year after year.

Housing Starts Workflow 4-16 NSA

It would take a dramatic change in housing starts to significantly alter the progress of work flow and it would need to be a sustained change in starts. If a 20% decline is offset by an corresponding increase in the following month or months, then the future months of work flow will show little affect from the decline.

Construction Expectations 2016

4-6-16

What should we expect in 2016 for construction spending, jobs and cost?

Nonresidential buildings starts (as reported by Dodge Data & Analytics) were well above average from March 2014 through May 2015 but since then have been below average. It takes about 24 to 30 months for nonresidential building starts to reach completion. The effect of below average starts will kick in at the end of this year after strong spending growth.

Non-building infrastructure starts jumped 50% above average from November 2014 to peak in February 2015, then settled back to average in July of 2015. Those very strong starts in early 2015 will be spread out over 4 to 6 years so will not cause spending to spike. They will help support a slow steady increase in spending over the next two years.

Residential starts averaged near 20%/yr growth for 3 years but dropped below average for the entire 2nd half of 2015. That late 2015 dip in starts may not slow residential spending too much until the end of 2016. Overall, the data shows another repeat year of growth similar to the last three years.

Construction Spending by Sector 2013-2016 Feb2016

2015 Construction spending finished the year up 10.6% over 2014. After 3 years of growth averaging 9%/year, 2016 total construction spending could climb 11% above 2015, the largest percent gain in over 10 years. Any construction spending slowdown is temporary, baked in from old uneven starts causing uneven cashflow, soon to be ending. By the 2nd quarter 2017 all sectors return to positive growth for strong spending in 2017.

Nonresidential buildings construction spending went from zero growth in 2013 to 9% in 2014 and took off to hit 17% growth in 2015. Nonres bldgs spending could reach 12% growth in 2016 and 7% in 2017.

Infrastructure spending will increase a little in 2016 but we won’t see a sizable increase of 8% until 2017.

Residential spending averaged over 15%/year for the last 3 years and could go over 15% growth in 2016, combining for the best four years of spending growth since 2002-2005.

Don’t be mislead by news that construction spending is close to reaching the previous highs. That may be true of spending, but spending is not the measure of expansion in the construction industry. The measure of expansion is volume, spending minus inflation.

Construction spending is up nearly 40% off the 2011 lows and within 5% of the 2006 highs. But after adjusting for inflation, volume is up only 22% from the 2011 lows and is still 17% below 2005 peak volume.  We still have a long way to go. While spending is predicted to reach over 11% growth in 2016 and may do the same in 2017, volume will increase only 5% to 6% each year. The rest is due to inflation.

Spend current vs constant2015 22pct volume growth

March 2016 construction jobs increase 37,000 from February and although up and down, have averaged 37,000 jobs per month for the last 6 months.  That is the highest 6 month average growth rate in 10 years. That certainly doesn’t make it seem like there is a labor shortage. However, it is important to note, the jobs opening rate (JOLTS) is the highest it’s been in many years and that is a signal of difficulty in filling open positions.

To support the expected 2016 volume growth we need an average 25,000 new jobs per month in 2016, 300,000 new jobs, reaching a three-year gain of nearly 1 million jobs for the period 2014-2016, the highest three-year total jobs growth since 1997-1999. The labor force hasn’t expanded this fast in over 16 years. That can have some undesirable consequences.  Rapid jobs growth may result in accelerating wages and lost productivity, compounding the cost to labor.

4-6-16

If we get a construction jobs slowdown in the next few months, it’s not all due to labor shortages and not being able to find people. Construction volume has been growing faster than jobs for more than a year. It means productivity in 2015 is up after several down years. But, while we’ve recorded consecutive years of productivity declines many times, we have not had two consecutive years of productivity gains in the last 22 years. So historically we should expect a decline,  not gains this year.

Material input costs to construction are down over the last year, but that accounts for only a portion of the final cost of constructed buildings. The cost of new residential construction is up 5% to 6% in the last year. Several nonresidential building cost indexes are indicating construction inflation between 4% and 5%. The Turner non-residential bldg cost index for 2015 is 4.6%. The 1st qtr 2016 is up 1.15% from the 4th quarter 2015. The Rider Levitt Bucknall nonresidential building 2015 cost index is 4.8% and the Beck Cost Report has 5.0% for 2015. I recommend an average 5.5% cost inflation in 2016 for residential and nonresidential buildings. Non-building infrastructure costs are unique to each individual infrastructure market, so average building cost indices should not be used for infrastructure.

Building Cost Inflation Index

What Drives Construction Spending?

3-23-16

New construction starts drive construction spending.  For all the discussion regarding the monthly rise and fall of spending, most of the spending in any given month is already predetermined since two thirds of all construction spending in the next 12 months comes from projects that were started prior to today. This is commonly referred to as backlog.

The pattern of spending does not follow the pattern of new starts which can fluctuate dramatically.  It follows the pattern developed by the cashflow from all previous starts. Data for new construction starts is sourced from Dodge Data & Analytics. Cash flow is developed independently.  Here’s a much simplified example of cashflow: a new $20 million project start is to be completed in 20 months, therefore we expect this project to generate $1 million of spending every month for the next 20 months.

This plot is an Index, so the ratios of starts and actual spending show the relative volume of each of these three major sectors as compared to each other.

Index Spend vs Starts 2012-Feb2016


Nonresidential buildings new construction starts were elevated for 16 out of the last 24 months. Starts were strong from February through July of 2015. A slowdown occurred in the second half of 2015 but the last four months have been gaining slowly. It looks like the backlog of elevated starts will keep spending rising at least until the end of 2016 before we see a slight dip in spending.

75% of all nonresidential building spending in 2016 comes from projects that were started between early 2014 and the end of 2015. Each month, new starts generate only 4%-5% of monthly spending. As we start the new year, backlog accounts for 95% of January spending. We know a lot about spending within the next few months, but what we have in backlog for December at the beginning of the year from previous starts accounts for only 50% of December activity. We will add about 4-5% more to December backlog from new starts each month this year.

Five out of six times in the last 18 months that nonbuilding infrastructure new construction starts jumped 25% to 50% above the running average it was due to massive new starts in the power sector. Some of these projects are worth several billions of dollars.  While this causes new starts to fluctuate wildly, these projects sometimes take four to five years from beginning to completion, so the cash flow is spread out over a very long period, therefore spending does not experience the same magnitude of monthly change as starts.

80% of all nonbuilding spending in 2016 comes from projects that started from mid-2013 through the end of 2015. New starts each month generate only about 3% of monthly spending.

The average of residential starts for the last three months is higher than any time since 2007 when residential starts were already on the decline by 24% from the previous year. The volume of residential starts predicts that spending should be higher than it is currently. This could mean that some starts have been delayed. Or, it could be because residential starts have the shortest duration, they may be the most difficult to predict spending from starts.

55% of all residential building spending in 2016 comes from projects that started between late 2014 and the end of 2015. New starts each month generate almost 10% of monthly spending.

(6-5-16) RE: a discussion related to a decline in nonresidential permits suggests nonresidential spending will decline. Yes, but at what rate? Permits are directly related to new construction starts. Since every month of new starts has an impact of only 4-5% on nonres spending in every following month for the next 20-25 months, then a 10% drop in permits in a single month would cause only a 0.4% to 0.5% reduction in spending in each of the following 20-25 months. It would take a prolonged trend of declining permits and therefore declining new starts to really see a dramatic decline in spending, and then the greatest effect would be well out into the future.

IF Another Recession, What Would Happen to Construction?

8-15-19 See WHAT IF? Construction Recession 2020

1-27-16

The wheels of construction turn slowly.

There is plenty of talk these days of whether or not we may slip into another recession. On any given day you can read several articles pointing to why or why not we are headed into another recession. I’m not trying to take a position here. I would like to get a rough idea what would happen to this current construction recovery if we do slip into recession.

A starting baseline for this discussion is my forecast for 2016; total spending up 10%. nonresidential buildings up 14% after a 17% increase in 2015, residential up 12% following 13% in 2015 and non-building infrastructure up 1% for a total less than 2% in 2015-2016. So, you can see I’m not predicting a recession.

If you think of a recession as having an immediate affect on total construction, like a quick drop in materials prices or cost of buildings, think again. Construction is sort of like an aircraft carrier, it takes a long time to turn around.

The best indicator of future construction activity is the projected cash flow generated by all the construction starts that have been recorded. Construction starts represent the beginning of spending on new projects.  Projects can take many months to reach completion.  Some portion of the total project spending occurs in every month over the full duration of the project from start to completion.

We start 2016 with a backlog of projects that will generate about 70% of all the cash flow in 2016. It’s likely that most if not all of the projects already started would move on to completion.  But new starts will be cut back.

To get an idea how another recession might affect construction spending, I kept all backlog as is but I reduced future new construction starts for the next two years (2016 and 2017) by 30% for residential and nonresidential buildings, and 15% for infrastructure projects.  This mimics the declines we experienced from 2006 to 2009.  I then allowed for a 5% increase across all sectors in 2018.

The result is a 5% drop in construction spending in 2016, still higher than 2014, but then a 10-15% drop in 2017 setting us back to near the same level as 2013.

These spending declines would cause a temporary loss of about 400,000 to 500,000 jobs.

Nonresidential buildings could still eke out a slight gain in 2016 but would drop 20% in 2017.  Residential construction would drop about 5% in 2016 and then drop another 10-15% in 2017. Nonresidential infrastructure work would decline 10% in 2016, but then rebound to no change in 2017.

After two years of declines, in 2018 nonresidential buildings would climb back to near even with 2017, residential would grow 5% and infrastructure would remain flat.  Total 2018 spending would climb only 2% over 2017 and would still only reach spending in 2013.

So, a 30% decline in activity for two consecutive years starting today would set us back four to five years, but the major affect would not be felt until 2017. If that were to happen, obviously spending would be revised, but also I would have much different predictions for inflation and jobs.

There’s a reason we see the dips and rises on the chart in both 2016 and 2017. It reflects the decline in the rate of new starts plus the remainder of old backlog finishing at varying end-dates. Also, given a constant amount of seasonally adjusted new starts, there is a difference in the actual amount of starts in winter months vs summer months.  This plays out over time as dips and rises in spending. Spending activity will not be smooth in a recession.

Nonres tot 2015 and 2016

Updated 1-23-16 Forecasts of 2016 Nonres Buildings Construction Spending % Growth

Updated 1-23-16 – CMD, FMI and I have updated 2016 construction spending forecast in the last month and the latest is included in this table.

Spend Nonres Bldgs pct 1-13-16

Original post 12-21-15

Below are early Q3-Q4 2015 forecasts for growth in 2016 nonresidential buildings construction spending markets.

Seven firms posted forecasts for spending growth. My 12-21-15 forecasts include new starts through November in my projection.

Most of the starts that will generate spending next year are already in place. For the 2016 forecast, new starts booked through December 2015 will contribute 75% to nonresidential buildings spending. We expect new starts growth in nearly every market. However, the pattern of spending will not be a constant upward slope.

Don’t expect 2016 forecast to change much with the last month of data. Commercial/Retail, Office and Manufacturing have been declining in recent months and are expected to continue to drop. Institutional work is on the increase.

As in the 2015 spending growth forecast, I’m well outside the range of predictions for several building types, particularly Educational, Healthcare, Amusement and Office. However I’m OK with my contrary positions since I had the same regarding 2015 spending and now as we near year end I may potentially have had the closest forecast for 5 or 6 of the 7 markets.

Look back at this chart  a year from now to see how we did.

MARKETS 2016 Q415 estm 12-21-15

Housing Starts > Look a Little Deeper

October housing starts released Nov. 18th didn’t come in as expected. The annual rate for October is  1,060,000 new starts vs 1,191,000 in September and 1,079,000 in October last year.  BUT look a little deeper than just one month.

The last 4 months of starts have been pretty high, averaging 14% higher than the previous 4 months and 16% higher than the same 4 months last year.

Take a look at this chart. Monthly starts periodically peak and dip erratically.  Look at February 2015, the biggest dip in 5 years.  But then notice it took less than 4 months for starts to come right back to the trend line and the trend remained intact.  This is how the monthly housing starts data goes.

So don’t get too alarmed over one month of data.  Now if this downward trend were to continue for several months, go ahead get concerned, but  that hasn’t been the pattern.

Housing Starts Plot Oct 15

Heard at Dodge Data Outlook 2016, Oct. 30, 2015

Dodge Data & Analytics Outlook 2016 event held in Washington DC, October 30, 2015.

A brief summary of comments heard and information from my notes.

Art Gensler – Founder Gensler

How do you control 5000 people?  Hire good people and get out of their way.

People value what they pay for and ignore what they get for free.

Beth Ann Bovino – U.S.Chief Economist, Global Economics & Research, Standard & Poor’s

Domestic economy is strong and strengthening.

Jobs are stronger – Quits rate is at a 7 year high.

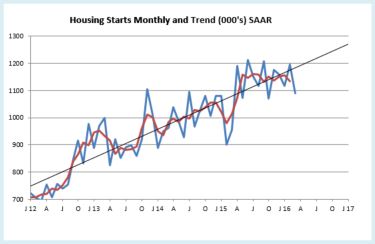
Housing starts are up – Home prices are up.

Wages are struggling and we have a historical 38 year low labor participation rate.

Ted Hathaway – CEO Oldcastle BuildingEnvelope

We increased wages significantly to keep people from leaving.

The cost and disruption is huge if you lose a valuable member of a team.

Dan McQuade – President, Construction Services, AECOM

Three emerging trends

Global collaboration

Investing capital with clients and partners

Better collaboration with vendors & suppliers. Treat subs and vendors as partners.

Larry Kudlow – Economist and Senior Contributor CNBC

Our biggest problem – We do not have strong steady economic growth.

Corporate profits were high after recession but have declined last three quarters. Profits were likely responsible for the stock market rise.

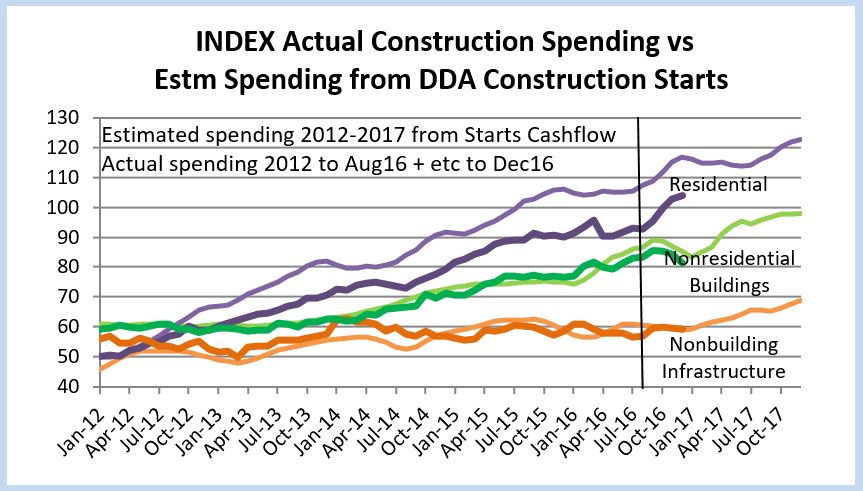
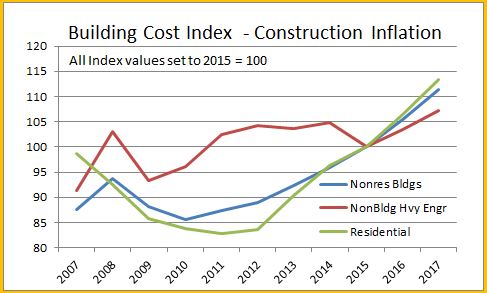
Bob Murray – Vice President, Economic Affairs, Dodge Data & Analytics

The DMI is reflecting the institutional dip has ended and now beginning to grow, although slowly.

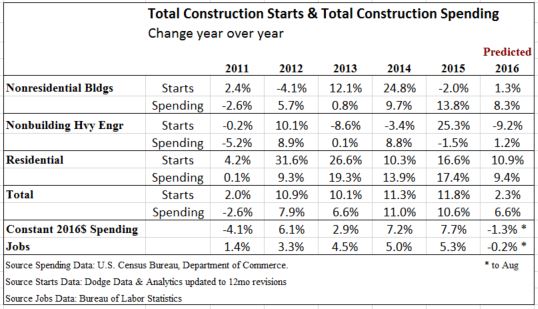
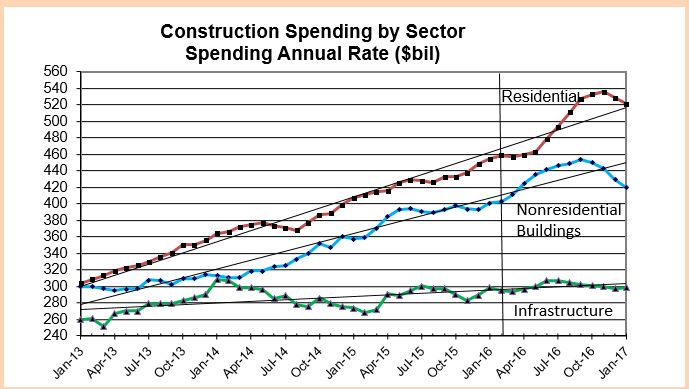
New construction starts 2013 = 11%, 2014 = 9%, 2015 = 13%p

Actual $ put-in-place 2013 = 7%, 2014 = 5%, 2015 = 10%

New starts that declined in 2015 Warehouses, Stores, Public Bldgs, Manufacturing

New Starts that increased in 2015 Residential, Hotels, Highway, Electric-Gas-Power

Expectations for 2016

Total new construction starts up 6%.

Residential up 16%, single family will grow faster than multifamily.

Commercial up 11%, led by warehouses and stores

Institutional up 9%, led by educational

Manufacturing down 1%, but from very high 2014 and 2015

Power down 43% from extreme high starts in 2015

Construction cycles may be indicating we have years of growth left in the current cycle.

Construction Spending or Construction Starts – Media Headlines That Get it Confused

Here’s a headline published recently.

“Construction spending rose year-over-year during first 9 months of 2015”

What they really meant to say

“Construction STARTS rose year-over-year during first 9 months of 2015”

Why make a big deal out of this.  Well, here’s an example.  The brief states “nonbuilding work climbed 35%” during the first nine months of 2015 compared to same months 2014.  TRUE, if we look at new construction STARTS, but construction spending for non building work is down 2.5% during the first 8 months of 2015 vs 2014 (Sept spending won’t be available until November 2nd).

Construction starts help us understand where future spending is headed.  Construction spending is based on how much is occurring this month from all the projects that started in the previous 12 to 30 months.

Let’s use an example to understand new construction starts vs construction spending:

Assume:

All the nonresidential building projects that start in a given month have a schedule duration of 20 months.

The total starts in this month is $60 billion.

Over a duration of 20 months they will average a put-in-place construction spending of 60/20 = $3 billion a month. Spending follows a typical bell curve, starts out slow, gets real strong in the middle and finishes slow. The spending cash flow from these new starts will begin slowly at a rate of perhaps $1 to $2 billion/month, it will peak in about 10 to 12 months at perhaps $4-5 bil/mo, and then will taper to the finish again at about $1-2bil/mo. It will take 20 months to spend this $60 billion in new starts from this single month.

The point here is this:  Current spending is based on the last 2 to 3 years of starts.  New starts will generate the next 2 to 3 years of spending.  Don’t get the two confused.  Big increases in new starts is not telling us how much spending is going on right now, it’s telling us how much spending to expect in the future.  And to get the real picture of what to expect in the future we need to look at the cumulative cash flow that occurs in any given future month from all the previous starts that are still ongoing. Furthermore, the construction starts values that are published every month represent a sampling of new construction activity, approximately 50% to 60% of total construction activity.  While the total reported construction starts for a year might be $500 to $600 billion, the total spending in that year will be more like $1.0 to $1.1 trillion.