Home » Posts tagged 'residential' (Page 3)
Tag Archives: residential

Residential Work Flow From Housing Starts
Housing starts can be erratic. It’s not unusual to see monthly housing starts fluctuate up or down by 10%, sometimes 20%. But what affect does this have on the flow of housing work? Not as much as you might think.
Although housing starts is in units, not dollars, we can create a “cash flow” to see how the new starts generate activity over future months. To see the flow of work I’ve created a simple time flow of starts to show the activity generated for new housing starts.
About 2/3rds of housing starts are single family units. These might have a construction duration ranging from 6 to 9 months. The remaining 1/3rd of starts are multifamily units. Those could have construction duration of anywhere from 8 months to 16 months and in some cases longer. For this simple analysis I’ve used a work flow duration of 2/3rds at 7 months and 1/3rd at 17 months. Varying the duration longer or shorter by a few months will not have a big effect on the outcome. It changes the slope of the growth rate but does not change the consistency of the growth pattern.
A time flow of housing starts shows growth rates of; 2013 +13%; 2014 +10%; 2015+12%. Actual construction spending shows growth of 2013 +19%; 2014 +14%; 2015+13%.
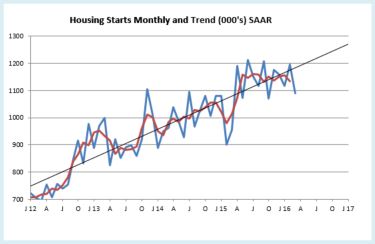
The chart above, “Housing Starts Monthly and Trend” shows the actual monthly starts values and a three month moving average. Monthly starts periodically peak and dip erratically. Look at February 2015, the biggest dip in 5 years. The 1st quarter 2015 was down 7% qtr/qtr. But then notice it took less than 4 months for starts to come right back to the trend line and the trend remained intact. 2015 finished up 11%. This is how the monthly housing starts (# of units) data goes.

The “Work Flow” chart plots the actual work load out over time from the month the work started to completion. The total work flow in any given month is the sum of the work contributed from starts in previous months that have yet to be completed. Residential work flow has averaged +12% for the last 3 years. In 2015, growth was 14%. The very steep climb in early 2013 activity reflects work generated from the 28% rise in new starts in 2012, the largest % increase in new starts in 30 years.
Starts in any given month have only a small % impact on the slope of change in every succeeding month until completion. This is the same concept as cash flow. Construction spending in any given month is the sum of all the ongoing projects from all previous months.
This next plot shows the same workflow, only Not Seasonally Adjusted, so it shows the winter dips in activity and the steeper rate of growth during the more productive months. Although the average slope of growth is similar to the SAAR plot, this shows the real total work activity in any given month varies from that shown by the SAAR plot. However, it is not erratic like the starts plot, it is smooth and repetitive year after year.

It would take a dramatic change in housing starts to significantly alter the progress of work flow and it would need to be a sustained change in starts. If a 20% decline is offset by an corresponding increase in the following month or months, then the future months of work flow will show little affect from the decline.
Construction Forecast 1st Look – What To Expect in 2016?
Construction spending may reach historic growth in 2016.
There are currently six estimates available forecasting 2016 total construction spending ranging from 6% to 10% growth, with an average of 8.7%. My forecast is 9.7%.
Total construction spending, forecast to grow 9.7% in 2016, could reach a total 30% for the three years 2014-15-16. The only comparable periods in the last 20 years are 29% in 2003-04-05 and 27% in 2013-14-15.
The current nonresidential buildings construction boom could become an historic expansion. Nonresidential buildings spending is forecast to grow 13.7% in 2016. Added to 8.8% in 2014 and 17.1% in 2015, the three-year total growth could reach 40% for 2014-15-16. The only comparable growth periods in the last 20 years are 40% in 2006-07-08 and 32% in 1995-96-97.
For perspective, residential spending increased 46% in 2013-14-15, similar to only one comparable period in the last 20 years, 48% in 2003-04-05.
Non-building infrastructure projects, in two of the last three years have barely shown any gains entirely due to declines in power plant projects. This will repeat in 2016.
This is still the 1st or 2nd most active 3 year period of growth in construction in more than 20 years, and it’s already been ongoing since 2013-2014. With the forecast for 2016, spending growth could reach a new three-year high.
From the middle of Q1 2016 to the end of Q3 2016, total spending will post six to eight months at an annual growth rate of 20%, but due to the dips at the beginning and the end of the year, total 2016 construction spending will finish at 9.7% growth. Construction spending momentum is not yet losing steam. We may be seeing the effects of a few years of erratic growth patterns and a shift from more rapidly changing commercial and residential work to slower growth institutional work.

Residential spending will slow several percent early in 2016 before resuming upward momentum to finish the year with 12% growth, slightly less than growth in 2014 and 2015. Periods of low new start volumes need to work their way thru the system and this produces growth patterns with periodic dips. The upward momentum will carry into 2017.
Nonresidential buildings spending will slow moderately in the next few months before we see a 15% growth rate through the middle of the year, only to see another slowdown late in 2016. Major contributions are increasing from institutional work in educational and healthcare markets. Office, commercial retail, lodging and manufacturing will decline considerably from 2015 but still provide support to growth.
Infrastructure projects spending will decline over the next six months due to the ending of massive projects that started 24 to 42 months ago. There will be large advances in spending midyear before we experience another slowdown later in 2016. Following a 0.5% increase in 2015, spending will increase only 1.2% in 2016, held down by a 10% drop in power projects, the second largest component of infrastructure work.
Construction added 1.0 million jobs in the five years 2011-2015. 800,000 jobs were added in the last three years. To support forecast spending, jobs need to grow by 500,000 to 600,000 in 2016-2017. Growth in nonresidential buildings and residential construction in 2014 and 2015 led to significant labor demand which has resulted in labor shortages in some building professions. Demand in 2016-2017 will drive up labor cost and may slow project delivery.
Spending growth, up 35% in the four-year period 2012-2015, exceeded the growth during 2003-2006 (33%) and 1996-1999 (32%) which were the two fastest growth periods on record with the highest rates of inflation and productivity loss. Construction spending growth for the period 2013-2016 is going to outpace all previous periods.
Construction inflation is quite likely to advance more rapidly than some owners have planned. Long term construction cost inflation is normally about double consumer price inflation. Construction inflation in rapid growth years is much higher than average long-term inflation. Since 1993, long-term annual construction inflation for buildings has been 3.5%, even when including the recessionary period 2007-2011. During rapid growth periods, inflation averages more than 8%.
For the last three years the nonresidential buildings cost index has averaged just over +4% and the residential buildings cost index just over +6%, however, the infrastructure projects index declined. The FWHA highway index, the IHS power plant index and the PPI industrial structures and other nonresidential structures indices have all been flat or declining for the last three years. This provides a good example for why a composite all-construction cost index should not be used to adjust costs of buildings. Infrastructure project indices often do not follow the same pattern as cost of buildings.
Anticipate construction inflation of buildings during the next two years closer to the high end rapid growth rate rather than the long term average.
Housing Starts > Look a Little Deeper
October housing starts released Nov. 18th didn’t come in as expected. The annual rate for October is 1,060,000 new starts vs 1,191,000 in September and 1,079,000 in October last year. BUT look a little deeper than just one month.
The last 4 months of starts have been pretty high, averaging 14% higher than the previous 4 months and 16% higher than the same 4 months last year.
Take a look at this chart. Monthly starts periodically peak and dip erratically. Look at February 2015, the biggest dip in 5 years. But then notice it took less than 4 months for starts to come right back to the trend line and the trend remained intact. This is how the monthly housing starts data goes.
So don’t get too alarmed over one month of data. Now if this downward trend were to continue for several months, go ahead get concerned, but that hasn’t been the pattern.

Residential Construction – Not All Data Tells The Same Story
The latest New Housing Starts numbers were released today. Residential growth is looking good and based on several inputs, I’m predicting an increase in residential construction spending next year. But let’s take a look at the variance you might get when looking at different data sets.
All the data below represents residential construction growth for the period from January 2011 until current, the last 4 years 8 months
New Construction Starts in $ (by Dodge Data Analytics) +19%/yr

New Housing Starts (number of new housing units) +20%/yr

Total Construction Spending +12.5%/yr

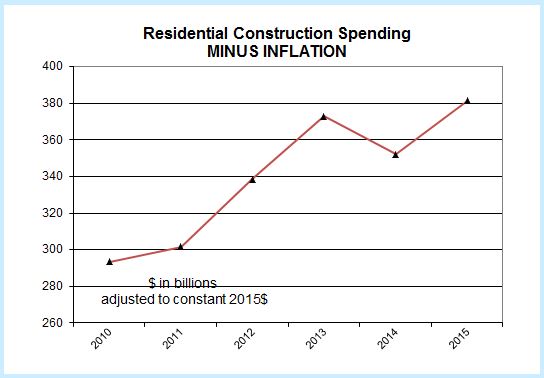
Volume (construction spending minus construction inflation) +7%/yr
The obvious first question is why don’t all the data agree? Without a lot more information on housing that cannot be answered here, but there are a few reasons that can be considered as cause for variation;
- the average size of housing units being built
- the quality of the components built into the housing units
- the cost to the contractor for the materials used
- the cost of labor wages to build the housing unit
I’m sure there are other reasons to consider as this is not intended to be a complete list of what might cause variances between starts and spending, but it does highlight that starts does not give an exact indication of the growth in spending. There is a fairly consistent growth rate in starts of 20%/year and yet construction spending in current dollars has been growing at only 12.5%/year. Furthermore, a sizable portion of that spending growth is just for inflation. After inflation is taken out we see real construction volume in constant 2015$ has been growing at only 7%/year.
I don’t have an answer to explain these variances. I’m highlighting the data to show these variances exist and we can’t always rely on one data set exclusively. Perhaps this will initiate a discussion as to why these data vary by so much.
