Home » Behind the Headlines (Page 14)
Category Archives: Behind the Headlines
Behind The Headlines – Construction Starts is not Spending
3-17-17
A major construction industry news source has a series of articles referencing Dodge Data New Construction Starts, listing the starts data, but then incorrectly refers to the data as construction spending and looks at the yr/yr trend in values to predict % change that construction spending will rise or fall. This is incorrect use of starts data and misrepresents how to use Dodge Data New Starts. The starts data, as it is being used, isn’t a valid indicator to get a spending projection in the next year.
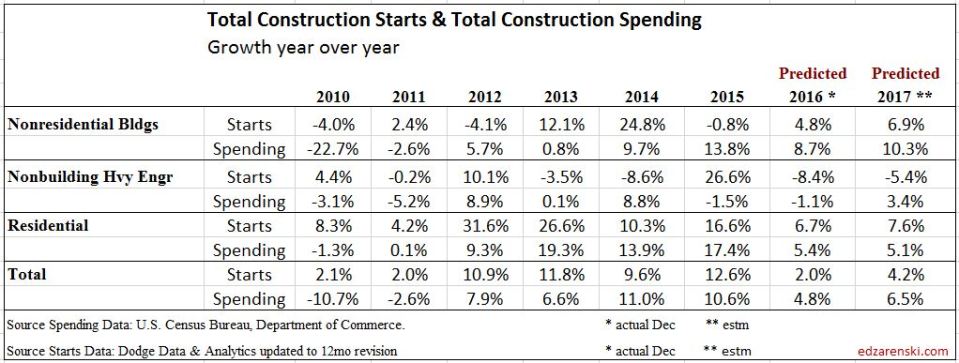
New Starts for the year is the total value of project revenues that came under contract in that year. The values reported by Dodge are a sampling survey of about 50% to 60% of the industry. The percent change in values is very useful. The total dollar volume is not comparable to actual spending.
The entire value of a project is considered in backlog when the contract is signed. That’s a new start. Projects booked on or before December 2016 that still have work remaining to be completed are in backlog at the start of 2017. Simply referencing total new starts or backlog does not give an indication of spending within the next calendar year, particularly for infrastructure and residential. Projects, from start to completion, can have significantly different duration. Whereas a residential project may have a duration of 6 to 12 months, an office building could have a duration of 18 to 24 months and a billion dollar infrastructure project could have a duration of 3 to 4 years. So new starts within any given year could contribute spending spread out over several years.
Backlog at the start of 2017 could include revenues from projects that started last month or as long as several years ago. For a project that has a duration of several years, the amount in starting backlog at the beginning of 2017 is not the total amount recorded when that project started, but is the amount remaining to complete the project or the estimate to complete (ETC). And all of that ETC may not be spent in the year following when it started, dependent on the duration remaining to completion.
The only way to know how much of total starts or total backlog that will get spent in the current year and following years is to prepare an estimated cash flow from start to finish for all the projects that have started over the past few years. The sum of the amounts from all projects in each month gives total cash flow in that month, or monthly spending in that year. Spending in any given month could have input from projects over the last 36 months. That’s what shows the expected change in spending.
Construction Starts provide the values entering backlog each month. Except for residential, new project starts within the year contribute a much smaller percentage to total spending in the first year than all the backlog ETC on the books at the start of the year. New residential projects contribute the most to spending within the year started because generally residential projects have the shortest duration. Residential projects started in the first quarter may reach completion before the year is over. New infrastructure projects generally have the longest duration and may contribute some share of project value to backlog spread over the next several years.
The following table clearly shows there is not a correlation between starts in any year with spending in the following year. The practice of using construction starts directly to predict spending in the following year can be very misleading in an industry that relies on data for predictive analysis to plan for the future. Not only does it not predict the volume of spending in the following year, it does not even consistently predict the direction spending will take, up or down, in the following year. It’s a false indicator and it’s not a good use of data.
Dodge Data New Construction Starts is powerful data if used properly.

Is There a Construction Jobs Shortage?
3-10-17
The imbalance between construction spending and construction jobs is nothing new. It’s been going on for years. It reflects more than just worker shortages. It captures changes in productivity due to activity. It also helps explain why sometimes new jobs growth rates do not follow directly in step with spending growth. A big part is that it reflects hiring practices. That imbalance can be affected by either over or under-staffing and that can be affected by inflation.
2000-2008 The Expansion
For the 1st several years, nonresidential construction spending was flat or down. Then for two years spending was up only slightly, but constant $ volume (spending inflation adjusted) had actually decreased. Nonresidential jobs fell from 2001-2003 but then grew for several years during this period when constant $ volume was decreasing, creating productivity losses.
On the other hand, residential spending grew 80%, but after adjusted for inflation, volume grew only 23%. Most staffing increases during this period were for residential construction and jobs/volume growth was pretty consistent. Residential saw mixed productivity during this period. In 2006 residential volume had already started declining.
It is not uncommon when work is plentiful that productivity declines. In 2004-2005, spending increased by 24%, but inflation was hovering around 8% to 9%/year. Constant $ volume (spending after inflation) increased by only 6%. Jobs grew faster, by 9%. Net productivity decline.
In 2006, nonresidential work was starting to take off, increasing 45% from 2006 though 2008. During this period jobs increased by only 8% and volume added 16%. Excess volume was able to absorb a good portion of the jobs/volume imbalance from 2000-2006.
See the line chart below “Productivity = Annual $ Put-In-Place per worker. These up or down periods for each of these sectors discussed here can easily be seen in rising or falling $PIP volume on that chart, sectors plotted separately. The bar graph “Total Annual Productivity Change”, is the composite total of the three sector graphs.

Net volume in 2006 declined, but jobs increased another 5%. For the three-year period 2004-2006, spending increased by 28%, but after inflation, real volume increased by less than 5%. Jobs increased by 14%. Productivity declined by nearly 10%.
Heading into 2007, residential firms had excess staff, as measured by the negative imbalance of jobs/volume. Compounding productivity issues, when spending started to decrease significantly, it took longer for companies to downsize their workforce. The workforce was not reduced to match the volume of work lost. Residential construction was first to show the strain, already having started to decline in 2006 and continuing to decline through 2009.
2006-2010 The Residential Recession
Residential construction was 1st hit by the recession in early 2006. For the 4 years 2006-2009, residential volume dropped 55%. It remained flat for two more years, down a few more percent. Over six years starting 2006, residential jobs dropped only 40%.
The Annual $ PIP line chart above shows that for 2006-2009 there were only residential losses, or negative balance between jobs/volume. Both nonresidential sectors were improving slightly at the time. The total negative bars in those years is entirely due to residential.
2009-2011 The Nonresidential Recession
Nonresidential Buildings construction didn’t fall into recession until 2009. In the two years 2009-2010, nonresidential buildings lost over 30% in volume but only 22% in jobs.
This chart simply shows the imbalance between the number of jobs and the dollar volume of work put in place for each year compared to the year before. In a simple form that can be referred to as a change in productivity. In all these charts, jobs/year are adjusted for hours worked and dollars are always constant $ inflation adjust to 2016$.

In 2009 my chart shows a huge productivity gain. It is almost entirely due to Non-building infrastructure, which never did fall into deep recession. Combined residential and nonresidential buildings only in 2009 would have shown a net 1% gain.
2011-2012 Early Recovery
Starting 2011, firms had lost significant revenue but had retained more staff than needed. There was so much excess staff (in relation to how much total revenue was available) that almost no reasonable gains in spending could wipe away the losses in productivity. Volume improved by 1%, but hiring resumed and jobs grew by 1%. Due to excess staff still on payrolls, productivity showed a 6% decline.
For the next few years, when we look at jobs growth vs. volume growth, there is reason to believe that slow jobs growth (2011 through 2013) may not be all due to labor shortages. Although we lost more than 2 million jobs, there remained excess jobs when compared to the amount of volume that was available.
At least part of the blame for slower new jobs growth was that excess staff already on hand were being absorb by the new spending gains. For a period there was insufficient volume out in the market to support all the staff that had remained on board. Finally, there was increased revenues which would first reabsorb part of the excess labor before rehiring started.
2012-2016 The Construction Boom
It took three more years to see a significant move towards balancing jobs and real volume. In 2014, jobs increased 6% and constant volume increased 7%. For the first nine months of 2015, jobs increased 3% and volume increased 8%. This was a good productivity balance period.In the three years 2012-2014, volume increased 16% but new jobs grew by only 11%. The increased work volume absorbed a good portion of the excess staffing.
What reasons could cause contractors to think they need more staff?
One reason may be that contractors don’t typically track revenues in constant dollars, they track in current dollars. So any comparison to a previous year is to inflated data. To achieve business plan growth of 6%/year, is it necessary to grow staff by 6%/year? Not if during that period inflation is 4%. Then real volume growth is only 2%/year and new staffing needs are far less than anticipated.
Basing staffing needs on current $ revenue growth can lead to the same kind of over-staffing we saw going into the recession. In the three years 2004-2006, construction spending increased 30%. Jobs increased 16%. However, during that three-year period construction inflation was the highest ever recorded, composite inflation averaging greater than 8%/year. After inflation, real construction volume increased only 4% during that period. Hiring far exceeded the rate of real volume growth. There is the potential that contractor’s hiring could be swayed by highly inflated spending when actually volume is not as strong as thought.


From the Jan 2011 bottom of the construction recession through Dec 2016, both work output (jobs x hours worked) and volume (spending after adjustment for inflation) increased equally by 29%.
(note: BLS revisions to hours worked, issued in the 3-10-17 release changed total growth output from 29% to 30%).
There are always unequal up and down years, but this longer term period shows balanced growth returned after a tumultuous period. We were so far down on the scale after the recession it seems reasonable that we experienced this re-balancing.
Both 2014 and 2015 show productivity gains. That is unusual in that there have not been two consecutive years of productivity gains in 23 years (while my jobs data goes back to 1970, spending data goes back only to 1993).
The trend changed in October of 2015. Now when we look at jobs growth vs. volume growth, there is reason to believe that any jobs growth slow-down may be at least in part due to recent over-hiring.
2014-2016 Record Jobs Growth
In the last three years, we’ve added 840,000 construction jobs. We’ve also increased hours worked to an equivalent to 880,000 jobs, growth of 15%. That’s a faster rate of growth in three years than the 2004-2006 construction boom. To help explain that growth, real volume in 2014-2016 was far greater than the volume in 2004-2006, or any other three-year period for that matter. The last time we’ve seen jobs growth like this was 1995-1999.
2012 through 2016 is the greatest construction boom on record, whether measuring unadjusted current $ spending or constant $ real volume after inflation, flying past the 2000-2005 boom and narrowly beating out 1995-2000. And we started 2017 with backlog at a record level, so the boom continues.
5-Year Construction Booms Compared to 2012-2016
- 2012 – 2016 current $ +$377 bil +48% — constant $ +265 bil +29%
- 2001 – 2005 current $ +$314 bil +39% — constant $ +30 bil <3%
- 1996 – 2000 current $ +$254 bil +46% — constant $ +235 bil +21%
Notice how little growth actually occurred in the five-year period 2001 through 2005. While there was significant spending growth, most of it was inflation, and 90% of it was residential. During that period composite inflation increased more than 35%. Also, nonresidential construction was having a setback, dropping 15% in volume in that five years. The real story out of the 2001-2005 boom period is to compare residential work.
- 2012 – 2016 Rsdn current $ +$211 bil +83% — constant $ +146 bil +46%
- 2001 – 2005 Rsdn current $ +$280 bil +80% — constant $ +132 bil +23%
Residential inflation 2001-2005 was a whopping 47%. But, total residential spending was up 80%. After adjusting for inflation, residential still added 23% to volume during that period. During both periods, residential volume grew more than jobs, so both periods had a net productivity gain.
Also in 2001-2005, nonresidential added 3% more jobs in a five year period in which volume dropped 15%. The very high levels of inflation help explain why staff may have grown to such excess during that period. Contractors were seeing revenues grow by 20%-30% and were slowly adding jobs in a period when real volume was dropping 3% per year.With the exception of residential growth, there was a downturn in other work. New jobs increased by only 11%, but due to rampant inflation, real volume increased by less than 3%. Nonresidential contributed all the negative productivity in 2001-2005.
2014-2015 Construction Spending for the Record Books
- 2014 to 2015 current $ +$206 bil +23% — constant $ +158 bil +16%
No two consecutive years of construction come close to equaling the real volume put-in-place during 2014-2015. The two years 2004-2005 had greater growth in spending, but most of that was inflation, so had little growth in volume. In fact, we would need to consider three consecutive years to come close to 2014-2015 and the three years that comes closest is 1996-1998 and that would still be a few percent short. This volume growth is driving huge jobs growth.
From October 2015 through March 2016, jobs growth was exceptional. During that 6 month period we added 215,000 construction jobs, the fastest jobs growth period in a decade. That period topped off the fastest two years of jobs growth in 10 years. Record increases in jobs growth are not what we might expect if there is a labor shortage.
And yet, the Jobs Opening and Labor Turnover Survey (JOLTS) is the highest it’s been in many years and that is a signal of difficulty in filling open positions. But, one of the known factors during a high level of market activity (lot’s of construction work – we are at record levels) is that workers know there is another and sometimes better job just down the road. During high levels of activity, unless the current employer is paying some kind of premium to keep them, workers may leave for greener pastures. That creates a high level of job churn.
Hiring Changes Lag Volume Changes
It is important to take note that it appears the two most recent six-month surges in jobs lag the period of greatest volume growth. I noted earlier that contractor staffing changes seem to lag movements in volume.
Since Sep 2015, jobs have been increasing more than real construction volume. For much of 2014 and 2015 construction spending real volume growth was exceeding jobs growth. Spending in 2016 slowed from the all-time record levels. That’s not totally unexpected as it would be highly unusual for that record level of growth to continue. But hiring continues.
Since Sept 2015, construction volume growth (spending minus inflation) slowed or stalled and completely contrary to what one would expect in a labor shortage, new jobs growth has been exceeding volume.
- From Sep15 to Mar16 jobs increased+3.3%, volume increased +1.6%
- From Mar16 to Aug16 jobs had no change, volume decreased -3.3%
- From Aug16 to Feb17 jobs increased +2.6%, volume increased +0.10%
This most recent six-month period posted 177,000 jobs, the 3rd best for any consecutive six months since 2005-2006. Although we experienced a slow down in new jobs through the middle of 2016, that was bracketed by two of the three strongest six month growth periods in more than 10 years. For 18 months Sep’15 to Feb’17, jobs are up 7% higher than volume. For 2012-2014 volume grew 6% more than jobs.
For 2017, several economists are predicting total construction spending will increase by just over 6% (including my estimate of 6.5%). However, I’m also predicting that combined construction inflation for all sectors will increase by about 4.5%. That leaves us with a net real volume growth of only 2.0%. Therefore, for 2017, I do not expect jobs to increase by more than 2.0%, or 140,000. That number seems hard to swallow given we are already at 98,000 in the first two months. But remember, jobs have been growing faster than volume for the last 17 months. We could be due for another no-jobs-growth absorption period.
If jobs increase more than 140,000 and both spending and inflation hold to my predictions, then jobs will continue to outpace volume and that will show up on my plot as a productivity loss for 2017. Jobs have been getting ahead of volume for 17 months. Contractors may still be hiring, lagging the movement in real volume growth. It will take the next few months to see if that is the case but I would expect jobs growth to slow or stop for the next few months and I would not attribute that to labor shortages. As we’ve seen before, we should expect jobs/volume to come back to balance. (post note: following Jan-Feb when, after revisions, we added 88k jobs, in the next 5 months we added only 13k jobs. Jobs growth almost stopped for 5 months.)
So, here we are powering our way through the greatest construction expansion ever recorded, with three years of jobs growth at a 11-year high and jobs growing faster than volume for the past 17 months. Does that seem like a jobs shortage to you?
For a continuation of this discussion see A Harder Pill To Swallow! and Construction Jobs Growing Faster Than Volume

Calls for Infrastructure Problematic
3-6-17
Few analysts are talking about current forward looking conditions and the problems such a massive infrastructure construction spending program might cause.
Every major construction agency is currently seeing monthly infrastructure construction spending drop and is calling for promptly initiating a $1 trillion infrastructure spending program. Infrastructure spending has been flat to down slightly for the last seven months. But infrastructure spending is notoriously uneven. I’d like to see increased construction spending as much as the next guy, but there are issues that need to be taken into account. I see problems down the road.
I’ve written about this before here Infrastructure – Ramping Up to Add $1 trillion and here Infrastructure & Public Construction Spending and Conor Sen wrote about it recently in a Bloomberg View article Math Will Kill Trump’s Infrastructure Plan. Some assumptions of increasing infrastructure spending by $100 billion and maintaining that level for the next 10 years are a pipe dream. Only three times in history has the “entire” construction industry ever increased by $100 billion in one year. The infrastructure sector, only 25% of all construction, does not have the capacity to grow by $100 billion in a year.
One of the big issues a massive expansion and abrupt program end causes is the need for a huge growth in the workforce, and that could be difficult particularly at a time when the non-working unemployed pool is near an all-time low. But perhaps more important, when all that expansion spending comes to an end, there is no long term ongoing backlog for all that labor to go to, so it results in massive job losses. Very large volume new starts and abrupt ending causes devastating disruption in the industry.
Here I will address spending and volume growth.
The infrastructure sector of construction is only 25% of all construction. Growth has exceeded $20 billion/year only three times and average growth (without recessionary declines) is $12.5 billion/year. But most of that was driven by the power market, which is 80% private. Power contributes 1/3rd of all infrastructure spending. Only 60% of all infrastructure is publicly funded. That public subset of work in the last 25 years has grown by $20 billion/year only once and with all the negative recessionary years eliminated growth would average less than $10 billion/year.
To repeat, because this provides a concept of the capacity of the industry, the entire infrastructure sector has an average growth rate of $12.5 billion/year and the public infrastructure sector less than $10 billion/year. And that’s taking out all the down years. It’s worth a note here that although I have conveniently removed down years from the data to get an average positive-year growth rates, infrastructure spending has never grown continuously for more than five consecutive years without experiencing a down year. The last 5 years 2012-2016 shows 3 years up 20%, then 2015 and 2016 were both down 1% to 1.5%. At the end of 2016, down 2.5% from the high in 2014, spending is still near all-time highs. In constant 2016$, The high was Q1’16 at $300 billion. The average lately is $280 billion, but expect to be back over $300 billion by Jan 18.
Infrastructure currently has the highest amount of work in backlog in history. Current backlog already accounts for 80% of all spending in 2017 and 60% of spending in 2018. Even with an anticipated decline in new starts in 2017, starting backlog for 2018 will still be at another new high. Spending from starting backlog is predicted to reach record levels in both 2017 and 2018. Early indications are that 2019 will repeat the same but that will depend on new starts in 2017 and 2018. Ignoring 2019 and beyond for the moment, for the next two years we are looking at record levels of spending on infrastructure.
The projected growth rate in infrastructure spending for the two-year period 2017-2018 is expected to reach the largest growth since the period 2005-2008. Construction Analytics (this analyst), FMI and ConstructConnect all predict growth between 10% and 13% or between $30 and $40 billion for this two-year period. My forecast does not include any spending input from a future infrastructure spending plan.

I said earlier that adding $100 billion and maintaining that level of spending for the next ten years is an unrealistic approach. Essentially, that would create an instantaneous need for 400,000 new jobs in the 1st year and then provide no jobs growth for the next nine years. Construction jobs can’t grow that fast. The maximum jobs growth ever achieved for all infrastructure was 50,000 jobs in a year. And now it’s worth repeating, only 60% of infrastructure is public work.
I’ve suggested another scenario for how it might be possible to ramp up to spend $1 trillion. In another article, Infrastructure – Ramping Up to Add $1 trillion, I laid out how it could be done in 13 years if spending were increased by $10 billion each year. I’ll add here that the entire infrastructure sector has not added a total of $1 trillion new spending in 25 years, so it’s quite unreasonable to assume it could be done in 10 years.
Infrastructure spending for 2017-2018 is about to exceed the historical average growth rate. Any infrastructure plan will replace some, but not all, of the currently planned new work. But it won’t replace any work already in backlog, which is at record levels and still contributes to spending over the next four years. So any infrastructure plan, for the most part, needs to be added on top of the current spending plan.
It would be extremely difficult to increase spending by another $10 billion/year when current spending is already expected at record levels. In fact, the look ahead for 2018 has spending already increasing by more than $20 billion. There is nothing in our history to suggest we could double the growth rate and sustain that level of spending. Of course, this will point back to the discussion of balance of jobs/volume and available labor in a potentially tight labor market.
The public infrastructure subset of the construction industry appears too small to accommodate a plan to add $1 trillion in spending, even when it only increases at $10 billion/year and absorbs 40,000 new jobs/year. Either the base that we hope to grow needs to be larger from the very beginning (Can public educational buildings be considered part of the plan?) or the rate of growth needs to be slower. Excessively rapid growth will only take volume and jobs away from normal growth, generally leads to rapid inflation and has a devastating effect when a massive program ends and all those jobs disappear.

Everything above here is based on new infrastructure plan spending “increasing” total construction spending. The plan is very difficult to achieve. However, if the $1 trillion dollars were used to fund projects that are already within the $150 to $170 billion in new public infrastructure projects that start every year, then there are no issues at all as to how fast or how much in funds can be spent. But that provides for no growth to the industry not already accounted for in the normal growth rate and it provides no new jobs. It simply funds projects that would have been built otherwise and funds the workers already in the industry to keep working. I don’t think this is what everyone has in mind.
For more on this discussion see Infrastructure Spending & Jobs This is a summary of the main points on Infrastructure from several recent articles. Those articles detail current market conditions, growth already in backlog and future growth potential
Infrastructure & Public Construction Spending
3-5-17
Infrastructure work does not normally grow in leaps and bounds.
Seldom does infrastructure construction spending grow by more than $10 billion in a year. Rarely does it grow by more than $20 billion.
Currently at about $300 billion a year, infrastructure represents only about 25% of all construction spending. The infrastructure sector is comprised of the longest duration type projects such as energy, highway/bridge, transportation terminals, railway and water/waste water resource development. It is not unusual for projects to take four to five years to reach completion.
Increasing new construction starts by $40 billion for new infrastructure work in any given year on average might add only $8 to $10 billion in spending in each of the next four or five years. To increase spending by $10 billion a year we would need to increase new starts by $40 billion every year. We’ve only ever come close to adding $40 billion in new starts once, in 2015.
In 2015, new infrastructure starts increased by $38 billion or 27%, due to an increase of $13 billion in new power generation plants and an increase of $21 billion in new LNG plants and port facilities. That will keep infrastructure spending growth elevated throughout 2018 and 2019. Measuring a total increase of 250% in power projects, that is a scenario unlikely to be duplicated in coming years.
2017 spending comes from: 10% 2014 starts; 35% 2015; 35% 2016 and 20% new starts in 2017.
Although new infrastructure starts were down in 2016 and are expected to decline again in 2017, the amount of work in backlog at the start of 2017 is the highest its ever been and spending in 2017 is forecast near the all-time (2015) high. Spending in 2018 from backlog will increase again and 2018 will hit another all-time high. There are no annual declines in spending predicted for the next four years. Some very large public infrastructure projects that started in 2014, 2015 and 2016 still contribute large amounts to spending in 2017 and well into 2018.
Increasing infrastructure spending by $10 billion a year would require adding about 35,000 to 40,000 new construction jobs per year. To accommodate all growth since the recession bottom, this sector averaged adding only 20,000 new jobs per year. Current spending growth is predicted to add $40 billion in work over the next three years and this will absorb all new heavy engineering jobs growth. The non-building infrastructure sector does not have the capacity at this time to increase spending by another $10 billion/year over its current growth rate, nor does it have the capacity to add an additional 40,000 jobs per year.
This summary of current projected spending does not include any future infrastructure work that might be generated from a proposed $1 trillion spending plan.
It is important to note here that 90% of all work in the power sector is private work. Only 60% of infrastructure work is publicly funded. However, some nonresidential building is publicly funded.

Public spending is not all public works projects.
Most public work is infrastructure, or public works projects. However, not all infrastructure is public work. The power market is the largest infrastructure market. But, already noted above, power work is mostly private. So the market responsible for one third of all infrastructure work is 90% private. Educational projects, typically considered nonresidential buildings, are 80% public and 20% private.

The two largest markets contributing to public spending are highway/bridge (32%) and educational (25%), together accounting for 57% of all public spending. The next largest market, transportation, is only about 10% of public spending.
Highway/bridge work fluctuates the most with large monthly swings up or down. However, 4 out of 5 times over the last 12 years, any large monthly move up or down was accompanied by a partially offsetting opposite move the following month. Highway spending hit an all-time high in 2015 and again in 2016.
Two of the three largest annual growth increases ever recorded in public spending were driven by educational spending. In the third largest growth year, highway just barely edged out educational spending for the top spot.
If educational work were to be considered part of future infrastructure expansion, then the maximum capacity to increase public infrastructure spending obviously increases. Together with other public works projects this could potentially provide a large enough market base to increase public infrastructure spending by $10 billion a year over and above the growth already in backlog or anticipated. But most of the added work would need to be to the education market. Even with potentially adding educational market work to the infrastructure expansion plan, the hope of expanding infrastructure spending by another $10 billion/year remains difficult at best.
Any increase to future work needs to be considered as over and above the spending growth patterns already due to work in backlog and new starts anticipated. This plot of predicted public spending does not include any future infrastructure work that might be generated from a proposed $1 trillion spending plan. About 80% of all spending in 2017 is already in backlog. About 50% of all the spending from Jan. 2018 through Jan. 2020 will already be in backlog by Jan. 2018.

The following article is an extension of this discussion Calls for Infrastructure Problematic
Behind the Headlines -Trend in Construction Spending
3-5-17
Headlines of construction spending declines are almost always premature.
The 1st release of January construction spending came out March 1. This initial release indicates a decline of 1% from December. Keep in mind, all 12 monthly reports in 2016 were subsequently revised up. Eight times in 2016 the 1st report of spending was down vs the previous month. After revisions, only two months were down compared to the previous month.

Monthly construction spending has been revised UP every one of the last 39 consecutive months. Since August 2013, the first report indicated a decline vs. the previous month 17 times. After revisions, there remain only seven real month/month declines in 39 months.
The 1st release of spending is almost always being compared to a previous month and a previous year that have been revised up. Upward revisions to monthly construction spending in 2016 have been as high as 3.4% and for the year average 1.1%/mo.
After spending is first published it is revised in each of the two following months. Then all the values for the entire year are revised when the May data release is issued on July 1 of the following year.
Most changes in monthly spending are predetermined.
Spending that occurs this month is generated from all the projects that are ongoing, some that started many months ago. In fact, some projects may have started three or four years ago. For instance, the largest decline in public spending this month is highway work. Although it has one of the smallest percent changes ( only -3.3% vs -12% to -16% for other markets), it is the largest share of total public spending. A very large amount work, 40% above normal, started in 2013 – early 2014. Some of that work is just now finishing. It could be seen a year ago in the cash flow models that a very large sum of work would be ending sometime in Q4’16 or Q1’17. It often occurs that the largest changes in monthly spending are driven by work ending rather than new work beginning.
Nonresidential buildings has the largest backlog ever.
Both Residential and Non-building Infrastructure will increase in 2017 after brief slowdowns but Nonresidential Buildings will lead construction spending in 2017, accounting for more than half of all 2017 growth. Office and commercial retail and then educational provide the most dollar volume growth in 2017.
Nonresidential buildings 2017 starting backlog is 45% higher than at the start of 2014, the beginning of the current growth cycle. Current year spending from starting backlog has increased every year and in 2017 it will be up 35% over 2014. About 75% to 80% of all nonresidential buildings construction spending in 2017 will be generated by projects that are already underway (in backlog). Only 20% to 25% of all spending in 2017 will come from new projects that start in 2017.
New construction starts in the final three months of 2016, although well below the yearly highs reached in August and September, helped carry 2016 new starts to an eight-year high. Nonresidential Buildings starts for the last six months averaged the highest since the 1st half of 2008.
Jobs growth may look quite slow this year.
Jobs growth over time follows closely to volume growth, not spending growth. Real volume growth is spending minus inflation. I’m predicting 6% spending growth in 2017, but after inflation that represents less than 2% volume growth. Therefore, we may add less than 2% new jobs in 2017, or less than 140,000 new jobs. An imbalance in growth between jobs and volume does sometimes occur. In the last 25 years that annual imbalance, whether up or down, has exceeded 3% only six times. Those six years were all either construction boom years or recessions. For all the other years, the difference in growth between jobs and volume has averaged less than 1%. Whether we look at the last four-year period or the last eight-year period, jobs and volume growth have been within 2%.
Housing Starts vs Residential Construction Spending
2-18-17
Housing Starts (# of units started as reported by U.S. Census) can be erratic from month to month and short term changes in growth can sometimes be misleading. Trends should be looked at over longer term periods. New monthly starts on a seasonally adjusted annual rate (SAAR) basis for the last eight months through January 2017 have now averaged over 1,200,000. For the last four months starts have averaged 1,250,000. Permits have been following a similar pattern. Although starts versus permits varies considerably in some months, statistically they follow the same growth pattern. Growth in the number of new starts has been 5% to 25% per year due to erratic movement but in the longer term has averaged 18%/yr over six years since January 2011. We experienced an un-sustained start to recovery in 2010, but essentially we went through a protracted bottom between 500,000 and 600,000 new starts that lasted all throughout 2009-2010.

Dodge Data reports SAAR new residential construction starts by contract value in current dollars (not inflation adjusted). Unadjusted growth for the same six-year period increased from $120 billion SAAR to over $300 billion SAAR, or at an annual rate of over 25%/year. However, there was 25% residential cost inflation during that period. In constant 2016$, Dodge new residential starts growth averages 20%/year for six years since January 2011.

Now let’s look at construction spending, actual dollar value of work put-in-place. Here’s where the data has a disconnect.
At the start of 2011, total residential spending had a monthly SAAR of $240 billion and at the end of 2016 was $470 billion, an increase of 16%/year for 6 years. To find real volume growth those values must be adjusted for inflation. After adjusting for inflation, the actual spending volume growth in 2016$ from 2011 through the end of 2016 increased from $305 billion to $465 billion, an increase of 52%, or an average increase of 9%/year for 6 years.

Furthermore, the number of residential construction jobs reported by BLS increased only 33% over that time, an average growth rate of less than 6%/year.

What could explain these differences?
The low rate of jobs growth compared to spending growth is partially explained by the fact that in the preceding few years, even though about 1.5 million jobs were lost, 40% of the workforce, staff was not reduced nearly at the same rate that residential construction volume declined (55%). There remained significantly more staff on payrolls than was needed to complete the amount of volume that was being built during the residential recession. When growth resumed, spending increased at a much faster rate than new jobs were added and the excess labor slack was reduced. I suspect also that a portion of the labor vs spending difference is explained by the fact that not all jobs are captured by BLS. It has been suggested that a large percentage of residential workforce in some southwestern states is undocumented.
The variance between starts and spending is a bit more complicated. We need to look at completions vs starts, the mix and size of housing units being built and the amount of spending related to renovations.
The most commonly reported housing statistic is housing starts. Also in that data series is housing completions. Housing completions are always lower than starts. For the last five years completions have averaged almost 15% less than starts. While the growth in starts averaged 18%/year, growth in completions from 2011 through 2016 averages less than 15%/year.
From 2011 to 2016 the average number of new single family (SF) units started increased from about 450,000 to 800,000. During that same period multi-family (MF) starts increased from 100,000 to 440,000. The percentage of MF units in total construction grew from 18% to 36% of total.
On average MF units are about half the size of SF units. Although the average size of SF homes increased about 10% during this period, the growth in the number of smaller MF units exceeded that of larger MF units by a factor of 2x. The ratio of smaller MF units doubled.
The share of MF units as a percent of all units doubled and the ratio of smaller vs larger MF units doubled. The total square feet of housing being built increased but did not grow at the same rate as the number of units. The average size of all units is getting smaller and therefore the constant cost per unit went down.
I suspect the increased ratio of smaller MF units and the percent increase of MF within the total number of all housing units has a big influence on the overall average cost per unit of total housing. That with the lower growth rate in completions helps explain why spending is not increasing at the same rate as overall number of housing unit starts. We are building more units per dollar spending because average unit size is smaller.
There is one more hidden factor to look at. That is, residential construction spending includes renovations. From 2009 through 2012 renovations totaled 45% of all residential spending. It began to decrease in 2013. For the last three years, renovation spending accounts for only 33% of all residential construction spending. Renovation spending has no comparable # of units or total square feet associated with it.

The impact this has, since the share of renovations spending is declining, is to increase the percent growth in residential spending attributable to housing units to greater than the 9% calculated above. Removing renovations work from total spending shows growth in real inflation adjusted spending specific to housing units averaged about 13%/year for 6 years.
Summarizing everything from above, since 2011:
On the surface it looks like this:
- Housing Starts # of units increased at 18%/year
- Residential new starts in unadjusted dollars increased 20%/year
- Residential construction spending increased 16%/year
After adjusting both units and spending we get:
- Inflation adjusted total residential spending increased 9%/year
- Inflation adjusted spending on units (excluding renovations) increased 13%/year
- Growth in the # of housing units completed increased 15%/year
- Share of Multifamily units has increased
- Average size of multifamily units has decreased
- Average size of all housing units being completed has grown smaller
- The growth in the number of units completed can exceed the growth in spending because the average constant value cost per unit has decreased
The growth in the number of housing unit starts is NOT an indicator to use for forecasting growth in residential construction spending or constant volume. Increases in the number of units alone will not give a realistic indication of growth in residential jobs or spending. The rate of growth in completions, combined with the ratio of the sizes of units, not just size of SF homes but average size of all SF and MF units, has a significant influence on the spending volume and can only be compared to inflation adjusted spending specific to units, that is, total spending minus renovations.
BTH – 20 Snips From Recent Articles
2-17-17 Behind The Headlines
- From the Jan 2011 bottom of the recession in construction to current, both net jobs (jobs x hours worked) and volume (spending after adjusted for inflation) have increased equally by 28%.
- Growth of only 100,00 to 140,000 new jobs in 2017 would be the slowest growth in 5 years and will look like a hiring slowdown. Some might attribute it to lack of available workers. In large part it may be due to a balancing of workforce to real volume growth.
- Staffing patterns (appear to) lag changes in work volume.
- These six Nonresidential Buildings markets, which make up 80% of all nonresidential buildings spending, posted the following growth in starts leading into 2017: Office +37%, Lodging +40%, Educational +11%, Healthcare +21%, Commercial Retail +11% and Amusement/Recreation +21%
- Nonresidential buildings 2017 starting backlog is 45% higher than at the start of 2014, the beginning of the current nonres bldgs growth cycle.
- Office construction starting backlog for 2017 (projects under contract as of Jan 1, 2017) is the highest in at least 8 years, more than double at the start of 2014 when the current growth cycle of office construction spending began.
- For 2017, the amount of construction spending (on manufacturing buildings) from starting backlog has dropped 25% from the level of 2016. Even an increase of 50% in new 2017 starts would not make up for that loss.
- More infrastructure projects started construction in the 1st 6mo of 2015 than any time in history. This will boost infrastructure spending through 2017.
- As measured in comparable constant dollars, No, we are not back to previous levels of spending. We will probably not return to previous highs before 2020.
- The entire construction industry best growth rate ever achieved (in 2016 constant$) absorbed $1 trillion in new spending over 5 years. Infrastructure has not absorbed $1 trillion newly added work in 25 years.
- long term best average rates of growth (indicate) we could increase infrastructure spending through new stimulus between $7 billion to $10 billion a year
- Construction spending, from 1st release to last revision of data, has been revised upward every month since August 2013. That would indicate the first reports of an “unexpected decline” almost always get revised up in following months.
- In the last 36 months, there were 16 Census construction spending releases that initially showed a decline vs the previous month. Five months showed a decline vs the previous year. After revisions every month was revised up from the original posted amount. There remained only 2 significant mo/mo declines. There were no remaining year/year declines.
- Current year YTD “not-yet-revised” values for new construction starts are always compared to the previous year YTD “revised values” which has the affect of making current year growth appear lower than it should. In the last 10 years the YTD revisions to previous year values have never been down.
- Residential starts in 2016 posted the best year since 2005-2006. Residential starts bottomed in 2009 and have now posted the 7th consecutive year of growth.
- Total construction spending in 2017 will reach $1,236 billion supported by a 4th consecutive year of strong growth in nonresidential buildings.
- Office construction reached a new all-time high in September 2016. Spending will be in the range of +20% to +30% year over year growth for 2017 with total coming in at $91 billion.
- It’s real damn hard to add $100 billion in new construction volume in a year. After adjusting for inflation, construction volume has never increased by $100 billion. It has increased by $75 billion 4 times and 3 more times by $50 billion.
- If you want to avoid misusing a cost index, understand what it measures.
- Selling Price, by definition whole building actual final cost, tracks the final cost of construction. Selling price indices should be used to (adjust costs for inflation so you can) compare costs over time.
Behind The Headlines – Construction Jobs
2-16-17
- In the six months from Oct’15 to Mar’16 construction added 225,000 jobs, the most in any six month period since the Oct-Mar 2005-2006, the very peak of the construction spending boom.
- In the last three years, we’ve added 840,000 construction jobs. We’ve also increased hours worked to an equivalent to 880,000 jobs, growth of 15%. That’s a faster rate of growth in three years than the 2004-2006 construction boom.
- In order to track jobs growth compared to the real amount of work put-in-place, construction spending must be adjusted for inflation to get real volume of work completed. The adjustment gives us what is referred to as “constant dollars.” Jobs must be adjusted for hours worked.
- For much of 2014 and 2015 construction spending real volume growth was exceeding jobs growth, but for 10 months from August 2015 through May 2016, volume growth stalled and (completely contrary to what one would expect in a labor shortage) new jobs growth exceeded volume by 3%. Only in the last few months has volume growth begun to outpace jobs growth again.
- From the Jan 2011 bottom of the recession in construction to current, both net jobs (jobs x hours worked) and volume (spending after adjusted for inflation) have increased equally by 28%.
- For 2017, several economists (including myself) are predicting total construction spending will increase by just over 6%. However, I’m also predicting that combined construction inflation for all sectors will increase by 4.0% to 4.5%. That leaves us with a net volume growth of only 1.5% to 2.0%. Therefore, for 2017, we should not expect jobs to increase by more than 1.5% to 2.0%, or 100,000 to 140,000.
- Growth of only 100,00 to 140,000 new jobs in 2017 would be the slowest growth in 5 years and will look like a growth slowdown. Some might attribute it to lack of available workers. In large part it may be due to a balancing of workforce to real volume growth.
- Jobs growth is often slightly out-of-balance with real volume growth. But it does tend to come back to balance. If both were to grow at the same rate then productivity would remain unchanged. It will very likely vary slightly from balanced growth.

Infrastructure – Ramping Up to Add $1 trillion
1-30-17
How long would it take to accommodate adding $1 trillion of new infrastructure construction spending?
I read this in another recent article on the topic; “If passed, the ripple effect of an estimated $100 billion a year in new infrastructure construction would undoubtedly be felt throughout the industry.”
The article seems to imply the industry could absorb $100 billion in new infrastructure work and maintain that $100 billion added spending for 10 years. The infrastructure sector could not accommodate that massive amount of instantaneous growth. Let’s look at maximum historical rates of growth to understand why.

To really understand construction growth rates we need to look at all historical spending in constant dollars (inflation adjusted).All constant dollars in this analysis are converted to 2016$.The following spending historical data goes back to 1993. Jobs data goes back to 1970.
- Construction Industry total spending fastest rates of growth:
- Maximum growth one year, 2015, +$107 billion, in 2016$= $87 billion
- 2011 – 2015, 4 yrs, +$324 billion, in 2016$ = +$240 billion = $60bil/yr.
- 1995 to 1999, 4 yrs, +$200 billion, in 2016$ = +$200 billion = $50bil/yr.
- Infrastructure Sector spending fastest rates of growth:
- Maximum growth one year, 2007, +$40 billion, in 2016$= $36 billion
- 2005 – 2008, 3 yrs, +$87 billion, in 2016$ = +$52 billion = $17bil/yr.
- 1997 – 2001, 4 yrs, +$50 billion, in 2016$ = +$46 billion = $15bil/yr.
- Construction Industry Jobs fastest rates of growth:
- Maximum growth one year, 1999, 397,000 jobs
- 4 years from 1995 to 1999, average 317,000 jobs/year.
- 3 years from 2012 to 2015, average 266,000 jobs/year.
- Infrastructure Sector Jobs fastest rates of growth:
- Maximum growth one year, 2004, 65,000 jobs
- 3 years from 2003 to 2006, average 48,000 jobs/year
- 3 years from 2011 to 2014, average 26,000 jobs/year
The fastest one-year growth for the entire construction industry is $87 billion in 2015, but the fastest growth rate is never maintained for long. The period 2011-2015 is the highest average rate of growth at $60 billion/year. The entire industry has had jobs growth of more than 300,000/year only 6 times since 1970. 1995 to 1999 is the only period to average over 300,000 jobs/year longer than 2 years.
Infrastructure is only 25% of all construction work. The entire construction industry best growth rate ever achieved (in 2016$) absorbed $1 trillion in new spending over 5 years. Infrastructure has not absorbed $1 trillion newly added work in 25 years. The fastest one-year growth for the Infrastructure sector is $36 billion in 2007, but the highest average rate of growth is $17 billion/year. The current rate of growth since the recession is $10 billion/year.
The infrastructure sector has had jobs growth of more than 40,000/year only 3 times since 1993. Maximum jobs growth hit 65,000 in 2007. The best average jobs growth is 48,000 jobs/year and that has not occurred in the last 10 years. It’s the only period with average growth more than 26,000 jobs.
Let’s assume the fastest rates of growth can be duplicated once again. Let’s also assume that longer term growth will come closer to the long term average highs. So, infrastructure growth might reach $36 billion in a given year but could fall back to an average growth of $17 billion/year. Jobs could grow by 65,000/year but would probably average less than 48,000/year.
However, even with the addition of a new influx of infrastructure work, most of the other growth, which has been fairly constant for the last 25 years, is not going to go away. Since the recession, infrastructure has been increasing at $10 billion/year and jobs have been increasing 20,000/year. Assuming we maintain that level of normal infrastructure growth, then the remainder is what we might expect to accommodate in growth from new infrastructure stimulus.
If we could achieve maximum rates of growth we could increase infrastructure additionally through new stimulus by $26 billion/ year and increase jobs by 45,000/year.
If we could maintain long term best average rates of growth we could increase infrastructure through new stimulus by $7 billion/year and increase jobs by 28,000/year. Even if a portion of the normal growth goes away, it looks like the infrastructure sector could only accommodate adding about $10 billion/year in new stimulus work.
It must be noted that a large portion of infrastructure spending is private work, not publicly funded. Power is 90% private, 10% public. Highway is 100% public. Transportation is 30% private, 70% public. Sewage, Water and Conservation are 100% public. Communication is 100% private.
Fully 35% of all infrastructure work is private. Most of the huge increases in spending over the years are associated with the Power market. So this analysis counters any argument that publicly funded infrastructure can grow much faster. In fact, if only public works were taken into account, spending targets here would need to be reduced by 35% and the total duration to complete would be increased by 50%.
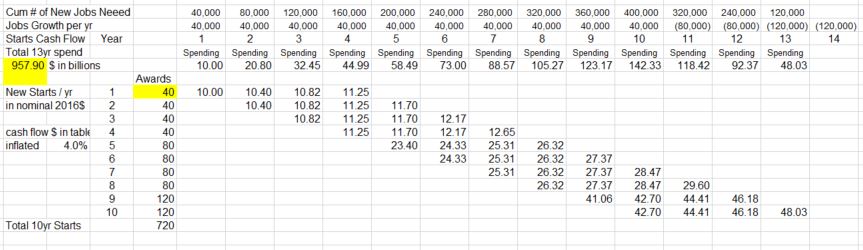
A cash flow schedule of all newly added work provided the plan needed to balance spending. All new work is assumed to take 4 years to complete. In the first year, $40 billion of new work starts, but only $10 billion gets spent. Spending flows at the rate of $10 billion/year for 4 years. New starts are added at a rate to continuously increase spending by $10 billion/year. By the 5th year we need to add $80 billion in new starts to get $20 billion in spending since all of year 1 work is now completed.
This table gives an indication of how cash flows. The full 13 year table is below.

I have assumed that inflation will add 4%/year to future spending. Five years from now the equivalent to adding $10 billion a year will be $12.2 billion a year. Due to inflation, we would spend $1 trillion to build the equivalent of $750 billion in today’s dollars. Increasing spending by the inflation adjusted equivalent of $10 billion per year, it would take 12 to 13 years to spend $1 trillion.
This scenario would push total infrastructure spending to the highest rates of long term growth on record. It’s not very likely growth like that could be sustained for very long. So, it’s possible total growth would fluctuate yet that we still keep our sights on achieving those long term growth rates. This allows for no economic downturn at any time in the next 10 years.
Another restraint to maximum growth rates is jobs. Infrastructure is only 25% of all construction. Maximum all construction jobs growth has exceeded 300,000/year a few times, but infrastructure jobs have increased by more than 40,000 only rarely and only once averaged over 40,000. While it takes about 5,000 to 6,000 workers to put-in-place $1 billion in construction, it takes only about 3,000 to 4,000 workers to put-in-place $1 billion of infrastructure. To reach maximum growth of $36 billion in infrastructure would require 110,000 to 140,000 new jobs per year, two to three times the long term growth. This analysis does not take into consideration any shortfall in jobs due to labor availability.
Setting spending growth to $10 billion/year results in 10 years of continuous record jobs and spending growth. Expectations of increasing infrastructure spending (not to be confused with starts) by $40 billion/year or $50 billion/year have not taken into consideration the maximum sustained growth rates in the industry. Talk of increasing infrastructure spending by $100 billion in a year is fantasizing.
added 2-2-17
In recent reading I came across a comment that both Educational and Health Care markets potentially could be included in Infrastructure funding. I take that to mean the public portion of those markets. Educational could be considered infrastructure and is 80% public ($70/$88bil). I would guess also Public Safety and Public Power could be included. Educational public spending is $70 billion/year. The others are $8 billion each. The short version of all the explanation above is that new infrastructure investment can grow a market at about half of the best total long term average growth of 10%/year. So these markets could absorb growth of about 5% or about $5 billion/year more.

More about Infrastructure written 3-6-17 Calls for Infrastructure Problematic
Behind The Headlines – Construction #s
1-28-17
Stuff you won’t read in the headlines.
- Total Construction spending for the last 3 months is at a 10 year high. However, in constant inflation adjusted dollars, construction spending is still 16% below 10 years ago. Are We at New Peak Construction Spending?
- In the last 36 months, there were 16 Census construction spending releases that initially showed a decline vs the previous month. Five months showed a decline vs the previous year. After revisions every month was revised up from the original posted amount. There remained only 2 significant mo/mo declines. There were no remaining year/year declines. Construction Spending Gets Revised UP
- Nonresidential Bldgs new starts (by Dodge Data) in the 2nd half of 2016 posted the best #s since the pre-recession boom. New Construction Starts 2016
- Nonresidential construction spending within the year is far more dependent on construction starts from previous years than on new starts within the year. Only 20%-25% of all spending within the year comes from new starts within the year. Behind The Headlines – Construction Backlog
- If Nonresidential New Starts for 2017 fall short of projections by 10%, it would reduce total 2017 nonresidential spending by 2.0% to 2.5%.
- 25% of all spending on nonresidential bldgs in 2017 comes from projects that started in 2015.
- 25% of all spending on non-building infrastructure in 2017 comes from projects that started between July 2014 and May 2015. That unusually high period contributes more to 2017 spending than all new infrastructure starts in 2017. Infrastructure Outlook 2017
- Monthly rate of spending for nonresidential bldgs will reach a new all-time current dollar high by midyear 2017. Behind The Headlines – Nonres Bldgs Construction Spending
- In constant inflation adjusted dollars, 2017 nonresidential bldgs spending will still be lower than any year from 1995 to 2009, 16% below the 2000 peak. Behind The Headlines – Nonres Bldgs Construction Spending
- New construction starts in 2016 for Office buildings as compared to 2015 went from -1% year-to-date in July to +30% ytd in September. Good example that we need to be careful because monthly variation sometimes messes up those comparisons. New Construction Starts 2016
