Home » Spending (Page 5)
Category Archives: Spending
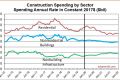
Construction Spending Forecasts for 2020 Do Not Support Jobs Growth
1-31-20
A current article and several others, based on a sentiment survey, state that there will not be enough construction workers to support growing construction activity next year. I dispute that claim.
Construction is in demand – but who’s going to do all the work?
I’ve been writing about the disparity in jobs growth exceeding construction activity growth for more than two years. Construction activity has NOT been increasing to support jobs growth.
2020 Construction Spending Increases, but Volume is Down
Expect Construction Jobs Growth to Slow in 2020
To Support Construction Jobs, We Need Volume
There are other construction forecasts that support my argument. It’s important to point out that my forecast is the HIGHEST for 2020. So, just keep in mind, if you consider any other forecast, the condition gets worse.
Seven of the eight firms that provided a forecast for the AIA Consensus Forecast are lower than Construction Analytics forecast for nonresidential work in 2020. AIA Consensus > marked slowdown for nonresidential building
ConstructConnect’s forecast is lower than my forecast for all sectors ConstructConnect’s Winter 2019-20 Put-In-Place Construction Forecasts
FMI’s forecast is lower for all sectors FMI U.S. Engineering and Construction Outlook: Third Quarter 2019 Report
Overall, Construction Analytics 2020 forecast shows a volume gain of 0.6%. Spending increase 4.6%, but average inflation is 4%. Therefore volume increases only 0.6%. That would support growth of about 50,000 jobs. Residential and Non-building Infrastructure show slight gains in 2020 but Nonresidential buildings volume is in it’s 4th year of decline.
ConstructConnect shows a total spending increase of 1.9% and FMI shows a total spending increase of 1%. Both show a slight gain in volume in at least one sector, but with expected inflation of around 4%, both would indicate an overall decline in volume and a decline in jobs.
Spending needs to increase greater than inflation to realize an increase in volume. If volume does not increase, there is no support to add jobs.

2020 Construction Forecast Briefs
2020 Construction Forecast Briefs
12-23-19 updated 1-4-20
updated 1-4-20 – The construction spending forecast for 2019 is revised up to $1,304 billion, still a decrease of 0.2% vs 2018. Almost all of the revision up is residential spending that was added in Oct and Sept Census spending revisions released 1-3-20.
The forecast for 2020 construction spending is $1,360 billion, up 4.5% over 2019.
Total Spending increased 9%/yr. from 2012 to 2016, then in 2017 and 2018 slowed to 4%/yr. Spending declined <1% in 2019 and is forecast up 3% to 4% for both 2020 and 2021.
New construction starts, as reported by Dodge Data and Analytics, increased 7%/year in 2016 and 2017, but only 3% in 2018. Starts are forecast to decline slightly in 2019 and 2020.
New construction starts data captures a share of the total market or a portion of all construction spending, on average about 60% of all construction. In this analysis every market is adjusted by its own individual market share factor.
Applying the market share factors, starts are forecast up slightly in both 2019 and 2020.
Backlog reaches a post-recession high starting 2020, up 20% from 2017, up 100% from 2013. Starts and backlog growth are forecast to remain below 3%/year gain or decline over the next few years. Total spending has only slight gains in 2021 and 2022.
Backlog at the beginning of the year or new starts within the year does not give an indication of what spending will be like within the year. Backlog increases if new starts during the year is greater than spending during the year. An increase in backlog could be a level rate of market activity for a longer duration. It takes several years for all the starts in a year to be completed. Cash flow shows the spending over time.
The best indicator of future construction activity is the sum of the projected cash flow generated by all the construction starts that have been recorded.
plots updated 1-4-20
Spending cash flow predicted from Dodge Starts and construction spending to date.

A what if scenario in which new construction starts drop by 10%:
On average about 20% of new nonresidential construction starts gets spent within the year started, 50% is spent in the next year and 30% is spent in future years. (For residential the spending curve is more like 70%-30%). If new starts drop by 10% this year, that has only a -2% impact on total nonresidential buildings spending for this year. It would be -5% next year, -3% after. If starts drop a second year, the same impacts occur, shifted one year out, and the total impact for both years is added.
Only about 30% of residential spending within the year comes from backlog and 70% from new starts. If residential new starts drop 10% that impacts total residential spending by 7% in that year.
Nonresidential Buildings starts (excluding Terminals) have reached a new high every year since 2009, but the last three years starts are up only 2% to 3%/year. Every market posted increases in 2017 and 2018. Only Commercial/Retail and Amusement/Recreation declined in 2019. Backlog for Office Buildings, which includes data centers, is up 100%+ since 2015. Spending is still up 4% in 2020 but then with the slowdown in starts forecast in 2020, backlog growth stalls and spending slows in 2021-2022.
Nonresidential buildings markets advancing in 2020-2021 are Educational, Healthcare, Office and Manufacturing. Markets declining are Amusement/Recreation, Commercial/Retail and Lodging.
Non-building Infrastructure starts (including Terminals), up 4% in 2019, are at an all-time high. The two markets with the largest share of new starts are Highway/Bridge and Transportation. Transportation terminals and rail starts are up 30% in the last three years, but backlog has nearly doubled because a large portion of those starts is very long duration projects. Starts are forecast up only 1% in 2020 but backlog peaks in 2021. Spending increases are in the 6% to 8% range at least for the next two years.
Spending in recent years has been boosted by Transportation terminals, Highway and Public Works projects. Power is flat or down slightly.
Residential starts averaged 19%/year growth from 2012 to 2016 but slowed to 5%/year for 2017 and 2018. Starts declined in 2019 and are forecast to decline again in 2020.
The outlook for residential construction spending has improved slightly. Previous forecast had residential spending in 2019 down 6% and 2020 up only 2%. That’s been revised to now forecast 2019 down 4.5% and 2020 up 5%. Spending holds steady in 2021.
If spending is increasing 3%/year at a time when inflation is 5%/year, then real volume is declining. In the last two years, spending increased only 3%, but construction inflation totaled 9%, therefore
in two years, real volume declined by 6%, yet jobs increased by 7.5%.
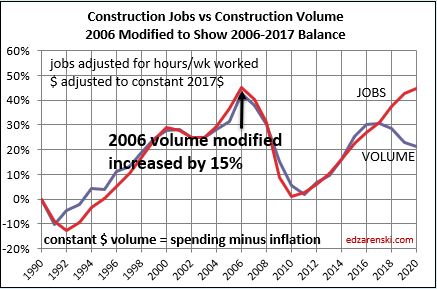
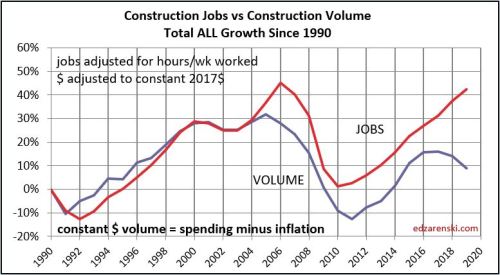
Since early 2018, jobs have been increasing while construction volume is declining. The volume of work in the last two years does not support jobs growth.
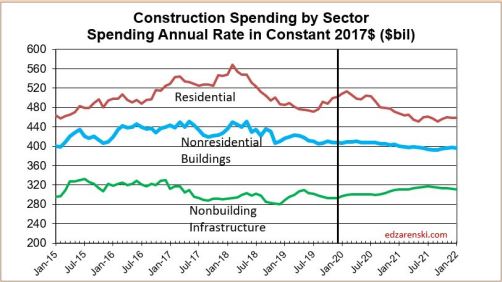
Volume, spending adjusted for inflation in Constant 2017$

Nonresidential Buildings will post declines in volume in 2020 & 2021. Residential volume gains 1% in 2020 but slips again in 2021. Non-building Infrastructure will increase volume about 3%/year. Overall, total construction volume declined in 4 of the last 6 quarters and is forecast to drop slightly in 2 or 3 quarters in 2020.
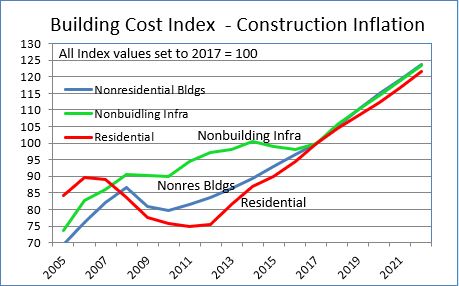
One of the best predictors of construction inflation is the level of activity in an area. When the activity level is low, contractors are all competing for a smaller amount of work and therefore they may reduce margins in bids. When activity is high, there is a greater opportunity to bid on more work and bids can be higher. The level of activity has a direct impact on inflation.
Volume declines should lead to lower inflation as firms compete for fewer new projects. However, if jobs growth continues while volume declines, then productivity continues to decline and that will add to labor cost inflation.
Jobs vs Volume growth set to base year 2011

Average long-term nonresidential buildings inflation excluding recession years is 4.2%.
Average long-term (30 years) nonresidential construction cost inflation is 3.5% even with any/all recession years included.
Nonresidential buildings cost inflation for 2018 and 2019 averaged 5%. It’s predicted closer to 4.5% for 2020 and 4% for 2021.
Residential buildings cost inflation for 2018 and 2019 averaged 4%. It’s predicted at 3.75% for 2020 and 2021.
For more on the 2020 Forecast see these

2020 Construction Spending Increases, but Volume is Down
12-10-19 updated 1-4-20
2020 Construction Forecast
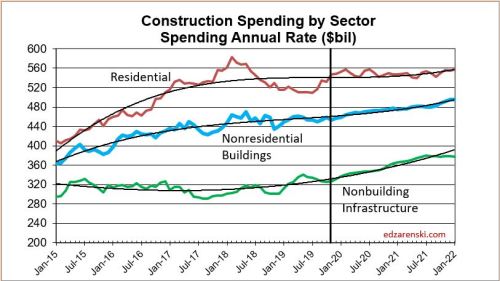
Construction Spending for 2019 finishes flat for Nonresidential Buildings, Up 7% for Non-building Infrastructure and Down 5% for Residential.
Spending UNadjusted for inflation.
After adjusting for inflation, we see that real construction volume is down. Only Non-building Infrastructure realizes gains in 2019 & 2020. Nonresidential Buildings Volume has been up and down since Q1 2017. Residential volume has been declining since early 2018.
Volume, spending adjusted for inflation in Constant 2017$

I’m predicting Nonresidential Buildings will post declines in volume in 2020 & 2021. Residential gains 1% in 2020 but slips again in 2021. Non-building Infrastructure will increase at about 3%/year. Overall, total construction volume declined in 4 of the last 6 quarters and is forecast to drop slightly in 2 or 3 quarters in 2020.
Volume declines drive labor to slower growth. We had 6 years of 250,000-300,000 annual growth. Jobs will increase only 150,000 in 2019. In 2020, it could be lower to 100,000.
After 2006, and all the way to 2017, jobs and volume growth were pretty equal. Since 2017 there is a divergence forming. That can’t be sustained.
Jobs vs Volume growth set to base 2006
See the Jobs analysis here Expect Construction Jobs Growth to Slow in 2020
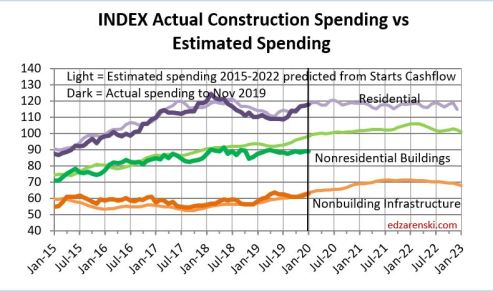
The plot below shows the predicted spending from modeling Dodge data new construction starts. Overlaying this plot is the actual census spending. You can see the actual value follows pretty closely to the predicted. None of this data is adjusted for inflation.
Spending predicted from Dodge Starts and actual spending to date.
Healthcare and Office are strong markets in 2020, as well as Highway, Transportation and Public Works. Backlog is strongest for Non-building Infrastructure leading into 2021. In the three years since 2017, backlog in Transportation is up 80%, Environmental Public Works up 40%. Within nonresidential buildings, Office backlog is up 60%, Educational is up 15% and Healthcare up 25%. Commercial Retail is the only market with a decline in backlog over this three year period, down 15%.
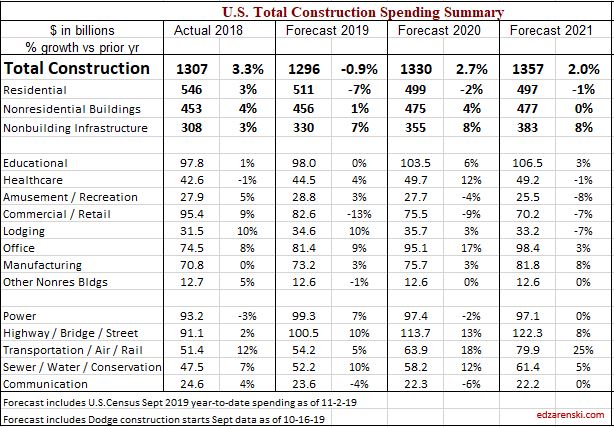
Table of Spending by Market Type. updated 1-4-20
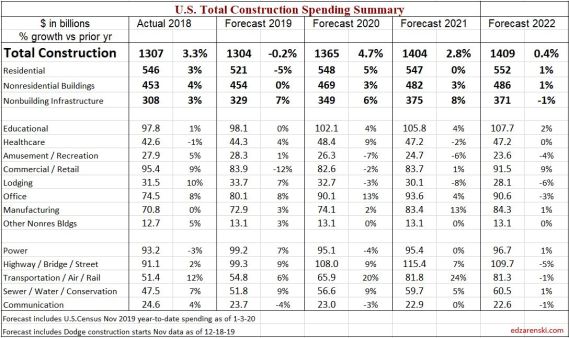
A reminder, You can’t interpret new construction starts directly to backlog or spending. Starts growth is one thing, but starts data requires cash flow modeling to get spending. Why are Transportation starts for 2018+2019 down 35% but both 2019 and 2020 spending are up? Because in 2017, the year before the data in this table, starts were up 75% and much of that was very long duration work, some that potentially has peak spending 3 to 4 years out, so is still adding a boost to 2020 spending and backlog.

For more on the 2020 Forecast see these:
2020 Construction Forecast Briefs
Expect Construction Jobs Growth to Slow in 2020
Construction Starts > Cashflow > Backlog > Spending
The path from construction starts to spending is not direct and not quite as simple as you might think. Spending is the market activity measure that drives all construction economics, so that’s where we need to get too. With an appropriate modeling technique we can get from new starts to predicted spending in a few steps.

New Construction Starts (construction starts referred to here is Dodge Data & Analytics New Construction Starts) is excellent data for forecasting. The following forecast is entirely developed from starts data. No actual spending is incorporated into this forecast. The purpose is to show that using the data properly can produce an accurate forecast.
The starts data is a survey. As in any survey, starts represents a portion of new construction activity. Study shows the survey size varies with each market from about 40% to 70% of actual. Starts data captures a share of the total market or a portion of all construction, on average about 60% of all construction.
The easiest way to understand this is to compare total annual construction starts to total annual spending. National construction starts from 2016 to 2019 range from $750 billion/year to $800 billion/year, while spending in this period ranges from $1,200 billion/year to $1,300 billion/year. From this we see starts data captures a share of about 60% of the total construction market.
The total starts survey averages about 60% of the actual market. In this analysis every market is adjusted by its own individual market share factor. The adjusted starts represent the full amount of starts that would generate the full amount of spending.
To predict spending activity from new construction starts, the starts data must be spread over time using appropriate cash flow curves. On average about 20% of new construction starts gets spent within the year started, 50% is spent in the next year and 30% is spent in years three and four. The cash flow curves used in this model are specific to each market type and can vary from the average.
Applying a market survey factor to develop full magnitude of spending and an expected duration for all starts, depending on market type, to produce a forecast cash flow from starts data, the predicted pattern of spending is developed. The factors have been shown to produce a reliable prediction of total future market activity.

Backlog at the beginning of the year or new starts within the year does not give an indication of spending within the year. New starts within the year could contribute spending spread out over several years. Total cash flow in the year, or spending, could include cash flow from projects that started or entered backlog years ago.
Backlog increases if new starts during the year is greater than spending during the year. However, an increase in backlog does not necessarily indicate there will be an increase in market activity. An increase in backlog could represent a level rate of market activity, but for a longer duration.
Cash flow provides the best indicator of how much and when spending will occur. Cash flow from all previous starts gives a prediction of how spending will change monthly from all projects in backlog. Cash flow totals of all jobs can vary considerably from month to month, are not only driven by new jobs starting but also old jobs ending, and are heavily dependent on the type, size and duration of jobs.
Total of all national construction starts increased every year since 2008. New starts slowed to +2% in 2018 and are forecast at a potential decline of 0.2% in 2019. Backlog is still up leading into 2020 but after that starts and backlog are forecast to remain flat or decline over the next few years. Total spending declines in 2022. However, as the next tables will show, work distribution is uneven with residential declining and nonresidential up.

Nonresidential Buildings starts (excluding Terminals) reached a new high every year since 2009. The last three years starts are up 3% to 4% per year. Every market posted increases in 2017 and 2018. Only Commercial/Retail declined in 2019. The largest increases over the last two years were Educational and Office Buildings. Spending is still strong in 2020 but then with the slowdown in starts forecast in 2020, backlog growth stalls and spending slows in 2021-2022.
75%-80% of all Nonresidential Buildings spending within the year will be generated from projects that were booked in starting backlog at the beginning of the year.

Nonbuilding Infrastructure markets total spending amounts to only about 70% of nonresidential buildings markets. The largest infrastructure markets are Highway/Bridge and Power but the largest increases in new starts recently are in Transportation (including all terminals) and Environmental Public Works. Transportation starts are up 25% in the last last three years and backlog to start 2020 is up 80%. Public Works starts are up 22% and backlog is up 30%
Nonbuilding Infrastructure starts can be erratic with a long pattern of up then down years. Starts (including Terminals) gained only 2% in 2019 but that is only low because Power, the largest market overall saw starts decline by 7%. Total infrastructure starts are at an all-time high.
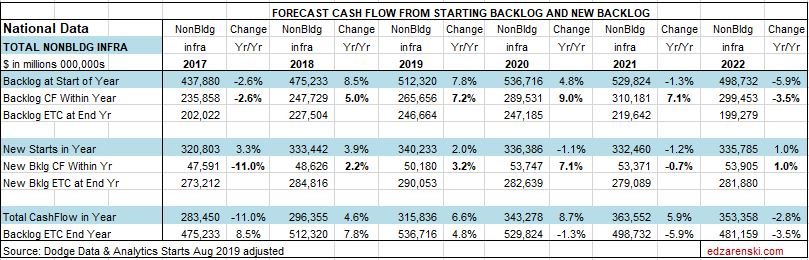
Infrastructure backlog peaks in 2020 and remains high into 2021. Spending increases are in the 6% to 8% range at least for the next two years. Infrastructure projects typically have the longest duration. Projects contribute spending sometimes up to 5 or 6 years. The largest spending increases in 2020 are in Transportation and Highway projects.
The Residential table shows that most of the spending in any year is cash flow from new starts. For short duration residential spending, single-family residential and renovations work, approximately 75% of the spending occurs in the year of the starts and 20% in the following year.
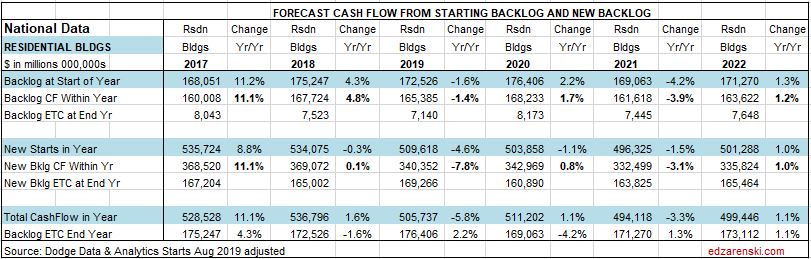
For long duration residential spending, typical of multifamily residential, approximately 50%-55% of the spending occurs in the year of the start, 35%-40% in the next year and only 5%-10% occurs two years out.
Only 25% (for short duration SF and Reno) to 50% (for longer duration MF) residential spending within the year comes from work that was booked in backlog at the beginning of the year. The performance of residential spending in the year is very much dependent on new starts.
The level of activity has a direct impact on inflation. When the activity level is low, contractors are all competing for a smaller amount of work and therefore they may reduce bids. When activity is high, there is a greater opportunity to bid on more work and bids can be higher.
Residential construction saw a slowdown in inflation to only +3.5% in 2015. However, the average inflation for six years from 2013 to 2018 was 5.5%. It peaked at 8% in 2013. Residential construction spending dropped an unexpected 6% in 2019 and after adjusting for inflation that is a 10% decline in construction volume. Typically, large declines in volume are accompanied by declines in inflation. National average residential construction inflation for 2019 is now at 3.8%. 2020 is forecast at 3.75%.
Nonresidential Buildings indices have averaged 4.4% over the last five years and have reached over 5% in the last three years. But spending slowed dramatically in 2019. This forecast indicates spending in most nonresidential buildings markets will gain little in 2019, the slowest rate of growth post-recession. However, new starts in 2018 and 2019 boosted backlog and 2020 spending will post the strongest gains in four years. Strong gains in spending historically has led to accelerated inflation. National average nonresidential buildings construction inflation for 2019 is now at 4.8%. 2020 is forecast at 4.2%.

Construction Statistics – Behind The Headlines
Examples of how commonly reported construction data can often be misused – Construction Spending and Construction Starts
Construction Grew $41 billion, 3.3%, from 2017 to 2018
An increase in construction spending is often referred to as growth for the industry, but that is incorrect. Construction spending measures the change in the dollar value of work performed, not the volume of work performed.

The difference between spending (or revenue) and volume can be explained by a simple example, the Crate of Apples. A farm stand sold a crate of apples last year for $100. Costs have gone up. Today the same size crate of apples sells for $110. Farm stand revenues increased 10%, but the amount of business volume did not increase. Volume of sales is still one crate of apples. All the increase in revenue was inflation.
The $41 billion increase in construction spending from $1.266 trillion in 2017 to $1.307 trillion in 2018 is a 3.3% increase. However, construction inflation for that period averaged 4.7%. Construction inflation adds only cost, not volume, to the amount of work. Construction spending is measured in current dollars, actual dollars spent within the year in the value that year. Construction volume is measured in constant dollars, adjusted for inflation, so any and all years can be compared to each other.
Real construction volume adjusted for inflation actually decreased 1.4% from 2017 to 2018.
Total Construction volume, after accounting for inflation, has been down for five of the last six quarters. Construction volume peaked from Q1 2017 to Q1 2018, is now down 6% from the 2018 peak.

Construction volume is not directly reported. It is not a commonly referenced industry measure reported in the news. But it is a more important indicator of activity in the industry than spending. Volume is found only through analysis of spending and inflation data.
Another common misrepresentation using spending data relates to jobs growth. Jobs growth is often compared to spending growth where a 3% to 4% increase in jobs from year to year is substantiated if we have a similar 3% to 4% growth in spending. However, current $ spending is not yet adjusted for inflation and does not represent growth in real volume of work. Jobs must be compared to volume. Real volume increases are represented by constant $, or construction spending adjusted for inflation.
In the last 2 years jobs have increased by about 8% but real construction volume has decreased by about 6%. In recent years, construction volume has not supported jobs growth.

Construction Starts Predict Changes in Spending
Two very important criteria must be known about new construction starts in order to properly predict spending.
1st – To predict spending from new starts, the starts data must be spread over time using an appropriate cash flow curve. A simple illustrative spending pattern for nonresidential buildings starts, or a typical cash flow curve, for total starts within a year is: 20% of the revenue gets spent in the 1st year, 50% in the 2nd year and 30% in the 3rd year. This shows predicting spending in any given year is dependent on several previous years of starts.

Multi-billion $ highway projects, manufacturing facilities, power projects and transportation terminals often have much longer duration cash flow curves. In other words, if your intent is to predict construction spending in 2019, you need to know what starts were at a minimum in 2017 and 2018, and in many cases back to 2016 or even 2015.
Starts spread over time with cash flow curves predict spending.
2nd – For new construction starts survey sample to be used to compare to itself from year to year to predict growth in spending, sample size must be known. Starts data captures a share of the total market or a portion of all construction, on average about 60% of all construction. The easiest way to see this is compare total construction starts to total spending. Starts from 2016 to 2019 range from $750 billion to $800 billion while spending in those years ranges from $1,200 billion to $1,300 billion. From this we see starts capture a share of the total market. Any time a survey of a total population is used to forecast the total, the survey share of total must be considered. If sample size is not constant, the apparent growth in starts does not all reflect real growth in spending.
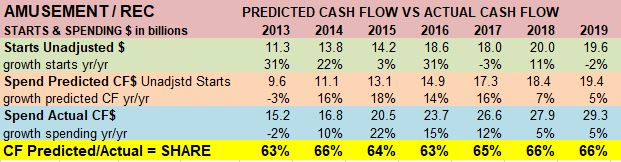
Amusement/Recreation is an example that shows starts that generate a predicted cash flow pretty well balanced with actual spending from year to year. The share of starts in the survey is fairly consistent never varying from 63% to 66% from year to year.
Office provides an example of variation in sample share of total. Starts generate predicted cash flow that increased substantially from 49% to 57% and remained higher compared to actual spending.
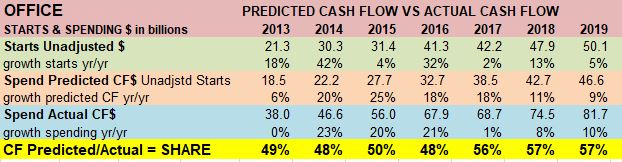
Office starts increased from $21 billion in 2013 to $50 billion in 2019. This data generates the predicted cash flow that is compared to actual spending. To predict total spending from unadjusted starts, unadjusted starts CF$ are factored up (divided by) share of total market. If the share of market captured in the survey remained constant then the predicted spending would remain close to 50%.
CF$ Predicted/Actual shows that Cash Flow Share of actual spending was 48%-50% for several years but then jumped to 56%-57%. The predicted cash flow generated from the increase in starts is not entirely representative of an increase in spending but represents the combined value of the expected increase in spending and an increase in share of market data captured.
Starts cash flow and starts survey share of total spending are never directly known or published. These factors are found only through analysis of the data.
The Educational market data shows a similar situation as Office data. Starts generate predicted cash flow that increased substantially compared to actual spending.
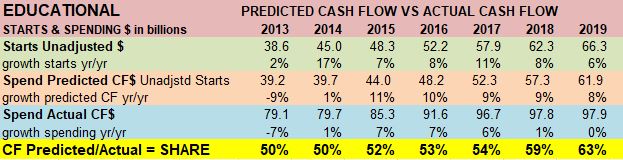
Starts data generate predicted cash flow to forecast spending. This requires tracking share of total market captured in the starts survey data to account for any growth in the market share captured vs growth in predicted spending.

Prelim 2019-2020 Construction Spending
Note 11-8-19 on September spending: Construction Spending in September is up 0.5% from August and still down 2.2% year-to-date (ytd) from 2018. Spending in Q3 averaged the same as Q1. Qtr/Qtr spending this year has ranged +/- 1%. Total 2019 spending will be down 1%. I’m expecting 2019 Nonresidential Buildings spending up less than 1%, Non-building Infrastructure up 7% and Residential spending down 6%.
10-3-19
Construction Spending in August is down slightly from July and down 2.3% year-to-date (ytd) from 2018. Spending for the last three months has remained flat. Qtr/Qtr spending has ranged +/- 2% for the last five quarters. Total 2019 spending will be down 0.5%. I’m expecting 2019 Nonresidential Buildings spending up 1%, Non-building Infrastructure up 8% and Residential spending down 6%.
Residential construction spending, down for six consecutive quarters, is now down 11% from Q1 2018. Residential volume (spending minus inflation), also down for six quarters, is down 16% from the Q1 2018 peak.
Some markets spending totals for 2019: Lodging +11%, Office +10%, Amusement and Healthcare both +5%, Commercial/Retail -14%, Highway +11%, Power +7%, Transportation +6%, Environmental Public Works (combined) +12%.
2020 forecast Starting Backlog for Nonresidential Buildings is currently up 6% and for Non-building Infrastructure is up 9%. Strong backlog leading into 2020 will increase spending in most nonresidential markets. Exceptions are: Commercial/Retail and Power backlog will decline. Residential spending is 65% dependent on new starts but Nonresidential spending is 80% dependent on backlog.
Forecast growth for 2020 is welcome since real construction volume, after accounting for 4% to 5% inflation, has been down for five of the last six quarters. Annual construction inflation since 2011 has been as high as 5.8%. For the last 3 yrs it has averaged 4.6%/yr. Construction spending for the last 3 years avg. annual growth is only 2.4%. When construction spending is lower than inflation, real volume is declining. Jobs must be compared to volume.
Total construction volume after inflation (quarterly avg) reached a peak in the 1st quarter of 2017 (which was then matched again in Q1 2018) and is now down 6% from the peak. Most of the volume decline was in Residential. Only Infrastructure has seen volume gains in the last two years. We have seen jobs growth slow in the last year, but the disparity between construction volume and jobs growth is the greatest ever. I expect to see a much more significant slow down in jobs growth.
Backlog growth over the past two years will provide the base for Nonresidential construction spending increases in 2020. Major backlog increases from 2018 to the start of 2020 are: Educational +12%, Office +25%, Commercial/Retail -14%, Highway +16%, Transportation +45% and Environmental +23%.
The forecast for 2020 spending is total $ up 3%, but Residential spending will be flat to down slightly.
Construction Spending Forecast strength over the next 18 months is all nonresidential. Current spending seasonally adjusted annual rate (SAAR) vs SAAR at the end 2020 shows Nonresidential Buildings now at $450bil will end 2020 at $500bil and Non-building Infrastructure, now at $340 billion, will end 2020 at $375bil. Residential is now at $510bil but will move up slightly then down to finish 2020 at $500bil.
SEE ALSO:
Spending Revisions 9-3-19. Nonresidential Increases. Residential Slows.
Midyear 2019 Construction Spending Forecasts Compared

Construction Starts Cash Flow vs Spending
This plot overlays two data sources, starts cash flow and spending. For each of the three major market sectors, Residential, Nonresidential Buildings and Non-building Infrastructure, a light colored line and a dark line are plotted. The light line is the expected direction spending will move estimated from the monthly cash flows from Dodge Data construction starts data. The dark line is the movement in actual spending. All the nonresidential buildings and infrastructure data is the sum of all the markets within the sectors. This plot is not generated for each market.
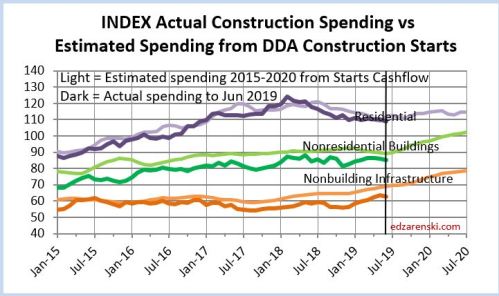
The actual spending should follow a pattern that is similar to the direction of movement predicted by the estimated spending. If the patterns are similar, it is an indication that the forecasting tools are generally accurate. The thing to watch for is that the direction of movement was predicted accurately. For instance, the Non-building Infrastructure lines show pretty well from Jan 2017 through June 2019 that the starts data estimated the direction spending would move. To a lesser degree, Nonresidential Buildings shows correlation. Residential spending long term agrees with the estimate from starts cash flows, but spending is much more smoothed and actual spending inflection points seem to lag the estimated.
Reliability of Predicted Construction Forecast Data is always foremost in the thoughts of an analyst. Cash flow models provide for approximately 75% to 80% actual jobs data in the predicted spending for the forecast 12 months out. For next month’s forecast we have 96%-97% actual jobs data in the forecast, only missing jobs that start within the next 30 days. Reliability trails off each month. So, this is useful as a way to check the forecasting model. Essentially, this provides a check on the method I use for forecasting spending. It lends credence to the validity of the future forecast.
The forecast monthly changes in cash flow generated by the starts data are used to predict future spending in all Construction Analytics spending forecasts.
(note 10-3-19: major revisions to starts data cash flow substantially reduces forecast spending in both 2019 and 2020. These revisions won’t be posted until November. Largest downward revisions 2019, Residential -15, Highway -10. Largest downward revisions 2020 Residential -23, Manufacturing -10, Power -12, Highway -12)
11-25-19 table updated

Midyear 2019 Construction Spending Forecasts Compared
8-1-19 edited Nov 2019
Construction Analytics compares midyear construction spending forecast to other industry resources
(note 10-3-19: major revisions to starts data cash flow substantially reduces forecast spending in both 2019 and 2020. These revisions won’t be posted until November. Largest downward revisions 2019, Residential -15, Highway -10. Largest downward revisions 2020 Residential -23, Manufacturing -10, Power -12, Highway -12)
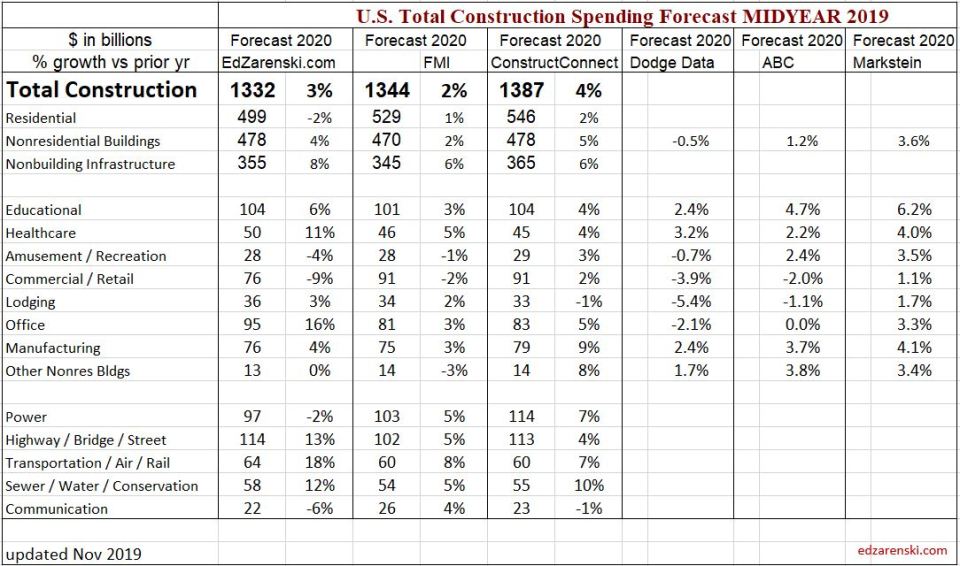
The following comparison data is compiled from data published in several other reports, by FMI 2nd Qtr 2019 Construction Outlook, ConstructConnect Summer 2019 PIP Construction Forecast and AIA July 2019 Midyear Consensus Forecast. Data is all midyear forecast for 2019 and look ahead to 2020.
There are some significant differences in the forecasts, especially in the Non-building Infrastructure forecasts, but also in the Nonresidential buildings 2020 Forecast. I am substantially higher than my peers. Only time will tell who has the closest forecast.
All EdZarenski.com (Construction Analytics) forecasts are based on predicted cash flow from modeling Dodge Data construction starts and include ytd data through June. All other reports were published prior to Aug 1st so would not include the June spending.
How can we assess if forecasts are on track to finish as predicted? Well, for the 2019 forecast, as of August 1, we have actual spending and starts data through June.
Spending year-to-date (ytd) gives some clues:
- Amusement/Rec is up ytd 8.8%
- Commercial is down ytd 8.6%
- Lodging is up ytd 8.2%
- Highway Bridge is up ytd 14.6%
- Sewer/Water/Conserv is up ytd 16.2%
- Communication is down ytd 7.4%
For the remainder of 2019 and 2020 forecast, we can look at new starts and backlog.
Construction Starts YTD total as of June is down 8% from 2018. That’s expected to improve by year end.
Residential construction starts peaked in 2018. Starts have been sideways or in light decline since mid-2018. Year-to-date June 2019 starts are down 9% from 2018. Avg SAAR for 1st 6mo 2019 is $315bil, same 6mo last year was $340bil. Starting backlog is down 5% from 2017 to 2019. Spending is forecast down 6% in 2019, down 2% in 2020 and near 0% in 2021.
Nonresidential Buildings starting backlog increased 10%/year for the 4 years 2017-2020. Nonresidential buildings spending is forecast up 0.5% in 2019, up 4% in 2020 and up less than 1% in 2021.
Infrastructure starting backlog has increased 15%/year for the 3 years 2018-2020. Non-building infrastructure spending is forecast up 7% in 2019, up 8% in 2020 and 8% in 2021.
Table updated to Nov where data available

For the 2020 forecast, we can take a look at new starts and backlog.
These markets recently posted the best construction starts 12 month totals ever over the noted period. Much of the spending from these starts occurs in 2020.
- Manufacturing from Jun18>May19, up 36% in two years
- Office May18>Apr19, up 8%/yr for the last 4 years
- Educational Jun18>May19, monthly rate for 12 of last 16 months increased by 20%.
- Public Works May18>Apr19, increased 30% in the last 24 months.
Manufacturing new starts jumped substantially in 2018 and so far in 2019 have remained higher. Growth in Manufacturing starts jumped 36% in two years. Office starts have increased on average 8%/yr for the last 4 years. Educational starts monthly rate for 12 of the last 16 months increased by 20%. Public Works starts combined (sewer, water supply, conservation) began to increase in 2017, then took off in 2018-2019 increasing 30% in the last 24 months.
These very long duration markets posted best new starts ever.
- Highway Dec 17>Nov18, up 25% compared to prior 12 months, which was the 2nd best 12mo ever, with peak spending from those starts expected in 2020.
- Transportation (2yrs) Jan17>Dec18, up 25% from the prior 2 years, but with the peak 12 months up 35% from the prior 2 years, with peak spending 2020.
Backlog starting 2020 for these six markets is up an average of 25%, at the highest starting backlog ever for each of the six markets. Also, these six markets account for 1/3rd of all construction spending.
Growth in new starts and backlog for the last three years (2017-2018-2019):
- Manufacturing starts up 44%, backlog up 62%
- Office starts up 30%, backlog up 62%
- Highway starts up 45%, backlog up 70%;
- Transportation starts up 64%, backlog up 138%;
- Public Works new starts up 45%, backlog up 72%.
In the last two years, Commercial/Retail market starts are down 18% and 2020 starting backlog will be down 11%. The only other declines in 2020 starting backlog are Amusement/Recreation (-1%) and Power (-5%).
So, we are starting 2020 with the highest backlog on record after several years of elevated starts. However residential work is already down slightly while non-building infrastructure work is super-elevated.
Table updated to Nov where data available
The baseline forecast produces spending increases of only 3% in 2021-2022, so is not aggressive in predicting future starts. Here’s some drivers of starts:
Educational 2019 spending is supported by a steady stream of strong starts that began in late 2017 and extended into summer 2018. Jun-Jul-Aug 2018 starts posted the best 3mo total starts ever and peak spending from those starts occurs from April 2019 to Jan 2020. Most spending in 2020 comes from projects that start in the 1st half of 2019. So far in 2019 starts are up 15% ytd over 2018.
Commercial Both store and warehouse starts dropped in 2018. Commercial starts are seeing strong gains from distribution centers (warehouses, which are in commercial spending). Since 2015 the 10% decline in retail stores is being hidden by the 50% increase in warehouses, which are at an all-time high. Stores are down 10% from the peak in 2016. Warehouses are down 5% in 2018 but increased 500% from 2010 to 2017.
Manufacturing Backlog is still very strong, but a drop in peak spending from the schedule of cash flows will lead to a period of moderate spending declines. After that, manufacturing spending increases steadily through the end of 2020. Current expectations are that manufacturing will finish the year up 8%. 2020 will be an extremely strong growth year, spending potentially increasing 20%+.
(note 11-8-19: major revisions to Manufacturing starts data substantially reduces forecast spending in 2020 and 2021. Dodge Data, in their October Outlook 2020 report, reduced forecast for Manufacturing new starts from their June Midyear report by -$10bil (30%) for 2019 and by -$7bil (25%) for 2020. This reduces 2020 spending growth to only 4%.
Office spending is expected to finish 2019 up 7% or less. New starts in 2018 were up 11% to a new high, but much of the peak spending, from over-sized long-duration projects, will benefit 2020 when I expect to see spending growth of 8%-11%.
Transportation starts have two main parts, Terminals and Rail. Some analysts include transportation in nonresidential buildings. That does not consider the following: airports include not only land-side terminals but also air-side runway work; rail includes platforms and all railway right of way work, which includes massive civil engineering structures. About half of all transportation spending is rail work. Construction Analytics follows U S Census construction spending reports which include all terminals and rail in Transportation.
Terminals and rail starts reached record highs in 2017 and record backlog in 2019. 2019 starting backlog is four times what it was in 2015.
However, much of that backlog is very long duration project spending that will occur in future years. Some of the project starts in 2016 and 2017 have an eight-year duration. From Oct’16 through Oct’18 there were sixteen $billion+ new project starts and seven $500million+ new starts. Some projects started in this period have peak spending occurring in 2020 and 2021.
Highway/Street/Bridge starts hit an all-time high in 2018. Current 2019 progress shows new starts leveling off. Starting backlog increased 70% in the last 3 years leading into 2020. A lot of this is long duration backlog that will provide for large increases in spending in from 2019 to 2021.
Environmental Public Works (Sewage, Water supply and Conservation) new starts all declined from 2014 through 2017. Then all showed 14% gains in 2018 and the forecast is +15% in new starts in 2019.
May 2019 Construction Spending Report -Changes Since Dec Forecast for 2019
7-1-19
May construction spending was posted by U.S. Census today at an annual rate of $1.294 trillion. Construction spending has averaged $1.296 trillion for the 1st five months of 2019. Year-to-date (ytd) spending is down 0.2% from the 1st five months of 2018.
Residential spending is down 8% ytd from 2019. Two thirds of that decline is in renovations which is down 15%. Single family (SF) is down 8% but multifamily (MF) is up 9%. SF is 51% of all residential spending, MF is 15%, Reno is 34%.
Nonresidential buildings spending is up 3% ytd. Best performers ytd in nonres bldgs are Manufacturing +11%; Office +9%; Amusement/Recreation +9% and Lodging +8%; (Public Safety is up +10% ytd, but represents less than 1% of nonres bldgs, so has little impact). Commercial is down -8%.
Non-building infrastructure is up 7% ytd. Best performers ytd in nonbldg infra are Highway +18%; Environmental Public Works (combined) +16%; Transportation +9%. Communication is down -7%.
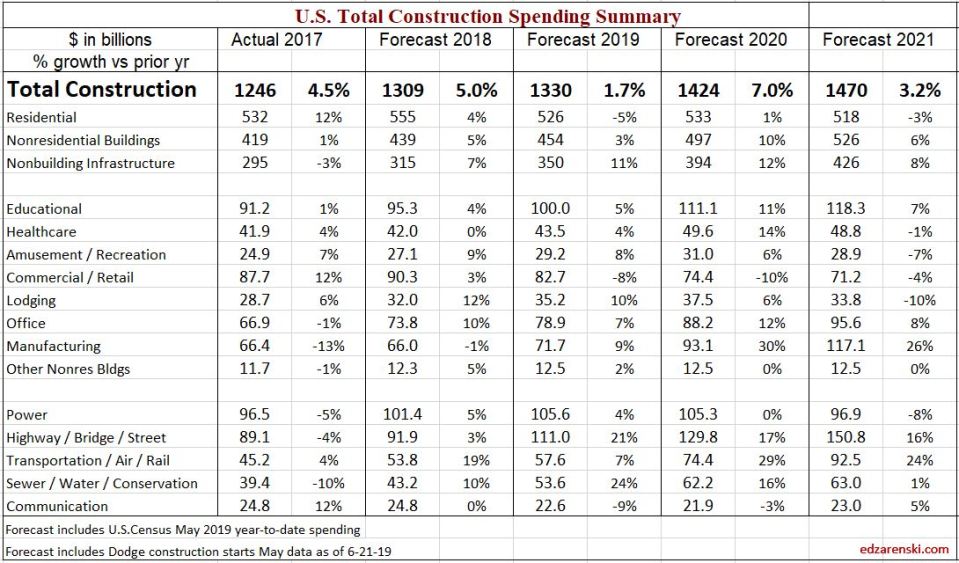
Construction Analytics 2019 forecast for total construction spending for 2019 is now $1.330 trillion compared to $1.341 trillion forecast in December. The changes in the forecast by sector since December are: residential spending was forecast to reach $564 billion but is now projected to hit only $526 billion. Nonresidential buildings spending is now forecast to reach $454 billion, up $10 billion since December supported by increases in Educational and Manufacturing. Non-building Infrastructure spending is forecast to finish at $350 billion up $16 billion since the initial forecast. Most of the infrastructure increase is in Highway.
Current forecast shows all three sectors improving by year end. Forecast spending for 2019 shows residential finishing down 5%, nonres bldgs up 4% and nonbldg infrastructure up 13%.
Inflation is expected between 4% and 5% in 2019. Volume is spending minus inflation. After adjusting for inflation, residential volume is expected to finish 2019 down 9%, nonres bldgs down 1% but nonbldg infrastructure up 8%.
This is the third year in which construction volume will post no significant gain. Spending in 2017 was up 4.5% and in 2018 up 5%, but after inflation, volume was up only 0.1% in 2017 and 0.2% in 2018. Overall, total 2019 spending will finish up 1.7%, but volume after inflation will be down 2.7%.
While volume is now in the third year of no gains, jobs have increased, so far since Jan 2017 by 8%. This does not support the ongoing discussions of a labor shortage. In fact, jobs growth is exceeding construction volume.
Biggest upward revisions to my forecast since December: Educational from -4% to +5%, +$7bil; Manufacturing from -2% to +9%, +$7bil; Highway from +1% to +21%, +$18bil; Environmental Public Works from +7% to +24%, +$7bil.
Biggest downward revisions to my forecast since December: Residential from +0.5% to -5%, -$38bil; Commercial from -1% to -8%, -$8bil; Transportation from +14% to +7%, -$5bil.
See also Notes on April 2019 Construction Spending Report which includes greater explanation of major market activity.
Bullet Points for May
Construction is cyclical in periods, not so much month over month. The 1st 5 months 2019 averaged slightly higher than the last 6 months of 2018.
Residential construction is the biggest drag on total spending right now. The current 3mo average spending is the lowest in 27 months. That will improve some over the next 12 months, but then, if the forecast for new construction starts does not improve, will head even lower for 2020.
All sectors will improve in the 2nd half of 2019 vs 1st half. Residential +3%, Nonresidential buildings +3%, Non-building Infrastructure +9%. These improvements are only enough to bring total 2019 spending to +2.3% over 2018.
Nonresidential new construction starts through 2018 are at all-time highs and are expected to set new highs again in 2019.
Although ytd spending is down 0.2% from the 1st five months of 2018, by year end ytd will climb to 2.3%. The 2nd half of 2018 was in decline while the 2nd half of 2019 is on the rise.
Non-building Infrastructure spending is the strongest it has been in many years. Indications are for a steady increase in spending completely through 2020. Highway, Transportation and Public Works are all contributing to increases.
Growth in new starts and backlog last three years: Highway starts up 33%, backlog up 42%; Transportation (since 2015) starts up 60%, backlog up 100%; Public Works new starts up 38%, backlog up 33%. Backlog growth for these three markets all expected to increase ~25% for start of 2020.
Growth in annual spending in data going back to 2001: Highway spending for 2019-2021 best 3 yrs ever; Transportation 2018-2021 best 4 yrs ever; Public Works 2019-2020 best 2 yrs ever.
For nonresidential buildings, almost 80% of all spending in any given year is already in backlog from starts prior to that year. For non-building infrastructure it’s 85%. So come Jan. 1 2020, 80% to 85% of all nonresidential spending in 2020 is already on record in backlog. For residential it’s only 30% due to shorter duration and the dependence on more starts within the year.
Inflation has been increasing 4% to 5% per year since 2012. Construction spending needs to increase greater than inflation to add volume within the year. Total construction volume has not increased in over two years and will drop 2% in 2019.
Jobs are increasing while volume is decreasing. That’s like a factory putting on more workers to make fewer widgets.
I wouldn’t be surprised to see, within the next few jobs reports, a slowdown in total construction jobs growth but a pick up in heavy engineering jobs. If the last 5 months are an indicator, the decline may have already begun. We’ve just posted the lowest 5 months jobs growth (52k jobs) in the last 7 years.
For more on Jobs see Construction Jobs and JOLTS
My forecast output is dependent on all monthly cash flows from scheduled new construction starts. I rely on Dodge Data & Analytics for starts data.
This forecast does not predict a recession, however does reduce growth in new starts over the next three years. If a recession were to occur, it would substantially reduce future starts. However, the last “construction” recession started in 2006-2007 with declines in residential work. New starts in nonresidential buildings kept increasing into 2008. The “nonresidential” spending recession did not start until 2009, three years after the beginning of the residential decline.
Caution Reading the Recent 2018 Construction Spending $
3-19-19
Construction Spending for Jan was just released March 13th at $1.287 trillion saar, up 1.3% from Dec. But…
the most notable numbers in this March report are BIG REVISIONS DOWNWARD TO NOV (-2.3%) AND DEC (-2.2%), particularly to residential.
Residential revisions Nov -3.9%, Dec -4.4%.
Nonresidential revised down -0.8% in both Nov & Dec.
2018 total spending currently at $1.293 trillion, 2% below expected.
If these residential reports are correct, we have been in a residential construction spending downturn, now down 12% since last May. I predict these numbers are suspect.
Current total residential spending for 2018 in this most recent report is $545 billion, up 2.6% from 2017. But after deducting 4.4% residential inflation, that means real residential construction volume would be DOWN -1.8% for 2018. Yet, new starts in 2018 were up 6% and new residential jobs increased 3.5%.
However, in 2018 residential spending, the monthly variances from statistical rates of spending look very similar to 2006, up thru May then down 15% to year end.
Cash flow models of construction starts data from Dodge Data for residential spending spread over time indicate residential spending should be UP 3% since May, not down!
Just a reminder, we had a huge upward revision to 2015 residential spending data in July 2016. The 2018 data gets a big revision on July 1, 2019.
The monthly spending data gets revised three times after the 1st release. In the mean time, it can be compared to the statistical averages to determine if 1st reports, or even 2nd reports of spending are in line with expectations. The current Nov and Dec residential construction spending data varies from the statistical average by 3 to 4 standard deviations. That’s highly unusual!
To understand just how unusual that is, let’s compare to how rare any monthly spending varies by 2 standard deviations (StdDev) from the statistical monthly average:
Non-Builiding Infrastructure has varied by 2 StdDev only 5 times in 18 years, only once in the last 15 years, even including recessionary years.
Excluding recessionary years, Nonresidential Buildings varied by more than 2 StdDev only 12 times in 16 years and only 4 times in the last 8 years.
In both those data sets above, only twice ever in over 400 total months of data was the variance greater than 2.5 StdDev.
Excluding recessionary years, Residential Building monthly spending exceeded 2 StdDev from the average only 10 times in 14 years, all 10 times were in the last 8 years.
Recessionary years really skew the data. Non-building Infrastructure was the only sector not affected by the recession like all other construction. Residential spending was affected the most. In the four residential recessionary years, 2006-2009, residential monthly spending (in 48 months) exceeded 2 StdDev 28 times, 19 of those times 3 StdDev or greater.
In the residential data set, 5 of the 10 non-recessionary variances over 2 StdDev were in 2018. That simply does not occur in the historical data. That’s like having your teenage son grow an inch every year from 13 to 16 but then shrinking 2 inches in year 17. The average of those 5 unusual months in 2018 was 3.5 StdDev from the statistical average, with Nov and Dec posting the greatest variances since 2009.
The only time we’ve ever seen data like that was within the recession years of 2006-2009. So, either the 2018 residential data is foretelling the beginning of another recession, or the data, particularly the Nov and Dec data, will be subject to significant revisions, in this case upward.
Starts and cash flow expectations seem to indicate the 2018 data is currently being reported too low. I expect 2018 residential data will be revised up by $10bil to $15bil. We may not have that information until July 1, 2019.

