8-1-19 edited Nov 2019
Construction Analytics compares midyear construction spending forecast to other industry resources
(note 10-3-19: major revisions to starts data cash flow substantially reduces forecast spending in both 2019 and 2020. These revisions won’t be posted until November. Largest downward revisions 2019, Residential -15, Highway -10. Largest downward revisions 2020 Residential -23, Manufacturing -10, Power -12, Highway -12)
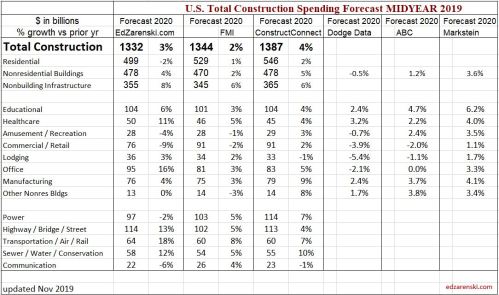
The following comparison data is compiled from data published in several other reports, by FMI 2nd Qtr 2019 Construction Outlook, ConstructConnect Summer 2019 PIP Construction Forecast and AIA July 2019 Midyear Consensus Forecast. Data is all midyear forecast for 2019 and look ahead to 2020.
There are some significant differences in the forecasts, especially in the Non-building Infrastructure forecasts, but also in the Nonresidential buildings 2020 Forecast. I am substantially higher than my peers. Only time will tell who has the closest forecast.
All EdZarenski.com (Construction Analytics) forecasts are based on predicted cash flow from modeling Dodge Data construction starts and include ytd data through June. All other reports were published prior to Aug 1st so would not include the June spending.
How can we assess if forecasts are on track to finish as predicted? Well, for the 2019 forecast, as of August 1, we have actual spending and starts data through June.
Spending year-to-date (ytd) gives some clues:
- Amusement/Rec is up ytd 8.8%
- Commercial is down ytd 8.6%
- Lodging is up ytd 8.2%
- Highway Bridge is up ytd 14.6%
- Sewer/Water/Conserv is up ytd 16.2%
- Communication is down ytd 7.4%
For the remainder of 2019 and 2020 forecast, we can look at new starts and backlog.
Construction Starts YTD total as of June is down 8% from 2018. That’s expected to improve by year end.
Residential construction starts peaked in 2018. Starts have been sideways or in light decline since mid-2018. Year-to-date June 2019 starts are down 9% from 2018. Avg SAAR for 1st 6mo 2019 is $315bil, same 6mo last year was $340bil. Starting backlog is down 5% from 2017 to 2019. Spending is forecast down 6% in 2019, down 2% in 2020 and near 0% in 2021.
Nonresidential Buildings starting backlog increased 10%/year for the 4 years 2017-2020. Nonresidential buildings spending is forecast up 0.5% in 2019, up 4% in 2020 and up less than 1% in 2021.
Infrastructure starting backlog has increased 15%/year for the 3 years 2018-2020. Non-building infrastructure spending is forecast up 7% in 2019, up 8% in 2020 and 8% in 2021.
Table updated to Nov where data available

For the 2020 forecast, we can take a look at new starts and backlog.
These markets recently posted the best construction starts 12 month totals ever over the noted period. Much of the spending from these starts occurs in 2020.
- Manufacturing from Jun18>May19, up 36% in two years
- Office May18>Apr19, up 8%/yr for the last 4 years
- Educational Jun18>May19, monthly rate for 12 of last 16 months increased by 20%.
- Public Works May18>Apr19, increased 30% in the last 24 months.
Manufacturing new starts jumped substantially in 2018 and so far in 2019 have remained higher. Growth in Manufacturing starts jumped 36% in two years. Office starts have increased on average 8%/yr for the last 4 years. Educational starts monthly rate for 12 of the last 16 months increased by 20%. Public Works starts combined (sewer, water supply, conservation) began to increase in 2017, then took off in 2018-2019 increasing 30% in the last 24 months.
These very long duration markets posted best new starts ever.
- Highway Dec 17>Nov18, up 25% compared to prior 12 months, which was the 2nd best 12mo ever, with peak spending from those starts expected in 2020.
- Transportation (2yrs) Jan17>Dec18, up 25% from the prior 2 years, but with the peak 12 months up 35% from the prior 2 years, with peak spending 2020.
Backlog starting 2020 for these six markets is up an average of 25%, at the highest starting backlog ever for each of the six markets. Also, these six markets account for 1/3rd of all construction spending.
Growth in new starts and backlog for the last three years (2017-2018-2019):
- Manufacturing starts up 44%, backlog up 62%
- Office starts up 30%, backlog up 62%
- Highway starts up 45%, backlog up 70%;
- Transportation starts up 64%, backlog up 138%;
- Public Works new starts up 45%, backlog up 72%.
In the last two years, Commercial/Retail market starts are down 18% and 2020 starting backlog will be down 11%. The only other declines in 2020 starting backlog are Amusement/Recreation (-1%) and Power (-5%).
So, we are starting 2020 with the highest backlog on record after several years of elevated starts. However residential work is already down slightly while non-building infrastructure work is super-elevated.
Table updated to Nov where data available
The baseline forecast produces spending increases of only 3% in 2021-2022, so is not aggressive in predicting future starts. Here’s some drivers of starts:
Educational 2019 spending is supported by a steady stream of strong starts that began in late 2017 and extended into summer 2018. Jun-Jul-Aug 2018 starts posted the best 3mo total starts ever and peak spending from those starts occurs from April 2019 to Jan 2020. Most spending in 2020 comes from projects that start in the 1st half of 2019. So far in 2019 starts are up 15% ytd over 2018.
Commercial Both store and warehouse starts dropped in 2018. Commercial starts are seeing strong gains from distribution centers (warehouses, which are in commercial spending). Since 2015 the 10% decline in retail stores is being hidden by the 50% increase in warehouses, which are at an all-time high. Stores are down 10% from the peak in 2016. Warehouses are down 5% in 2018 but increased 500% from 2010 to 2017.
Manufacturing Backlog is still very strong, but a drop in peak spending from the schedule of cash flows will lead to a period of moderate spending declines. After that, manufacturing spending increases steadily through the end of 2020. Current expectations are that manufacturing will finish the year up 8%. 2020 will be an extremely strong growth year, spending potentially increasing 20%+.
(note 11-8-19: major revisions to Manufacturing starts data substantially reduces forecast spending in 2020 and 2021. Dodge Data, in their October Outlook 2020 report, reduced forecast for Manufacturing new starts from their June Midyear report by -$10bil (30%) for 2019 and by -$7bil (25%) for 2020. This reduces 2020 spending growth to only 4%.
Office spending is expected to finish 2019 up 7% or less. New starts in 2018 were up 11% to a new high, but much of the peak spending, from over-sized long-duration projects, will benefit 2020 when I expect to see spending growth of 8%-11%.
Transportation starts have two main parts, Terminals and Rail. Some analysts include transportation in nonresidential buildings. That does not consider the following: airports include not only land-side terminals but also air-side runway work; rail includes platforms and all railway right of way work, which includes massive civil engineering structures. About half of all transportation spending is rail work. Construction Analytics follows U S Census construction spending reports which include all terminals and rail in Transportation.
Terminals and rail starts reached record highs in 2017 and record backlog in 2019. 2019 starting backlog is four times what it was in 2015.
However, much of that backlog is very long duration project spending that will occur in future years. Some of the project starts in 2016 and 2017 have an eight-year duration. From Oct’16 through Oct’18 there were sixteen $billion+ new project starts and seven $500million+ new starts. Some projects started in this period have peak spending occurring in 2020 and 2021.
Highway/Street/Bridge starts hit an all-time high in 2018. Current 2019 progress shows new starts leveling off. Starting backlog increased 70% in the last 3 years leading into 2020. A lot of this is long duration backlog that will provide for large increases in spending in from 2019 to 2021.
Environmental Public Works (Sewage, Water supply and Conservation) new starts all declined from 2014 through 2017. Then all showed 14% gains in 2018 and the forecast is +15% in new starts in 2019.
