The path from construction starts to spending is not direct and not quite as simple as you might think. Spending is the market activity measure that drives all construction economics, so that’s where we need to get too. With an appropriate modeling technique we can get from new starts to predicted spending in a few steps.
New Construction Starts (construction starts referred to here is Dodge Data & Analytics New Construction Starts) is excellent data for forecasting. The following forecast is entirely developed from starts data. No actual spending is incorporated into this forecast. The purpose is to show that using the data properly can produce an accurate forecast.
The starts data is a survey. As in any survey, starts represents a portion of new construction activity. Study shows the survey size varies with each market from about 40% to 70% of actual. Starts data captures a share of the total market or a portion of all construction, on average about 60% of all construction.
The easiest way to understand this is to compare total annual construction starts to total annual spending. National construction starts from 2016 to 2019 range from $750 billion/year to $800 billion/year, while spending in this period ranges from $1,200 billion/year to $1,300 billion/year. From this we see starts data captures a share of about 60% of the total construction market.
The total starts survey averages about 60% of the actual market. In this analysis every market is adjusted by its own individual market share factor. The adjusted starts represent the full amount of starts that would generate the full amount of spending.
To predict spending activity from new construction starts, the starts data must be spread over time using appropriate cash flow curves. On average about 20% of new construction starts gets spent within the year started, 50% is spent in the next year and 30% is spent in years three and four. The cash flow curves used in this model are specific to each market type and can vary from the average.
Applying a market survey factor to develop full magnitude of spending and an expected duration for all starts, depending on market type, to produce a forecast cash flow from starts data, the predicted pattern of spending is developed. The factors have been shown to produce a reliable prediction of total future market activity.
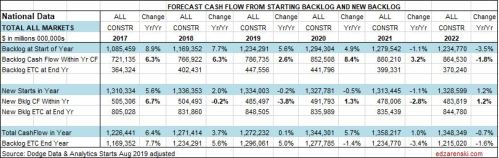
Backlog at the beginning of the year or new starts within the year does not give an indication of spending within the year. New starts within the year could contribute spending spread out over several years. Total cash flow in the year, or spending, could include cash flow from projects that started or entered backlog years ago.
Backlog increases if new starts during the year is greater than spending during the year. However, an increase in backlog does not necessarily indicate there will be an increase in market activity. An increase in backlog could represent a level rate of market activity, but for a longer duration.
Cash flow provides the best indicator of how much and when spending will occur. Cash flow from all previous starts gives a prediction of how spending will change monthly from all projects in backlog. Cash flow totals of all jobs can vary considerably from month to month, are not only driven by new jobs starting but also old jobs ending, and are heavily dependent on the type, size and duration of jobs.
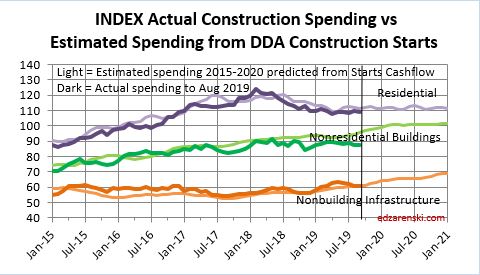
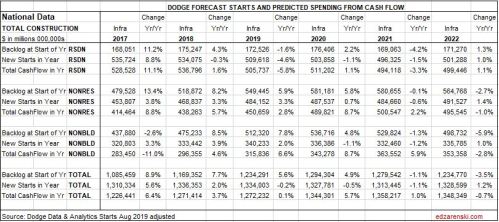
Total of all national construction starts increased every year since 2008. New starts slowed to +2% in 2018 and are forecast at a potential decline of 0.2% in 2019. Backlog is still up leading into 2020 but after that starts and backlog are forecast to remain flat or decline over the next few years. Total spending declines in 2022. However, as the next tables will show, work distribution is uneven with residential declining and nonresidential up.
Nonresidential Buildings starts (excluding Terminals) reached a new high every year since 2009. The last three years starts are up 3% to 4% per year. Every market posted increases in 2017 and 2018. Only Commercial/Retail declined in 2019. The largest increases over the last two years were Educational and Office Buildings. Spending is still strong in 2020 but then with the slowdown in starts forecast in 2020, backlog growth stalls and spending slows in 2021-2022.
75%-80% of all Nonresidential Buildings spending within the year will be generated from projects that were booked in starting backlog at the beginning of the year.

Nonbuilding Infrastructure markets total spending amounts to only about 70% of nonresidential buildings markets. The largest infrastructure markets are Highway/Bridge and Power but the largest increases in new starts recently are in Transportation (including all terminals) and Environmental Public Works. Transportation starts are up 25% in the last last three years and backlog to start 2020 is up 80%. Public Works starts are up 22% and backlog is up 30%
Nonbuilding Infrastructure starts can be erratic with a long pattern of up then down years. Starts (including Terminals) gained only 2% in 2019 but that is only low because Power, the largest market overall saw starts decline by 7%. Total infrastructure starts are at an all-time high.
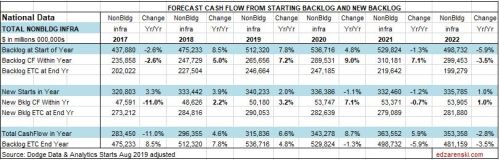
Infrastructure backlog peaks in 2020 and remains high into 2021. Spending increases are in the 6% to 8% range at least for the next two years. Infrastructure projects typically have the longest duration. Projects contribute spending sometimes up to 5 or 6 years. The largest spending increases in 2020 are in Transportation and Highway projects.
The Residential table shows that most of the spending in any year is cash flow from new starts. For short duration residential spending, single-family residential and renovations work, approximately 75% of the spending occurs in the year of the starts and 20% in the following year.

For long duration residential spending, typical of multifamily residential, approximately 50%-55% of the spending occurs in the year of the start, 35%-40% in the next year and only 5%-10% occurs two years out.
Only 25% (for short duration SF and Reno) to 50% (for longer duration MF) residential spending within the year comes from work that was booked in backlog at the beginning of the year. The performance of residential spending in the year is very much dependent on new starts.
The level of activity has a direct impact on inflation. When the activity level is low, contractors are all competing for a smaller amount of work and therefore they may reduce bids. When activity is high, there is a greater opportunity to bid on more work and bids can be higher.
Residential construction saw a slowdown in inflation to only +3.5% in 2015. However, the average inflation for six years from 2013 to 2018 was 5.5%. It peaked at 8% in 2013. Residential construction spending dropped an unexpected 6% in 2019 and after adjusting for inflation that is a 10% decline in construction volume. Typically, large declines in volume are accompanied by declines in inflation. National average residential construction inflation for 2019 is now at 3.8%. 2020 is forecast at 3.75%.
Nonresidential Buildings indices have averaged 4.4% over the last five years and have reached over 5% in the last three years. But spending slowed dramatically in 2019. This forecast indicates spending in most nonresidential buildings markets will gain little in 2019, the slowest rate of growth post-recession. However, new starts in 2018 and 2019 boosted backlog and 2020 spending will post the strongest gains in four years. Strong gains in spending historically has led to accelerated inflation. National average nonresidential buildings construction inflation for 2019 is now at 4.8%. 2020 is forecast at 4.2%.
