7-1-19
May construction spending was posted by U.S. Census today at an annual rate of $1.294 trillion. Construction spending has averaged $1.296 trillion for the 1st five months of 2019. Year-to-date (ytd) spending is down 0.2% from the 1st five months of 2018.
Residential spending is down 8% ytd from 2019. Two thirds of that decline is in renovations which is down 15%. Single family (SF) is down 8% but multifamily (MF) is up 9%. SF is 51% of all residential spending, MF is 15%, Reno is 34%.
Nonresidential buildings spending is up 3% ytd. Best performers ytd in nonres bldgs are Manufacturing +11%; Office +9%; Amusement/Recreation +9% and Lodging +8%; (Public Safety is up +10% ytd, but represents less than 1% of nonres bldgs, so has little impact). Commercial is down -8%.
Non-building infrastructure is up 7% ytd. Best performers ytd in nonbldg infra are Highway +18%; Environmental Public Works (combined) +16%; Transportation +9%. Communication is down -7%.
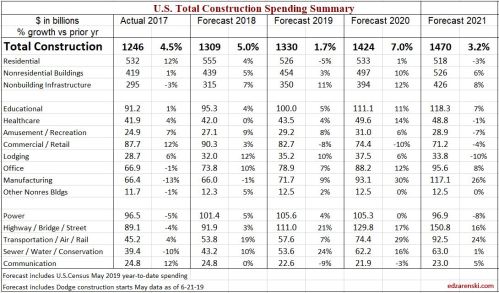
Construction Analytics 2019 forecast for total construction spending for 2019 is now $1.330 trillion compared to $1.341 trillion forecast in December. The changes in the forecast by sector since December are: residential spending was forecast to reach $564 billion but is now projected to hit only $526 billion. Nonresidential buildings spending is now forecast to reach $454 billion, up $10 billion since December supported by increases in Educational and Manufacturing. Non-building Infrastructure spending is forecast to finish at $350 billion up $16 billion since the initial forecast. Most of the infrastructure increase is in Highway.
Current forecast shows all three sectors improving by year end. Forecast spending for 2019 shows residential finishing down 5%, nonres bldgs up 4% and nonbldg infrastructure up 13%.
Inflation is expected between 4% and 5% in 2019. Volume is spending minus inflation. After adjusting for inflation, residential volume is expected to finish 2019 down 9%, nonres bldgs down 1% but nonbldg infrastructure up 8%.
This is the third year in which construction volume will post no significant gain. Spending in 2017 was up 4.5% and in 2018 up 5%, but after inflation, volume was up only 0.1% in 2017 and 0.2% in 2018. Overall, total 2019 spending will finish up 1.7%, but volume after inflation will be down 2.7%.
While volume is now in the third year of no gains, jobs have increased, so far since Jan 2017 by 8%. This does not support the ongoing discussions of a labor shortage. In fact, jobs growth is exceeding construction volume.
Biggest upward revisions to my forecast since December: Educational from -4% to +5%, +$7bil; Manufacturing from -2% to +9%, +$7bil; Highway from +1% to +21%, +$18bil; Environmental Public Works from +7% to +24%, +$7bil.
Biggest downward revisions to my forecast since December: Residential from +0.5% to -5%, -$38bil; Commercial from -1% to -8%, -$8bil; Transportation from +14% to +7%, -$5bil.
See also Notes on April 2019 Construction Spending Report which includes greater explanation of major market activity.
Bullet Points for May
Construction is cyclical in periods, not so much month over month. The 1st 5 months 2019 averaged slightly higher than the last 6 months of 2018.
Residential construction is the biggest drag on total spending right now. The current 3mo average spending is the lowest in 27 months. That will improve some over the next 12 months, but then, if the forecast for new construction starts does not improve, will head even lower for 2020.
All sectors will improve in the 2nd half of 2019 vs 1st half. Residential +3%, Nonresidential buildings +3%, Non-building Infrastructure +9%. These improvements are only enough to bring total 2019 spending to +2.3% over 2018.
Nonresidential new construction starts through 2018 are at all-time highs and are expected to set new highs again in 2019.
Although ytd spending is down 0.2% from the 1st five months of 2018, by year end ytd will climb to 2.3%. The 2nd half of 2018 was in decline while the 2nd half of 2019 is on the rise.
Non-building Infrastructure spending is the strongest it has been in many years. Indications are for a steady increase in spending completely through 2020. Highway, Transportation and Public Works are all contributing to increases.
Growth in new starts and backlog last three years: Highway starts up 33%, backlog up 42%; Transportation (since 2015) starts up 60%, backlog up 100%; Public Works new starts up 38%, backlog up 33%. Backlog growth for these three markets all expected to increase ~25% for start of 2020.
Growth in annual spending in data going back to 2001: Highway spending for 2019-2021 best 3 yrs ever; Transportation 2018-2021 best 4 yrs ever; Public Works 2019-2020 best 2 yrs ever.
For nonresidential buildings, almost 80% of all spending in any given year is already in backlog from starts prior to that year. For non-building infrastructure it’s 85%. So come Jan. 1 2020, 80% to 85% of all nonresidential spending in 2020 is already on record in backlog. For residential it’s only 30% due to shorter duration and the dependence on more starts within the year.
Inflation has been increasing 4% to 5% per year since 2012. Construction spending needs to increase greater than inflation to add volume within the year. Total construction volume has not increased in over two years and will drop 2% in 2019.
Jobs are increasing while volume is decreasing. That’s like a factory putting on more workers to make fewer widgets.
I wouldn’t be surprised to see, within the next few jobs reports, a slowdown in total construction jobs growth but a pick up in heavy engineering jobs. If the last 5 months are an indicator, the decline may have already begun. We’ve just posted the lowest 5 months jobs growth (52k jobs) in the last 7 years.
For more on Jobs see Construction Jobs and JOLTS
My forecast output is dependent on all monthly cash flows from scheduled new construction starts. I rely on Dodge Data & Analytics for starts data.
This forecast does not predict a recession, however does reduce growth in new starts over the next three years. If a recession were to occur, it would substantially reduce future starts. However, the last “construction” recession started in 2006-2007 with declines in residential work. New starts in nonresidential buildings kept increasing into 2008. The “nonresidential” spending recession did not start until 2009, three years after the beginning of the residential decline.
