Home » Posts tagged 'labor' (Page 2)
Tag Archives: labor

Construction Jobs / Workload Balance
11-7-17
The last time construction jobs and workload were balanced was 2005. From 2006 through early 2011, workload dropped 15% greater than the decline in jobs. In other words, compared to 2005, contractors started the post-recession period in 2011 with 15% less workload on hand compared to the number of workers kept on staff and that resulted in the period 2006-2011 posting the largest productivity decline ever recorded.

For a discussion on data plotted 2001 to 2011, see this post Jobs vs Construction Volume – Imbalances. In the 2001-2011 plot above, jobs and workload are set to zero baseline in Jan 2001. This shows all of 2001 through 2004 that jobs/workload was balanced. The gap between the red and the blue lines above is the variance from zero change in Jobs/Workload balance. By Jan 2011 there was a 15% workload deficit.
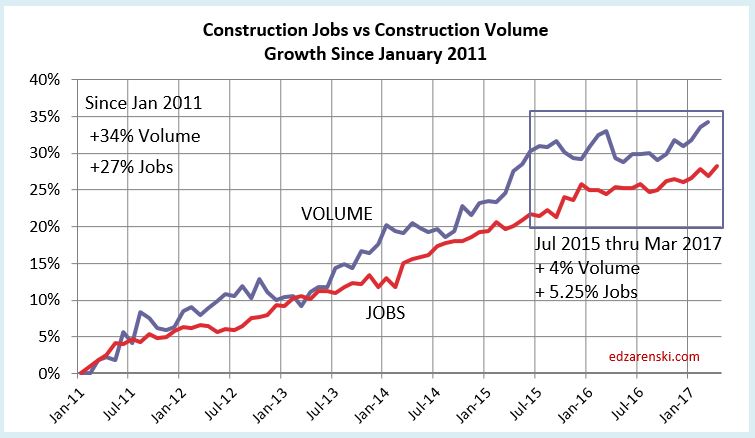
The 1st quarter of 2011 was a dramatic turning point. Both jobs and work volume began to increase. To visualize the variance since Jan 2011, the following plot resets jobs and workload to zero baseline in Jan 2011.

From Jan 2011 to Jun 2015, construction volume increased 24% in 4 1/2 years. Staffing output increased 19% in the same period. Contractors may still feel the effects from not being able to grow staff at that same pace as volume during that period. However, we did see the larger work volume increases make up 5% of the 15% workload deficit from the previous period 2006-2011, but it loses sight of the fact that after almost five years we had not recouped the entire lost work output from all the other 10% staff imbalance that still remained.
Work output is defined as jobs x hours worked. Construction volume is defined as spending minus inflation.
From Jul 2015 to Oct 2017, volume increased just over 1% but jobs output grew by almost 7%. During that two year period, new jobs created plus the change in hours worked by the entire workforce grew 6% more than workload. Jobs increased greater than construction volume increased. The plot shows most of that variance occurred in 2015.
Shifting the time periods slightly gives another impression of the data, overall not much different. In discussions about Construction skilled labor shortages, it’s important to understand, both construction spending and volume are at record growth levels and jobs, since recession, and in last 3 yrs, have matched volume growth.

Overall, in the seven-year post-recession period Jan 2011 to Oct 2017, volume increased 25% and jobs output increased 26%. There seems very little room to be calling this a jobs shortage. Of course, this does not address skills.
So here we are most of the way through 2017 and if we look back at the last 11 years, not only are jobs once again increasing faster than workload, but also in total since 2005 we still have 14% staff that would need to be absorbed by new workload to return to the previous jobs/workload productivity balance.
Maybe it’s time we stop calling this a jobs shortage and start referring to it as a productivity challenge that needs to be turned around.
For an expansion of more information on this topic see Jobs vs Construction Volume – Imbalances posted 8-8-17. Included is the 2001-2011 plot that explains all of 2001 through 2011.
Also, Feb 208 article breaking out residential and nonresidential sectors shows surplus in nonres and deficit in residential Residential Construction Jobs Shortages

Construction Jobs Growing Faster Than Volume
5-5-17
Jobs growth slowed in the last two months adding only 6,000 construction jobs since February. However, a longer term look at jobs x hours worked vs volume growth gives better information.
In the following plot Jobs (red line) = # of jobs x hours worked and Construction Volume (blue line) = construction spending in constant $ (adjusted for inflation). Unless we make these two adjustments we cannot compare jobs to construction spending and get any meaningful analysis from the data.
I’ve written about this in-depth in these two articles.
A Harder Pill To Swallow! and Is There a Construction Jobs Shortage?
You can see in the plot above from Jan 2011 to Mar 2013 both jobs growth and volume growth balanced. Then again by August 2014 jobs growth caught up to volume growth. It was the period from Aug 2014 to Jul 2015 when volume took off and climbed much faster than jobs growth. But then, since July 2015, jobs have been increasing faster than construction volume growth.
In a plot of this information back to 2005, it would show that by the end of 2010 there were already excess jobs. That is discussed in the attached articles. During the expansion, firms hired more employees than real work volume could support, then during the recession, firms held onto far more staff than was required to perform the available declining work volumes. So the chart above would start 2011 with an excess of jobs and really we needed to see work volume increase faster than jobs starting in 2011.
Long term, having started 2011 with not enough volume to support the remaining staff, we see two periods of growth in which jobs and volume were balanced, only one period where volume exceeded jobs growth and then this latest period, for the last 21 months, in which jobs are growing faster than volume.
There are many reports of job shortages and they appear to be genuinely accurate assessments, primarily regarding some very specific skilled labor positions. However, long term jobs vs volume data shows there is far more in play than not enough workers to hire. In fact, for the last 21 months, hiring has exceeded workload and that simply does not indicate an overall worker shortage.

A Harder Pill To Swallow!
4-8-17
I’ve been saying for a long time the data doesn’t show a construction jobs shortage.
In total, construction jobs have been increasing faster than construction volume (spending minus inflation). But, to get a better picture we need to look at jobs vs volume by sector, Residential and Nonresidential. Then we need to look at history.
Since 2009, RESIDENTIAL volume has increased 49%, jobs increased 22%. This is partly explained by absorption of excess staff retained during recession.
From 2006 to 2009 volume decreased 53% but jobs decreased only 36%, leaving a significant amount of excess jobs.
It looks like from 2009 to 2016 there has not been enough jobs growth to support the volume growth, BUT…
Residential net changes just since 2006, volume is down 29% while jobs are down 22%. We are not nearly back to pre-recession productivity.
Since 2009, NONRESIDENTIAL BUILDINGS volume is down by 10% but jobs are up 13%. By no means, if we look at just these 7 years, does this look like a jobs shortage.
Even previous years imbalance would not account for a need to add that many jobs. From 2006 to 2009 volume increased 2% but jobs decreased 15%. In a previous report Is There a Construction Jobs Shortage? I explained why this may occur following a prior top-heavy jobs expansion during a period of high inflation.
Nonresidential net changes just since 2006, volume is down 8% but jobs are down only 3%. Again, we are not nearly back to pre-recession productivity.
For both residential and nonresidential buildings, comparing post-recession growth to pre-recession 1996-2006 $ Put-In-Place per Job, productivity is down 21%, or we currently have 100/(100-21) = 27% more jobs now than it took before to get the same amount of work done.
If the current construction expansion period is viewed as having a jobs shortage, that claim demands that we must accept, since pre-recession, productivity has declined by 21% and the reason there is now a jobs shortage is that it takes 27% more jobs to put in place construction than it did on average from 1996 to 2006.
In my opinion, that’s a harder pill to swallow than a jobs shortage.


For more related to this discussion see Is There a Construction Jobs Shortage?

Is There a Construction Jobs Shortage?
3-10-17
The imbalance between construction spending and construction jobs is nothing new. It’s been going on for years. It reflects more than just worker shortages. It captures changes in productivity due to activity. It also helps explain why sometimes new jobs growth rates do not follow directly in step with spending growth. A big part is that it reflects hiring practices. That imbalance can be affected by either over or under-staffing and that can be affected by inflation.
2000-2008 The Expansion
For the 1st several years, nonresidential construction spending was flat or down. Then for two years spending was up only slightly, but constant $ volume (spending inflation adjusted) had actually decreased. Nonresidential jobs fell from 2001-2003 but then grew for several years during this period when constant $ volume was decreasing, creating productivity losses.
On the other hand, residential spending grew 80%, but after adjusted for inflation, volume grew only 23%. Most staffing increases during this period were for residential construction and jobs/volume growth was pretty consistent. Residential saw mixed productivity during this period. In 2006 residential volume had already started declining.
It is not uncommon when work is plentiful that productivity declines. In 2004-2005, spending increased by 24%, but inflation was hovering around 8% to 9%/year. Constant $ volume (spending after inflation) increased by only 6%. Jobs grew faster, by 9%. Net productivity decline.
In 2006, nonresidential work was starting to take off, increasing 45% from 2006 though 2008. During this period jobs increased by only 8% and volume added 16%. Excess volume was able to absorb a good portion of the jobs/volume imbalance from 2000-2006.
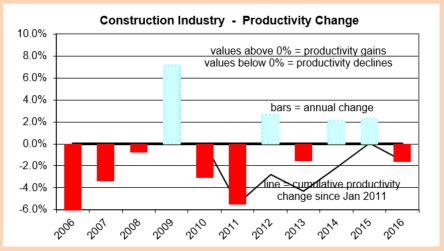
See the line chart below “Productivity = Annual $ Put-In-Place per worker. These up or down periods for each of these sectors discussed here can easily be seen in rising or falling $PIP volume on that chart, sectors plotted separately. The bar graph “Total Annual Productivity Change”, is the composite total of the three sector graphs.

Net volume in 2006 declined, but jobs increased another 5%. For the three-year period 2004-2006, spending increased by 28%, but after inflation, real volume increased by less than 5%. Jobs increased by 14%. Productivity declined by nearly 10%.
Heading into 2007, residential firms had excess staff, as measured by the negative imbalance of jobs/volume. Compounding productivity issues, when spending started to decrease significantly, it took longer for companies to downsize their workforce. The workforce was not reduced to match the volume of work lost. Residential construction was first to show the strain, already having started to decline in 2006 and continuing to decline through 2009.
2006-2010 The Residential Recession
Residential construction was 1st hit by the recession in early 2006. For the 4 years 2006-2009, residential volume dropped 55%. It remained flat for two more years, down a few more percent. Over six years starting 2006, residential jobs dropped only 40%.
The Annual $ PIP line chart above shows that for 2006-2009 there were only residential losses, or negative balance between jobs/volume. Both nonresidential sectors were improving slightly at the time. The total negative bars in those years is entirely due to residential.
2009-2011 The Nonresidential Recession
Nonresidential Buildings construction didn’t fall into recession until 2009. In the two years 2009-2010, nonresidential buildings lost over 30% in volume but only 22% in jobs.
This chart simply shows the imbalance between the number of jobs and the dollar volume of work put in place for each year compared to the year before. In a simple form that can be referred to as a change in productivity. In all these charts, jobs/year are adjusted for hours worked and dollars are always constant $ inflation adjust to 2016$.

In 2009 my chart shows a huge productivity gain. It is almost entirely due to Non-building infrastructure, which never did fall into deep recession. Combined residential and nonresidential buildings only in 2009 would have shown a net 1% gain.
2011-2012 Early Recovery
Starting 2011, firms had lost significant revenue but had retained more staff than needed. There was so much excess staff (in relation to how much total revenue was available) that almost no reasonable gains in spending could wipe away the losses in productivity. Volume improved by 1%, but hiring resumed and jobs grew by 1%. Due to excess staff still on payrolls, productivity showed a 6% decline.
For the next few years, when we look at jobs growth vs. volume growth, there is reason to believe that slow jobs growth (2011 through 2013) may not be all due to labor shortages. Although we lost more than 2 million jobs, there remained excess jobs when compared to the amount of volume that was available.
At least part of the blame for slower new jobs growth was that excess staff already on hand were being absorb by the new spending gains. For a period there was insufficient volume out in the market to support all the staff that had remained on board. Finally, there was increased revenues which would first reabsorb part of the excess labor before rehiring started.
2012-2016 The Construction Boom
It took three more years to see a significant move towards balancing jobs and real volume. In 2014, jobs increased 6% and constant volume increased 7%. For the first nine months of 2015, jobs increased 3% and volume increased 8%. This was a good productivity balance period.In the three years 2012-2014, volume increased 16% but new jobs grew by only 11%. The increased work volume absorbed a good portion of the excess staffing.
What reasons could cause contractors to think they need more staff?
One reason may be that contractors don’t typically track revenues in constant dollars, they track in current dollars. So any comparison to a previous year is to inflated data. To achieve business plan growth of 6%/year, is it necessary to grow staff by 6%/year? Not if during that period inflation is 4%. Then real volume growth is only 2%/year and new staffing needs are far less than anticipated.
Basing staffing needs on current $ revenue growth can lead to the same kind of over-staffing we saw going into the recession. In the three years 2004-2006, construction spending increased 30%. Jobs increased 16%. However, during that three-year period construction inflation was the highest ever recorded, composite inflation averaging greater than 8%/year. After inflation, real construction volume increased only 4% during that period. Hiring far exceeded the rate of real volume growth. There is the potential that contractor’s hiring could be swayed by highly inflated spending when actually volume is not as strong as thought.


From the Jan 2011 bottom of the construction recession through Dec 2016, both work output (jobs x hours worked) and volume (spending after adjustment for inflation) increased equally by 29%.
(note: BLS revisions to hours worked, issued in the 3-10-17 release changed total growth output from 29% to 30%).
There are always unequal up and down years, but this longer term period shows balanced growth returned after a tumultuous period. We were so far down on the scale after the recession it seems reasonable that we experienced this re-balancing.
Both 2014 and 2015 show productivity gains. That is unusual in that there have not been two consecutive years of productivity gains in 23 years (while my jobs data goes back to 1970, spending data goes back only to 1993).
The trend changed in October of 2015. Now when we look at jobs growth vs. volume growth, there is reason to believe that any jobs growth slow-down may be at least in part due to recent over-hiring.
2014-2016 Record Jobs Growth
In the last three years, we’ve added 840,000 construction jobs. We’ve also increased hours worked to an equivalent to 880,000 jobs, growth of 15%. That’s a faster rate of growth in three years than the 2004-2006 construction boom. To help explain that growth, real volume in 2014-2016 was far greater than the volume in 2004-2006, or any other three-year period for that matter. The last time we’ve seen jobs growth like this was 1995-1999.
2012 through 2016 is the greatest construction boom on record, whether measuring unadjusted current $ spending or constant $ real volume after inflation, flying past the 2000-2005 boom and narrowly beating out 1995-2000. And we started 2017 with backlog at a record level, so the boom continues.
5-Year Construction Booms Compared to 2012-2016
- 2012 – 2016 current $ +$377 bil +48% — constant $ +265 bil +29%
- 2001 – 2005 current $ +$314 bil +39% — constant $ +30 bil <3%
- 1996 – 2000 current $ +$254 bil +46% — constant $ +235 bil +21%
Notice how little growth actually occurred in the five-year period 2001 through 2005. While there was significant spending growth, most of it was inflation, and 90% of it was residential. During that period composite inflation increased more than 35%. Also, nonresidential construction was having a setback, dropping 15% in volume in that five years. The real story out of the 2001-2005 boom period is to compare residential work.
- 2012 – 2016 Rsdn current $ +$211 bil +83% — constant $ +146 bil +46%
- 2001 – 2005 Rsdn current $ +$280 bil +80% — constant $ +132 bil +23%
Residential inflation 2001-2005 was a whopping 47%. But, total residential spending was up 80%. After adjusting for inflation, residential still added 23% to volume during that period. During both periods, residential volume grew more than jobs, so both periods had a net productivity gain.
Also in 2001-2005, nonresidential added 3% more jobs in a five year period in which volume dropped 15%. The very high levels of inflation help explain why staff may have grown to such excess during that period. Contractors were seeing revenues grow by 20%-30% and were slowly adding jobs in a period when real volume was dropping 3% per year.With the exception of residential growth, there was a downturn in other work. New jobs increased by only 11%, but due to rampant inflation, real volume increased by less than 3%. Nonresidential contributed all the negative productivity in 2001-2005.
2014-2015 Construction Spending for the Record Books
- 2014 to 2015 current $ +$206 bil +23% — constant $ +158 bil +16%
No two consecutive years of construction come close to equaling the real volume put-in-place during 2014-2015. The two years 2004-2005 had greater growth in spending, but most of that was inflation, so had little growth in volume. In fact, we would need to consider three consecutive years to come close to 2014-2015 and the three years that comes closest is 1996-1998 and that would still be a few percent short. This volume growth is driving huge jobs growth.
From October 2015 through March 2016, jobs growth was exceptional. During that 6 month period we added 215,000 construction jobs, the fastest jobs growth period in a decade. That period topped off the fastest two years of jobs growth in 10 years. Record increases in jobs growth are not what we might expect if there is a labor shortage.
And yet, the Jobs Opening and Labor Turnover Survey (JOLTS) is the highest it’s been in many years and that is a signal of difficulty in filling open positions. But, one of the known factors during a high level of market activity (lot’s of construction work – we are at record levels) is that workers know there is another and sometimes better job just down the road. During high levels of activity, unless the current employer is paying some kind of premium to keep them, workers may leave for greener pastures. That creates a high level of job churn.
Hiring Changes Lag Volume Changes
It is important to take note that it appears the two most recent six-month surges in jobs lag the period of greatest volume growth. I noted earlier that contractor staffing changes seem to lag movements in volume.
Since Sep 2015, jobs have been increasing more than real construction volume. For much of 2014 and 2015 construction spending real volume growth was exceeding jobs growth. Spending in 2016 slowed from the all-time record levels. That’s not totally unexpected as it would be highly unusual for that record level of growth to continue. But hiring continues.
Since Sept 2015, construction volume growth (spending minus inflation) slowed or stalled and completely contrary to what one would expect in a labor shortage, new jobs growth has been exceeding volume.
- From Sep15 to Mar16 jobs increased+3.3%, volume increased +1.6%
- From Mar16 to Aug16 jobs had no change, volume decreased -3.3%
- From Aug16 to Feb17 jobs increased +2.6%, volume increased +0.10%
This most recent six-month period posted 177,000 jobs, the 3rd best for any consecutive six months since 2005-2006. Although we experienced a slow down in new jobs through the middle of 2016, that was bracketed by two of the three strongest six month growth periods in more than 10 years. For 18 months Sep’15 to Feb’17, jobs are up 7% higher than volume. For 2012-2014 volume grew 6% more than jobs.
For 2017, several economists are predicting total construction spending will increase by just over 6% (including my estimate of 6.5%). However, I’m also predicting that combined construction inflation for all sectors will increase by about 4.5%. That leaves us with a net real volume growth of only 2.0%. Therefore, for 2017, I do not expect jobs to increase by more than 2.0%, or 140,000. That number seems hard to swallow given we are already at 98,000 in the first two months. But remember, jobs have been growing faster than volume for the last 17 months. We could be due for another no-jobs-growth absorption period.
If jobs increase more than 140,000 and both spending and inflation hold to my predictions, then jobs will continue to outpace volume and that will show up on my plot as a productivity loss for 2017. Jobs have been getting ahead of volume for 17 months. Contractors may still be hiring, lagging the movement in real volume growth. It will take the next few months to see if that is the case but I would expect jobs growth to slow or stop for the next few months and I would not attribute that to labor shortages. As we’ve seen before, we should expect jobs/volume to come back to balance. (post note: following Jan-Feb when, after revisions, we added 88k jobs, in the next 5 months we added only 13k jobs. Jobs growth almost stopped for 5 months.)
So, here we are powering our way through the greatest construction expansion ever recorded, with three years of jobs growth at a 11-year high and jobs growing faster than volume for the past 17 months. Does that seem like a jobs shortage to you?
For a continuation of this discussion see A Harder Pill To Swallow! and Construction Jobs Growing Faster Than Volume
BTH – 20 Snips From Recent Articles
2-17-17 Behind The Headlines
- From the Jan 2011 bottom of the recession in construction to current, both net jobs (jobs x hours worked) and volume (spending after adjusted for inflation) have increased equally by 28%.
- Growth of only 100,00 to 140,000 new jobs in 2017 would be the slowest growth in 5 years and will look like a hiring slowdown. Some might attribute it to lack of available workers. In large part it may be due to a balancing of workforce to real volume growth.
- Staffing patterns (appear to) lag changes in work volume.
- These six Nonresidential Buildings markets, which make up 80% of all nonresidential buildings spending, posted the following growth in starts leading into 2017: Office +37%, Lodging +40%, Educational +11%, Healthcare +21%, Commercial Retail +11% and Amusement/Recreation +21%
- Nonresidential buildings 2017 starting backlog is 45% higher than at the start of 2014, the beginning of the current nonres bldgs growth cycle.
- Office construction starting backlog for 2017 (projects under contract as of Jan 1, 2017) is the highest in at least 8 years, more than double at the start of 2014 when the current growth cycle of office construction spending began.
- For 2017, the amount of construction spending (on manufacturing buildings) from starting backlog has dropped 25% from the level of 2016. Even an increase of 50% in new 2017 starts would not make up for that loss.
- More infrastructure projects started construction in the 1st 6mo of 2015 than any time in history. This will boost infrastructure spending through 2017.
- As measured in comparable constant dollars, No, we are not back to previous levels of spending. We will probably not return to previous highs before 2020.
- The entire construction industry best growth rate ever achieved (in 2016 constant$) absorbed $1 trillion in new spending over 5 years. Infrastructure has not absorbed $1 trillion newly added work in 25 years.
- long term best average rates of growth (indicate) we could increase infrastructure spending through new stimulus between $7 billion to $10 billion a year
- Construction spending, from 1st release to last revision of data, has been revised upward every month since August 2013. That would indicate the first reports of an “unexpected decline” almost always get revised up in following months.
- In the last 36 months, there were 16 Census construction spending releases that initially showed a decline vs the previous month. Five months showed a decline vs the previous year. After revisions every month was revised up from the original posted amount. There remained only 2 significant mo/mo declines. There were no remaining year/year declines.
- Current year YTD “not-yet-revised” values for new construction starts are always compared to the previous year YTD “revised values” which has the affect of making current year growth appear lower than it should. In the last 10 years the YTD revisions to previous year values have never been down.
- Residential starts in 2016 posted the best year since 2005-2006. Residential starts bottomed in 2009 and have now posted the 7th consecutive year of growth.
- Total construction spending in 2017 will reach $1,236 billion supported by a 4th consecutive year of strong growth in nonresidential buildings.
- Office construction reached a new all-time high in September 2016. Spending will be in the range of +20% to +30% year over year growth for 2017 with total coming in at $91 billion.
- It’s real damn hard to add $100 billion in new construction volume in a year. After adjusting for inflation, construction volume has never increased by $100 billion. It has increased by $75 billion 4 times and 3 more times by $50 billion.
- If you want to avoid misusing a cost index, understand what it measures.
- Selling Price, by definition whole building actual final cost, tracks the final cost of construction. Selling price indices should be used to (adjust costs for inflation so you can) compare costs over time.
Behind The Headlines – Construction Jobs
2-16-17
- In the six months from Oct’15 to Mar’16 construction added 225,000 jobs, the most in any six month period since the Oct-Mar 2005-2006, the very peak of the construction spending boom.
- In the last three years, we’ve added 840,000 construction jobs. We’ve also increased hours worked to an equivalent to 880,000 jobs, growth of 15%. That’s a faster rate of growth in three years than the 2004-2006 construction boom.
- In order to track jobs growth compared to the real amount of work put-in-place, construction spending must be adjusted for inflation to get real volume of work completed. The adjustment gives us what is referred to as “constant dollars.” Jobs must be adjusted for hours worked.
- For much of 2014 and 2015 construction spending real volume growth was exceeding jobs growth, but for 10 months from August 2015 through May 2016, volume growth stalled and (completely contrary to what one would expect in a labor shortage) new jobs growth exceeded volume by 3%. Only in the last few months has volume growth begun to outpace jobs growth again.
- From the Jan 2011 bottom of the recession in construction to current, both net jobs (jobs x hours worked) and volume (spending after adjusted for inflation) have increased equally by 28%.
- For 2017, several economists (including myself) are predicting total construction spending will increase by just over 6%. However, I’m also predicting that combined construction inflation for all sectors will increase by 4.0% to 4.5%. That leaves us with a net volume growth of only 1.5% to 2.0%. Therefore, for 2017, we should not expect jobs to increase by more than 1.5% to 2.0%, or 100,000 to 140,000.
- Growth of only 100,00 to 140,000 new jobs in 2017 would be the slowest growth in 5 years and will look like a growth slowdown. Some might attribute it to lack of available workers. In large part it may be due to a balancing of workforce to real volume growth.
- Jobs growth is often slightly out-of-balance with real volume growth. But it does tend to come back to balance. If both were to grow at the same rate then productivity would remain unchanged. It will very likely vary slightly from balanced growth.

Construction Spending vs Jobs
2-9-17
A few days ago I tweeted, “Last 16 months construction jobs growth outpaced growth in work put-in-place. Hard to see worker shortage from that perspective.”
The imbalance between construction spending and construction jobs is nothing new. It’s been going on for years. It reflects more than just worker shortages. In part it reflects hiring practices. It also captures changes in productivity due to activity. It also helps explain why sometimes new jobs growth rates do not follow directly in step with spending growth. That imbalance can be affected by either over/under-staffing or inflation.
This post presents a series of graphics that show the data that is compared and the percentages of increases (or declines) in balance between workers and output.
What data is available?
We get construction spending from Census and jobs from Bureau of Labor Statistics. For both we can break down the numbers by major construction sectors, Residential, Nonresidential Buildings and Non-building Infrastructure. Inflation is gathered from a number of sources and is specific to sector.
How to look at the data.
Construction spending must be adjusted for inflation to get real volume of work completed. Inflation (or deflation) can vary up or down by 2% to 10% but averages about 4%/year. The adjustment gives us what is referred to as “constant dollars.” Jobs must be adjusted for hours worked. Hours worked can change total workforce output by 2%-3%/year. Everything is converted to the most recent year for comparison.
The inputs:
This Building Cost Index plot shows inflation/deflation by sector. Note that it can vary dramatically from one sector to another. It is often driven by the amount of work activity within the sector. These indexes represent the actual final cost of buildings.

The inflation factors are applied to the annual spending within each sector. This plot shows the combined affect of inflation on total construction output. Current dollars is actual construction spending as reported by U.S. Census. Constant $ is inflation adjusted to 2016. Jobs adjusted for hours worked must be compared to constant dollars.

This plot breaks down the construction spending in constant dollars by sector. This provides the total work completed annually within each sector. This will allow tracking jobs by sector to constant $ by sector.

This plot shows U.S.Census CES jobs by sector. These are adjusted by the hours worked average per year. Hours worked doesn’t change by much within a single year but has varied by 4.5% from maximum to minimum and that has a significant affect on overall output. Adjusted jobs provides us with the total work output.

Those are all the inputs, adjusted to a constant point in time, 2016. Now we can look at how adjusted jobs growth compares to real spending output. I’ve often referred to this as productivity. When spending output is growing faster than jobs, productivity is increasing. When jobs are growing faster than spending output, productivity is decreasing.
The Outputs:
The difference between real spending output and jobs growth is more than simply explained as a change in productivity. It reflects the combined impact of hiring practices, hours worked, worker and skills shortages (or excesses) and changes in productivity on inflation adjusted spending. It does not provide a means to differentiate among these causes. However, regardless the cause, imbalances can be thought of as annual productivity gains or losses because they do indeed reflect the total real labor output required to perform the amount of real work put in place.

Leading up to and during the recession there appeared to be far more workers on hand than needed to get the work done. Prior to the recession, I expect a greater portion of the losses were over-hiring and worker productivity losses. It is not uncommon when work is plentiful that productivity declines (2005-2006). When spending started to decrease significantly it took a bit longer for companies to downsize their workforce. During that time (2007-2008) the greater portion of losses might be attributed to insufficient staffing reductions. As we approached the depths of the recession (2009-2010) staffing cuts exceeded the declines in actual work being put in place. Also, people who still had jobs were concerned about keeping their jobs and during such times at first productivity increases. At some point the insufficient staff becomes overworked and productivity declines (2010-2011). Post recession, spending increased faster than companies were replenishing their staff. That led to several years of productivity gains (2012-2015).
Another way to look at this same comparison is to plot the dollars of inflation adjusted volume of work per worker. Here I’ve plotted that by sector.

Some analysts prefer to report this as the number of jobs required to put-in-place $1 billion worth of work. Regardless how it is reported, it is imperative that the comparison be made to constant $, in this case adjusted here to 2016.

Finally we can look at the data for each sector and compare the work being completed each year to the total workforce output to complete that work. There are obviously significant differences in the data by sector.


The data outputs show some things that otherwise are not readily apparent. Note for instance that residential (constant $) spending peaked in 2005, but residential jobs peaked in 2006 when spending was already on the decline. That could be an indication that staffing patterns lag changes in work volume. From the 2005 peak to the 2008 bottom, residential spending declined from $700 billion to $300 billion, almost 60%, but jobs dropped from 3.5 million to 2 million, only about 45%. That would indicate that firms were significantly overstaffed at that time. That explains the several years of deep red bars on the residential productivity plot. That also helps explain in part the slow regrowth on residential jobs. For the real volume of work that was being completed at the time, which was real low, there was already excess staffing remaining on hand.
Work completed and worker output to complete the work will probably continue to be out of balance. It would be difficult to identify any abnormalities in the data releases, for example workers improperly classified to a sector. Any missing workers not captured in the survey would lower productivity. Real productivity gains and losses due to activity will always be a part of the mix. Hiring of less qualified workers due to skilled worker shortages is in the mix. And finally, companies delayed decisions on staffing adjustments will remain part of the issue.

Saturday Morning Thinking Outloud #3 – Construction Jobs
Why the big slow down in construction jobs this Year? Is work volume on the decline? Are labor shortages to blame?
These days, the most talked about reason for slower jobs growth is the lack of experienced workers available to hire. In fact, recent surveys indicate about 70% of construction firms report difficulty finding experienced workers to fill vacant positions and the Job Openings survey has been at highs for several months. That certainly cannot be overlooked as one reason for slower jobs growth, but that is not the only reason?
Although recent growth has slowed, even with all this talk of difficulty finding experienced construction workers, there has been very good jobs growth. For the 5 ½ year period from the low point in January 2011 to the present (August 2016) we added 1,240,000 construction jobs.
- Jobs increased by 23% in 5 ½ years.
- Spending growth increased 52% in that same 5 1/2 years.
Why is it that jobs don’t increase at the same rate as construction spending? Because much of that spending growth is inflation, not true volume growth. Volume is construction spending minus inflation. To get volume, convert all dollars from current $ in the year spent into constant $ by factoring out inflation.
- Spending growth is not a true measure of increase in real volume.
- Jobs growth should not be compared to spending growth.

Now that we have spending converted to volume, we need to adjust jobs to get real work output. The total hours worked affects the entire workforce so has a significant impact on output.
- Jobs is not a true measure of work output.
- Jobs x hours worked gives total work output.

Spending must be factored to remove inflation and jobs should be factored to include any change in hours worked.
- In the 5 1/2 years from Jan 2011 to mid 2016, real construction volume and jobs/hours real output both increased by 28%.
Now we see over the long term, job/hours and real volume are moving in tandem. But there are always short term periods when they do not and that causes ups and downs in productivity.
In 2014-2015, jobs/hours grew by 11%, the fastest growth for a two-year span in 10 years. Real volume of work increased by 16% producing a real net increase in productivity. But productivity had declined significantly in 2010 and 2011. It’s not unusual to see productivity balancing out over time. In part, this is due to companies balancing their total employees with their total workload.
From October 2015 through March 2016, jobs growth was exceptional. 214,000 construction jobs were added in 6 months, topping off the fastest 2 years of jobs growth in 10 years. That is the highest 6-month average growth rate in 10 years. That certainly doesn’t make it seem like there is a labor shortage. However, the jobs opening rate (JOLTS) is the highest it’s been in many years and that is a signal of difficulty in filling open positions.
- For the 6-month period including Oct’15 thru Mar’16 construction gained 214,000 jobs, the fastest rate of consecutive months jobs growth in 10 years. Then, after 3 months of job losses, July, September and October show modest gains.
I would expect growth such as we’ve had for two years and then that 6 month period to be followed by a slowdown in hiring as firms try to reach a jobs/workload balance. It appears we may have experienced that slowdown. Jobs declined for four of five months from April through August. Keep in mind, this immediately follows the fastest rate of jobs growth in 10 years. But it also tracks directly to three monthly declines in spending. (I predicted this jobs slowdown in my data 9 months ago. I predicted the 1st half 2016 spending decline more than a year ago).
It is not so unusual to see jobs growth slowed for several months. It follows directly with the Q2 trend in spending and it follows what might be considered a saturation period in jobs growth. The last two years of jobs growth was the best two-year period in 10 years. It might also be indicating that after a robust 6 month hiring period there are far fewer skilled workers still available for hire. The unemployed available for hire is the lowest in 16 years.
If spending plays out as expected into year end 2016, then construction jobs may begin to grow faster in late 2016. However, availability could have a significant impact on this needed growth.
Availability already seems to be having an effect on wages. Construction wages are up 2.6% year/year, but are up 1.2% in the last quarter, so the rate of wage growth has recently accelerated. The most recent JOLTS report shows we’ve been near and now above 200,000 job openings for months. With this latest jobs report, that could indicate labor cost will continue to rise rapidly.
As wages accelerate, also important is work scheduling capacity which is affected by the number of workers on hand to get the job done. Inability to secure sufficient workforce could impact project duration and cost and adds to risk, all inflationary. That could potentially impose a limit on spending growth. It will definitely have an upward effect on construction inflation this year. If work volume accelerates, expect labor cost inflation to rise rapidly.

Construction Jobs – Behind The Headlines
10/13/16
Headline comparisons we read are often what happened this month versus last month or year-to-date versus last year. For comparisons to construction spending and jobs it is perhaps beneficial to look at recent and longer term trends. Here I will discuss construction jobs growth versus spending growth and highlight some of the pitfalls when comparing these values for productivity.
The most talked about reason for slower jobs growth is the lack of experienced workers available to hire. In fact, recent surveys indicate about 70% of construction firms report difficulty finding experienced workers to fill vacant positions. That certainly cannot be overlooked as one reason for slower jobs growth, but that is not the only reason?
Even with all this talk of difficulty finding experienced construction workers, there has been very good jobs growth. For the 5 ½ year period from the bottom in January 2011 to the present (August 2016) we added 1,240,000 construction jobs.
- Jobs increased by 23% in 5 ½ years with peak growth in 2014 and 2015.
- For the two years 2014+2015 we added 650,000 jobs, the largest number of new jobs in two years since 2004+2005.
In 2014-2015, jobs expanded by 11%, the highest number of jobs in a two-year span since 2004-2005 and the fastest two-year percent growth since 1998-1999. Peak growth was 6.1% in 2014 with slower growth in 2015. I expect even slower growth in 2016.
- For the 6-month period including Oct’15 thru Mar’16 construction gained 214,000 jobs, the fastest rate of consecutive months jobs growth in 10 years. Then, after 3 months of losses, July shows a modest gain.
Jobs growth from October 2015 through March 2016 was exceptional, 214,000 construction jobs added in 6 months, topping off the fastest 2 years of jobs growth in 10 years. That is the highest 6-month average growth rate in 10 years. That certainly doesn’t make it seem like there is a labor shortage. However, it is important to note, the jobs opening rate (JOLTS) is the highest it’s been in many years and that is a signal of difficulty in filling open positions.
I would expect growth like that to be followed by a slowdown in hiring as firms try to reach a jobs/workload balance, after such a robust period of jobs growth. It appears we may have experienced that slowdown. Jobs have been down four of the last six months and up most recently.
- Q2’16 jobs declined all 3 months. Keep in mind, this immediately follows the fastest rate of jobs growth in 10 years. But it also tracks directly to three monthly declines in spending. (I predicted this jobs slowdown in my data 9 months ago. I predicted the 1st half 2016 spending decline more than a year ago).
It is not so unusual to see jobs growth slowed in the 2nd quarter. It follows directly with the Q2 trend in spending and it follows what might be considered a saturation period in jobs growth. The last two years of jobs growth was the best two-year period in 10 years. It might also be indicating that after a robust 6 month hiring period there are far fewer skilled workers still available for hire. The unemployed available for hire is the lowest in 16 years.
Construction spending hit bottom at the same time as jobs, the 1st quarter 2011. For the same 5 ½ year period, Jan 2011 to Aug 2016, construction spending increased 52%, far more than jobs growth. For 2014+2015, spending increased close to 11% per year, the fastest spending growth in more than 10 years.
- For the same 6-months, Oct’15 thru Mar’16, Q4’15 spending was flat but by the end of Q1’16 spending had increased more than 4% in 6 months, to an annual rate of +8%.
- 2nd quarter 2016 spending came in 2% below 1st quarter.
- Total 1st half spending finished 7.2% above the 1st half 2015.
Although spending slowed in the 2nd quarter this year, in part it’s because the 1st quarter was so strong. They combined for a strong 1st half up 7.2% over last year.
Why is it that jobs don’t increase at the same rate as construction spending? Because much of that spending growth is just inflation, not true volume growth. Volume is construction spending minus inflation. To get volume we need to convert all dollars from current $ in the year spent into constant $ by factoring out inflation.
- Jobs growth should not be compared to spending growth.
- Spending increased 52% from Jan/Feb 2011 to Jul/Aug 2016.
- After adjusting for inflation from Q1 2011 to Q3 2016, we find that construction volume increased by 28% in 5 ½ years.
So, it looks like volume (+28%) still increased much more than jobs (+23%) in the same period and this would indicate increasing productivity. But this still is not the whole picture. Jobs need to be adjusted.
- Jobs needs to take into consideration the hours worked.
Before the dramatic decline in jobs from 2007 through 2010, hours worked ranged between 37hrs/wk and 38hrs/wk. But by 2015, and into 2016, hours worked has been consistently over 39hrs/wk. So not only did the workforce grow by 1.24 million jobs (+23%), but also the entire 7.0 million work force is working about 4% more hours/week. This must be considered to get net jobs, or work output.
- After adjusting for hours worked from Q1 2011 to Q3 2016, we find that net jobs growth increased by 28% in 5 ½ years.
- Since Q1 2011 the constant $ value of construction spending increased by 28%.
- Since Q1 2011 Jobs/hours worked output also increased by 28%.
Since Jan 2011, volume increased 28% and workforce output increased 28%, for a net productivity balance, but in 2011 we had a significant productivity loss and a smaller loss in 2013. The huge 2011 productivity loss is probably in part explained by the resumption of hiring after historic job cuts, particularly in 2009 when the work force was cut 16% but, while spending declined by 16%, work volume declined only 11%, which may have overshot the balance mark. That helps account for the huge productivity gain in 2009, but also leads to the losses in 2010 and 2011.
From Jan 2014 to Dec 2015 volume increased by 15% and workforce output increased by only 10.5%. Total hours worked compared to total constant value of spending shows productivity increased for those two years. Historically, we should not expect to see productivity growth continue for a third year and as of August it is down year-to-date.
I expected to see a turn-around in jobs growth in the 2nd half of 2016, and so far, for the 3-month period July-Sept we’ve added 34,000 jobs. That’s starting out perhaps a little slower than I thought. For much of 2014 and 2015 volume growth was exceeding jobs growth, but for 10 months from August 2015 through May 2016, volume growth mostly stalled and jobs growth, which just had 6 months of record high growth, exceeded volume growth by 3%. Only in the last few months has volume growth begun to outpace jobs growth again. But I suspect it is this slow down in real volume growth that has led to slow jobs growth. This leads me to think if spending plays out as expected into year end 2016, then construction jobs may begin to grow faster in late 2016. However, availability could have a significant impact on this needed growth.
Availability already seems to be having an effect on wages. Construction wages are up 2.6% year/year, but are up 1.2% in the last quarter, so the rate of wage growth has recently accelerated. The most recent JOLTS report shows we’ve been near and now above 200,000 job openings for months. With this latest jobs report, that could indicate labor cost will continue to rise rapidly.
As wages accelerate, also important is work scheduling capacity which is affected by the number of workers on hand to get the job done. Inability to secure sufficient workforce could impact project duration and cost and adds to risk, all inflationary. That could potentially impose a limit on spending growth. It will definitely have an upward effect on construction inflation this year.
For all of 2016 and 2017, I predict construction spending will increase about 15%, BUT after inflation construction volume will increase only about 6% to 7%, most of that in 2017. For all of 2016 and 2017, I predict jobs will grow by 350,000 to 450,000, only about 5% to 6%.
Reference Source Information:
U.S. Census released August Construction Spending 10-3-16
BLS released the September jobs Report 10-7-16
Reference Posts:
Construction Jobs Show 3rd Qtr Growth
Construction Jobs – Is July a Turning Point?

Construction Jobs Show 3rd Qtr Growth
Allow me to start this post with a reference
from my blog post 8-6-16 Construction Jobs – Is July a Turning Point?
- For the 6 month period including Oct’15 thru Mar’16 construction gained 214,000 jobs, the fastest rate of growth in 10 years. Then, after 3 months of losses, July shows a modest gain.
- During that same period Q4’15 spending was flat but by the end of Q1’16 spending had increased more than 4% in 6 months, or at an annual rate of 8% to 9%.
- Even though some upward revision is expected for June spending, total Q2’16 spending will still be down 2% to 3% from Q1.
- Q2’16 jobs declined all 3 months, keeping in mind this immediately follows the fastest rate of growth in 10 years. But it also tracks directly to three monthly declines in spending.
Comment Update 10-7-16
U. S. Census released August Construction Spending 10-3-16
BLS released the September jobs Report 10-7-16
June spending did get revised up by 1.85% and 2nd qtr spending came in 2.05% less than 1st qtr. However total 1st half spending finished 7.2% above the 1st half 2015. August spending looks low at 1st print but we can expect that to be revised up by 1% to 2%. Historically, the 1st release of construction spending gets revised up 90% of the time. So it looks like spending bounced off of the April-May low point.
The 2nd quarter jobs slowdown coincided with the 2nd quarter spending dip.
From my blog post 8-6-16 Construction Jobs – Is July a Turning Point?
It is not so unusual to see jobs growth slowed in these last few months. It follows directly with the Q2 trend in spending and it follows what might be considered a saturation period in jobs growth. The last two years growth was the best two-year period in 10 years. It might also be indicating that after a robust 6 month hiring period there are far fewer skilled workers still available for hire. The unemployed available for hire is the lowest in 16 years.
We got modest growth in July that I hope to see continue for the 2nd half 2016. I expect spending to experience strong growth in the 2nd half and jobs growth should follow closely, perhaps adding 125,000 to 150,000 more jobs. However, although I do expect both spending and jobs growth, jobs could be somewhat restrained by lack of available skilled workers.
Comment 10-7-16
Construction Jobs growth from October 2015 through March 2016 was exceptional, 214,000 construction jobs added in 6 months, topping off the fastest 2 years of jobs growth in 10 years. Growth like that can only be followed by a slowdown in hiring until companies reach a jobs/workload balance, and it appears we may have experienced that slowdown. Jobs have been down four of the last six months. I expected to see a turn-around in the 2nd half, and so far, for the 3 month period July-Sept we’ve added 34,000 jobs. That’s starting out perhaps a little slower than I thought. For much of 2014 and 2015 volume growth was exceeding jobs growth, but for 10 months from August 2015 through May 2015, volume growth stalled and jobs growth exceeded volume growth by 3%. Only in the last few months has volume growth begun to outpace jobs growth again. I predicted at least 125,000 new jobs in the 2nd half, so we would need to add 90,000 to 100,000 more before year-end. But, there could be skilled labor constraints and the Aug and Sept numbers are still subject to revision. And we still have 3 months to go.

