Home » Jobs (Page 2)
Category Archives: Jobs

Job Openings – Behind the Headlines
Construction Job Openings – Behind the Headlines
Recent data indicates ~ 300k job openings. Let’s look at support. To support those openings, there must be an equivalent added volume of work.
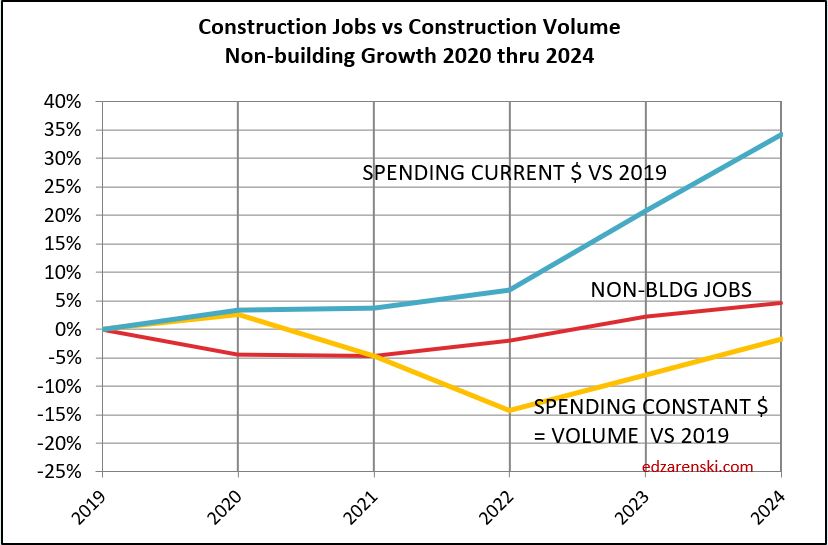
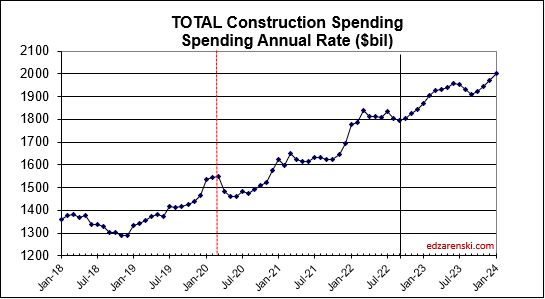
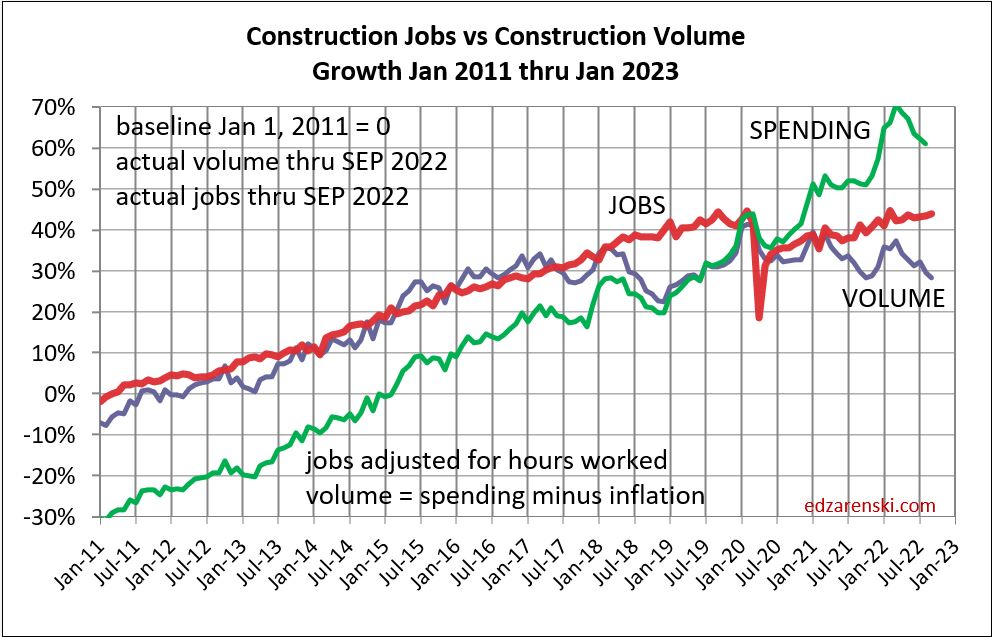
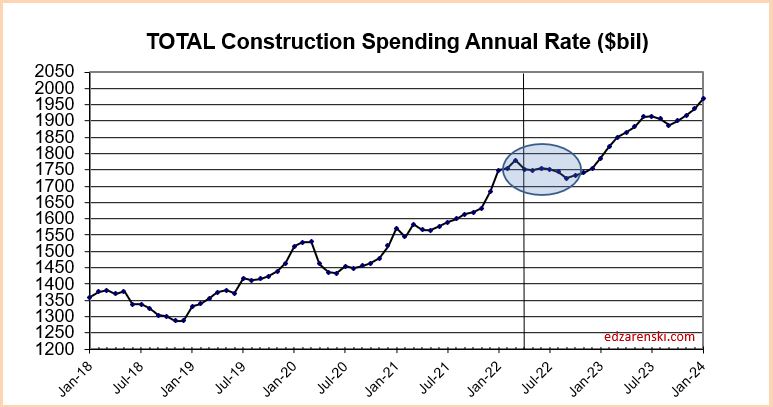
As we entered 2020, construction spending (in current $) was at a (then) all-time high of $1.530 trillion(t). Let’s set that point in time as the base and track growth since. Construction spending peaked in March 2023 at $1.970t and is currently at about $1.950t.
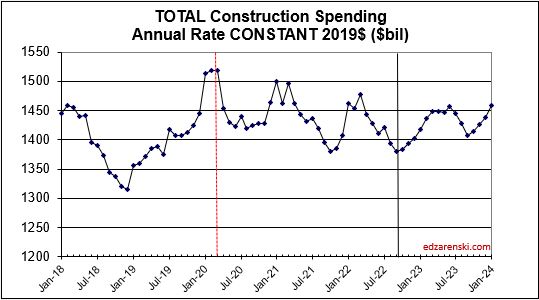
Volume growth in constant $ (constant $ = spending minus inflation) fell from $1.530t to $1.350t in Oct’22, has since returned to $1.450t as of June. So real volume growth is up off the bottom, but is still $80t or 5% below 2020. It is forecast to fall $50t over the next 6 months and return to current level in mid-2024.
Jobs, as we entered 2020, stood at 7.600 million(m). Jobs rapidly fell to 6.500m but recovered most of that by Dec 2020. Jobs now stand at 7.970m, up 5% since Jan 2020.
So, let’s summarize the facts: Since Jan 2020, spending is now nearly equal, volume of work is down 5%, but jobs are up 5%. So, since Jan 2020, jobs have increased 10% in excess of volume of work to support those jobs.
By my calc, if we were to add 300k jobs, either today or over the next year, we would see jobs increase by another 4%. Jobs growth since Jan’20 would exceed volume growth by nearly 14%. You might argue that 300k openings are there to fill the void of jobs supporting the current workload, but jobs growth already exceeds volume growth by 10% in the last 3 years.
Anyone want to try to explain how job openings of 300k is supported by the data?


Note 1: Job openings as of July are closer to 400,000
Note 2: plots shows baseline back to 2020 and 2001. Baseline 2001 situation becomes worse. See prior post https://edzarenski.com/2023/08/05/midyear-23-jobs-outlook/ for plots to baeline 2011 and 2020.
Midyear ’23 Jobs Outlook
Construction JOBS continue to creep higher, even when volume is falling. From Apr’22 to Oct’22 jobs increased 1.5% but volume of work dropped 10%. Jobs and volume should track together as seen from 2011 to 2018. Since Oct’22, jobs are up only 2% while volume up 7%. Volume is catching up.
Jobs have been increasing at 3%/year, or approx 200k to 300k jobs per year. In Feb 2020 there were 7.6 million construction jobs. Now there is almost 8.0 million. The average for 2020 dropped 3% or 170k jobs. But we regained jobs at 2.5% growth in 2021, 4.2% in 2022 and so far over 2% in 2023. Now this is interesting, because we did not see an increase in average volume in 2021, 2022 or 2023. In total, jobs are up 4.8% since Feb 2020, while volume of work is down 4.7%.

Construction Jobs have been on an even rate of growth approx. 2.5% to 3% per year, even when volume is falling. Spending has been on a bumpy climb, but keeps climbing. Without inflation real volume of work overall since 2020 has not increased at the same rate as jobs.
Current July Jobs are up 1.5% since Dec.’22, up 3% vs the average for 2022. July will be pretty close to the average for 2023. As construction inflation slowed down (has been slowing since mid-2022), volume gained ground on jobs over the last 9 mo., but jobs since Jan 2020 are still 10% higher than volume.
Here’s a look at total jobs just since 2020
Why do jobs sometimes/often grow faster than volume to support those jobs? Some possibilities:
When inflation is unusually strong, business planners may misjudge growth. Planning jobs growth on inflated revenues that net much lower than expected volume may lead to misjudging jobs growth. Result is jobs growth faster then volume.
When volume is decreasing, firms may be reluctant to (or smart not to) let go jobs. See the period on the above plot from Mar 2022 thru Oct 2022. Vol dropped 10%, Jobs increased 2%. So, the calculation shows a big excess in jobs for that period, because volume growth doesn’t support it. Within the next six months, volume increased 7%, making up half the difference.
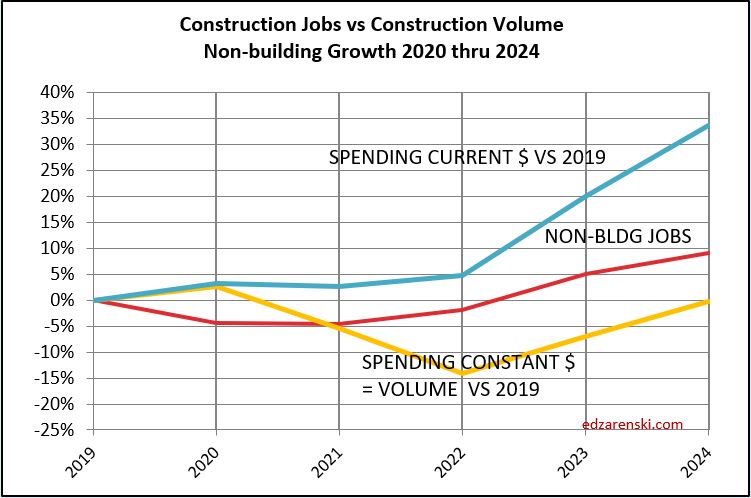
Here’s jobs vs vol in each sector.
Notice how Rsdn jobs barely declined in 2020, but Rsdn volume increased 10%. Did that set off cries of jobs shortage in Rsdn? Not so in Nonres.

In Nonres Bldgs, volume by 2021 had fallen below growth in construction jobs. The deficit reached its worst in 2022 but in the last 9 months volume growth far faster than jobs growth has evened the balance.

Nonbuilding construction volume fell to a deeper deficit than Nonres Bldgs. But we can see the gap closing as volume increases faster than jobs.
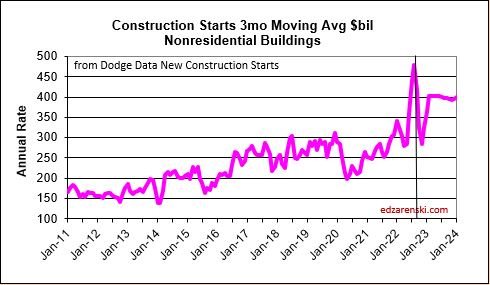
These above three sector plots go back to base 2019, showing how much percent change there has been since 2019. For a longer term look, here below is a plot of Nonresidential Buildings back to 2011. On this plot we can see jobs growth, when compared to 2011, for Nonres Bldgs, is above volume growth since 2017. The low point of volume was in 2021. 2022-2023 has posted the most rapid growth in many years. This closes the gap between Nonres jobs and volume, very helpful to the productivity outlook.

When splitting out jobs by sector we must always remember that some Nonres bldgs jobs actually work on constructing residential buildings (for ex., steel and concrete on a multifamily hirise) but remain counted as nonres jobs. Also, some undocumented workers may not be counted at all in residential jobs. That skews the data plots. But you can see that it would reduce the jobs in Nonres and increase the jobs in residential, improving both plots.
Construction spending data is indicating a slight dip in volume growth over the 2nd half 2023, but then leading into much stronger growth in 2024 in all sectors. Volume by Feb’24 is back to today’s level after falling 5%. I don’t expect jobs to decline with the drop in volume. Maybe slow down. I think at worst jobs hold steady for a few months before resuming 2.5%-3% annual growth later this year.

When jobs continue to increase while volume is dropping, that wrecks productivity. But sometimes volume increases rapidly while jobs grow steady at a 3% rate. Look at the period Oct’22 thru Jan’23. Jobs increased 2%, but volume quickly jumped 6%.

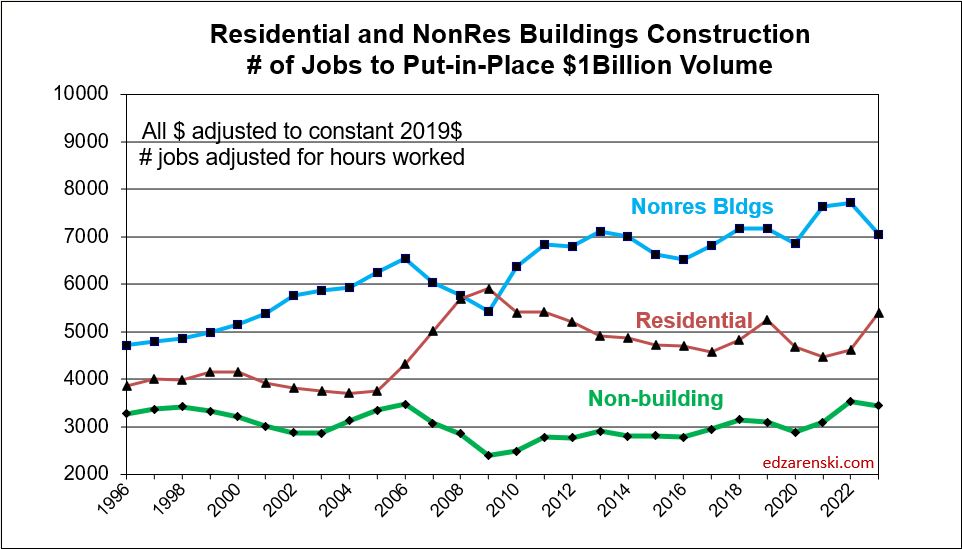
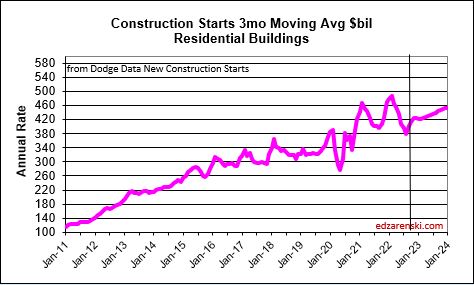
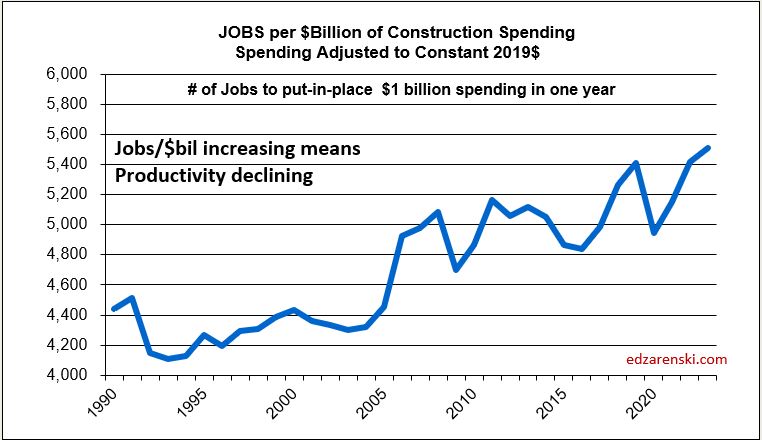
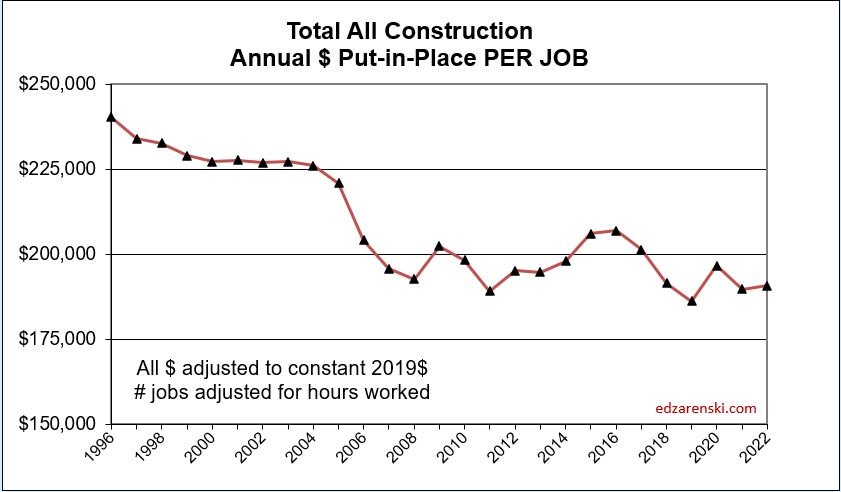
The number of jobs required to put-in-place $1 billion of construction in one year, as plotted below, about 5000 for residential, is the inverse of the plot above, the annual amount of $ put-in-place per job, about $200,000 for residential.
The Next Forecast Challenge
The next big challenge in construction forecasting is to determine, Will Nonres Bldgs spending increase without an equal increase in nonres bldgs jobs? If so, by how much?
At the onset of the Pandemic, nonres bldgs jobs dropped 16%. Jobs have since recovered to down only 1% vs Feb 2020. Spending (bottomed in Sep 2021) fell 17%, but is now up 15% over Feb 2020.
But the key to this comparison is inflation, which, when subtracted from spending gives real volume growth. Inflation adds only to spending, it adds nothing to volume of work.
Nonres Bldgs inflation was 2.4% in 2020, 8.2% in 2021 and 11.9% in 2022. Total Nonres Bldgs inflation from Feb 2020 to Mar 2023 is 26%.
Since the onset of the Pandemic, Nonres Bldgs spending is up 15% but after inflation volume is down 8%. During that time jobs are down 1%. That’s now over three years that jobs exceed volume of work. Let’s look at more recent data.
In the last 12 months, Mar’22 to Mar’23, nonres bldgs jobs are up 3.5%. Nonres Bldgs spending is up 21%, but after ~7% inflation, volume of nonres bldgs workload is up 14%. So, we have a 3.5% increase in jobs to accomodate a 14% increase in volume.
The last year has shown a huge increase in the volume of nonres bldgs work, without an equal increase in jobs. This shows the excess nonres bldgs jobs for the past three years is now absorbing greater workload, (a 3.5% increase in jobs to accomodate a 14% increase in volume), without a cry of jobs shortages.
What’s the real magnitude of this difference in percent growth, a 10.5% increase in volume over jobs. Well that 10.5% increase in volume is $50 billion worth of construction put-in-place. Not delayed, not canceled, put-in-place. With no equal increase in jobs. So the existing jobs put this work in place. $50 billion in one year would normally require 250,000 jobs to put-in-place. Or by using overtime and working the existing workforce longer hours to get it done, the entire nonres bldgs workforce of 3.5 million would need to work 10 hour days 5 days a week to put that much extra work in place. Well, BLS reports hours worked changed by less than 1 hour/week.So, it wasn’t accomplished with added jobs and it wasn’t accomplished with overtime.
Some regular readers here could probably point back to a half dozen articles over the last few years in which I describe nonres bldgs volume levels had dropped but jobs had not. I mentioned before that existing jobs could and probably would absorb some of the growth. That could occur if there were a need to backfill volume to support the existing workforce.
The forecast for Nonresidential Buildings spending in 2023 is +20%. After 6% inflation, volume is forecast +14%. Jobs will not increase by 14%. Jobs have never increased more than 5% and normal is 3.5%. A 14% increase is equivalent to 500,000 jobs, just to support the growth in nonres bldgs. 500,000 jobs is double the normal annual rate of growth for all construction jobs. Nonres Bldgs is is only 33% of all construction
So the questions for the forecaster are these, 1) do we break the mold for construction jobs growth and add half a million jobs, and exceed all known indicators on construction jobs growth?, 2) Will volume vs jobs grow similar to the previous year, volume up 14% and jobs up 3.5%?, or 3) Does nonres bldgs volume growth slow down to a rate of growth more in-line with jobs growth?
I’m heavily leaning to #2, volume will exceed jobs growth. Some of the added work in the near future will be absorbed by the current workforce, but the workforce has already absorbed a great deal in the past year. Also I do think I’m partly leaning towards #3, volume growth will slow to less than currently predicted, although not nearly to the low level of historical jobs growth. I don’t expect jobs growth to exceed historical maximum of 5% annually, 175,000 nonres bldgs jobs. I do expect volume growth will exceed jobs growth, but by much less than in this past year. I do expect to extend the forecast spending out to a further date.

2023 Construction Volume Growth
Construction volume is spending minus inflation. If we want to know whether business is growing, we need to look at spending without inflation, or volume of business.
Volume is what dictates the need for jobs.
If an apple this yr cost 50c, and last yr it cost 40c, the revenue changing hands has gone up 10c or 25%. Volume of business changing hands has not changed, it’s still only one apple.
Inflation adds nothing to the volume of business.
For 2021 and 2022, total construction spending increased 8.5% and 10.6%. But, inflation was 11% and 15%. In both years, inflation was higher than spending. First, subtract inflation from the total spending. That’s gives the dollar amounts for the Spending w/o Inflation Current $ table. Then volume growth can be compared year to year. Volume growth calculation is Vol this yr/Vol last yr, but first, it is dependent on each individual year spending minus inflation.

Volume each individual year is calculated as spending minus inflation. But growth in Volume from yr to yr is Vol this yr/Vol last yr., so is often different than growth in spending.
The volume of construction work completed in 2021 ($1.467tril) is 11% (avg inflation 2021 less than 2021 spending ($1.626tril)
The volume of work completed in 2022 ($1.574tril) is 15% less than 2022 spending ($1.798tril)
So, while Spending growth is 1.798/1.626 = 10.6%, Volume growth is 1.572/1.467= 7.2%.
The table above shows Current Spending and Current Volume. It is not indexed to a common point in time. The table below is Constant Spending which represents Volume indexed to a point in time, in this case 2019. The percent change year to year is what is plotted in charts below.
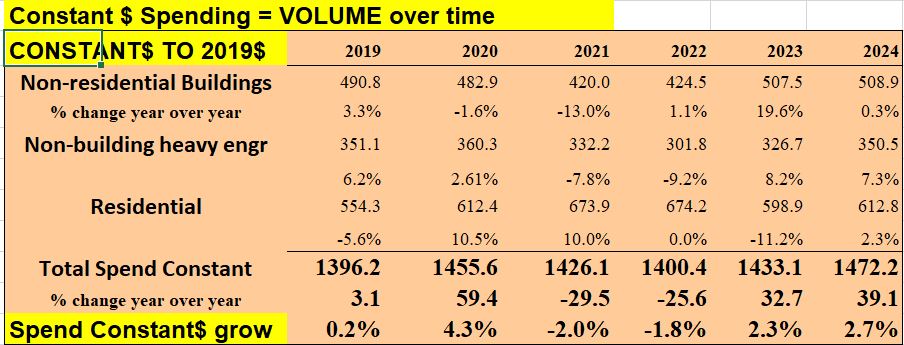
All the plots below show spending, volume and jobs. Current $ in 2010 are not the same as current $ in 2023, so all $ are indexed to the same constant point in time, constant $, so they can be compared. Constant $ then shows the cumulative growth from that point in time.
This plot shows the cumulative change in Total All Spending, Volume and Jobs since Jan. 1, 2020. From 2019 to 2022, Spending is up 29%, Volume is up only 18% and Jobs are up only about 2%. Below are plots that show the differences in jobs and volume growth for each sector.

Residential 2022 spending is = $900bil. Inflation is 15%. Without inflation, residential volume is up $780bil. Residential spending in 2023 is forecast at $850bil. If residential inflation for 2023 comes in low, say at 4%, then w/o inflation residential volume in 2023 would be $820bil. 2023 spending would be 6% lower than 2022, but volume is 5% higher. All due to the huge bite that 15% inflation took out of 2022 spending.


Recently, residential jobs have been holding relatively close to volume. In 2019 and 2022 they were even. That is not the case for the rest of construction.
Nonresidential Buildings and Non-building Infrastructure constant $ volume since Jan. 2020 is down about 15%. Note how jobs dropped about 5%. This, not residential, is what is driving the deficit of volume shown in the Total All plot above. The major growth forecast in Nonres Bldgs and Non-bldg in 2023 and 2024 should help offset some of the difference.
Both Nonres Bldgs and Non-bldg have (or had) a very large number of jobs not supported by volume. This could be contractors holding on to their labor in a slack period so they have the labor when needed. The volume growth in these sectors would indicate a needed jobs growth that far exceeds the ability of the construction industry to add jobs. Those jobs could potentially absorb a lot of the anticipated growth in the spending forecast.


The current excess of jobs could absorb a lot of the volume growth. In 2020-2021, jobs increased about 2% but volume of work decreased 20% to 25%. These should move in tandem, not in opposition. The data counters the narrative of jobs shortages. In these two sectors, jobs had reached the highest ever excess jobs over volume. This does not address the alternative, skills shortages. But the data seems to indicate there could be a lot of bodies that could take on a large amount of growth in the volume of work.
From Q4’21 to Q1’23, Nonres Bldgs volume increased 25%, $100 billion. Nonres Bldgs jobs increased 4%, 140,000 jobs. A $100 billion add in one year is equivalent need to 500,000 jobs, and yet the workforce added only 140,000 jobs. The rest of the work was absorbed by the current workforce. I expect the volume growth over the next two years will increase much faster than jobs growth. That would be very good for the construction industry.

The volume growth in these sectors would indicate a needed jobs growth that far exceeds the ability of the construction industry to add jobs. The most jobs ever added in the last 50 years is just over 400,000. The average jobs added in the last 12 years is 225,000 (excluding the 230k lost in 2020) and the most in one year in the last 12 years is 320,000. It’s reasonable to assume the industry can add 300,000 to 400,000 jobs a year.
We either accept that we can’t add enough jobs to support increasing the workload by that much or we can’t add the anticipated workload in the forecast.
If we accept the forecast volume growth over the next two years, we simply could not add enough jobs in one or even two years to accommodate all the volume of work forecast. Both the Nonres Bldgs and Non-bldg plots above show a steep incline in the volume of work added, but not nearly as steep an incline in the number of jobs added. This can be correct only if a large percentage of the work added is absorbed by the current workforce. The alternative is that much work can’t be added that fast.
2023 volume growth is $250 billion, mostly nonresidential buildings. It takes 5000 jobs a year to put-in-place $1 billion. Forecasting that growth is put-in-place over 2 to 3 years, that’s about $100 billion/year. That’s 500,000 jobs for 2 to 3 years, which means there is too much work added in a year. My current forecast does not reduce for this, yet.
An extension of this discussion is here The Next Forecast Challenge

Infrastructure Construction Expansion – Not So Fast
Only once in 25 years have heavy engineering construction jobs increased more than 5% in one year (7.5% in 2018, 72,000 new jobs). Most of the time jobs growth is under 4% (40,000 jobs). Average growth the last 12 years (see notes below) is near 3% or 30,000 jobs per year.
U. S. Bureau of Labor Statistics (BLS) national data shows there are currently 1,078,000 Heavy Engineering jobs. In 2019 there were 1,084,000. There was a loss of nearly 100,000 heavy engineering jobs in early 2020 due to the onset of the pandemic. In 2022, heavy engineering jobs have been nearly constant, just above 1,070,000 the entire year.
Highway/Bridge comprises approximately 30% of all heavy engineering spending, so supports about 300,000 jobs per year.
The current forecast for new construction starts has increased the forecast for spending growth dramatically above previous years. Both starts and spending statistics give an indication of what to expect in the jobs situation. The spending forecast is indicating a need for a large increase in jobs to support the new work. Spending (also consider inflation) is the critical value that determines the need for jobs. Without sufficient jobs, the spending cannot take place. If jobs do not increase to support the forecast spending, the timeline for the spending very likely will get extended.
It takes 400 jobs per year to put in place $100 million of heavy engineering construction in the year. (Some types of work would take 500 jobs, but I’ll work with 400 here). A construction program that hypothetically adds $1 billion of new construction starts in a year would see that work put in place (for Highway work) approximately over the next few years at a ratio similar to a 15:30:35:20 schedule, $150 million the 1st year, $300 million the 2nd year, $350 million the 3rd year and $200 million in the 4th and 5th years. To support $150 million growth in the 1st year would require 600 new jobs. To support an increase of $1 billion in spending in one year would require 4,000 new jobs.
How will the average growth in jobs affect the growth in new starts and forecast spending?

Modeling the new starts forecast, based on the spending schedule outlined above, projects the spending forecast for Highway/Bridge work over the next few years will increase by $15 billion/year. This would indicate a need to add 15 x 4,000 = 60,000 new highway construction jobs each year in 2023, 2024 and 2025. But the entire heavy engineering jobs pool has increased by that amount only once in 25 years and average growth for all heavy engineering jobs is only 20,000 jobs/year. If we take out 2020, when jobs plummeted, the average growth from 2011 to 2022 was 30,000 heavy engineering jobs per year. Keep in mind, highway is only 30% (6,000 to 9,000) of those averages. This indicates it will be very difficult to support spending growth of this magnitude. While the starts projections and resulting spending forecast indicate rapid growth, this market sector has never experienced spending or jobs growth this fast and it is likely that growth will be slower than indicated.
Some of this added work will be absorbed into the existing workforce, backfilling a large deficit in business volume. See this short post Construction Spending – Volume – Jobs Since the Pandemic, nonbuilding construction volume (spending minus inflation) is down 20%, but nonbuilding jobs are down only 1.5%. Compared to 2019, nonresidential construction has an 18% business volume deficit. In other words, Nonres construction in 2022 now has 18% more jobs per volume of work put-in-place than it did in 2019. Total all construction business volume in that period is down 10% while jobs are up 1.5%.
Aside from backfilling volume of work, this shows a shortfall of workers that would likely be needed to support the increased workload. The labor force is insufficient to accommodate that large an annual increase in spending. This could result in one or more of these outcomes: either the workforce must somehow increase faster, or the project spending could slow and duration would get extended, which is more likely.
Jobs shortfall to support 2022-2026 spending identifies unsupported need. If jobs cannot be filled, annual spending will be lower and construction timeline would get extended.
Currently, national construction unemployment rate is near or under 4%. That is an extremely tight jobs market, not an easy growth situation. Typically, when unemployment is in the 6% to 8% range there are workers on the sidelines ready to go right back to work. Unemployment seldom falls below 5%. The current jobs situation and unemployment rate seems to indicate there are few workers ready and available to support an immediate increased workload. This adds to the difficulty of expanding the workforce at a rapid rate.
In this analysis, the potential rate of jobs growth and the current unemployment rate both suggest that the projected rate of spending growth would not be supported. A slower rate of spending leads back to reducing starts.
See Also Burning Questions – Recession, Labor, Infrastructure

Construction Spending – Volume – Jobs
12-3-22
This plot is not showing good performance. Volume and jobs should be moving directly in tandem. When inflation is very high, spending climbs rapidly. But most of the climb is just due to inflation. To find out what’s really going on we need to look at business volume. Take out the inflation $.
Business volume = Spending minus Inflation. Inflation adds nothing to business volume. Inflation adds only to the amount of revenue that changes hands.
In 2022, residential spending is up 16%. Sounds great, homebuilder’s revenues are up 16%. It’s great until you note that residential inflation for 2022 is 15%. Real residential business volume for 2022 increased only 1%.
Since Jan.2020 spending is up 20%. Revenues are up 20%. It’s pretty hard to not think you need additional staff to support 20% growth in revenues. But inflation is 30%. Take out the inflation dollars and we find that volume is DOWN 10%. Well, during that time, jobs increased 1 to 2%. And yet, business volume is down 10%. That’s a massive 11%-12% loss in productivity. With labor being about 35% of the total cost of a job, that’s added about 4% to total inflation.
I recently read an article that stated (attributed to Assoc. Bldrs. & Contractors) that the construction industry needs to add 1,000,000 jobs over the next two years. Here’s why that won’t happen:
1) The construction industry has never added more than 440,000 jobs in one year. It’s only gone over 400,000 four times in 50 years, the last time 2005, and never two years in a row. The most construction jobs added in a year since 2011 is 360,000 in 2014. The average growth rate from 2011 thru 2019, and now also in 2022, is 230,000 jobs per year. The most jobs added in any two consecutive years is just over 700,000 in 1998-99 and 2005-06. So, the construction industry may not have the capacity to grow 1,000,000 jobs even in two years.
2) Since the Pandemic, nonresidential construction volume is down 20%, but nonresidential jobs are down only 1.5%. Compared to 2019, nonresidential construction has an 18% business volume deficit. In other words, Nonres construction in 2022 now has 18% more jobs per volume of work put-in-place than it did in 2019. Total ALL construction business volume in that period is down 10% while jobs are up 1.5%.
3) Inflation is playing a key roll here. In 2022, construction spending is increasing $160 billion or 10%. But inflation is 13%. Real total construction business volume in 2022 is down 3%. Jobs are up. For 2023, spending is forecast to gain $80 billion, 4.6%, but after inflation volume will be down 1%. 2023 numbers are driven down by residential.
4) In 2023, nonresidential volume increases $35 to $40 billion. Residential volume drops $50 billion. It takes 4000 to 5000 jobs to put-in-place $1 billion of volume in one year. Nonbuilding and nonresidential buildings growth of $40 billion would need 160,000 to 200,000 new jobs. Some small amount of that will come from the drop in residential. But, go back and read #2 again.
Since Jan 2020, the construction industry as a whole has nearly +175,000 (+2%) more workers to put-in-place -$175 billion (-10%) LESS volume. That’s a huge loss to productivity that may take years to recover, if ever.


Construction Briefs Nov’22
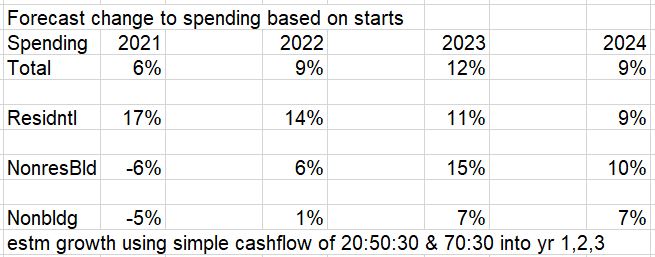
Construction is Booming. Well, OK, construction is setting up to be booming in 2023-2024. New construction starts for Sept are down 19% from August and yet starts are still near the highest levels ever. Sept is 4th highest total starts ever, all four of the highest ever months of new starts are in 2022. July and Aug were the two highest months of new starts ever. Total growth in starts over 2021-2022 > Nonres Bldgs +50%, Nonbldg Infra +40%, Residential (all in ’21) +22%.
STARTS

Construction Spending will not be participating in a 2023 recession. Except, residential might. Residential starts in 2021 were up +21% to a really high new high. But starts are forecast flat in 2022 and 2023. Spending grew 44% in the last 2yrs, but inflation was 30% of that 44%. With zero growth in starts forecast for 22-23, spending struggles to keep up with inflation. Residential will post only an increase of 3% in 2023 spending, but midyear there is potential for 6 consecutive down months.
See also Construction Year-End Spending Forecast Dec’22
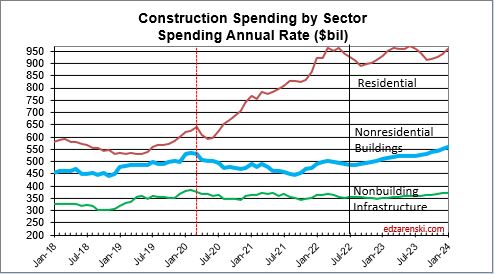
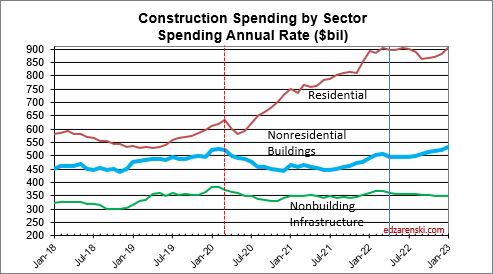
SPENDING BY SECTOR CURRENT $ AND INFLATION ADJUSTED CONSTANT $


Nonresidential Buildings new starts last 2yrs (2021-2022) are up 50%. Spending next 2yrs (23-24) is forecast up 21%.
Nonbldg starts 2022-23 are forecast up 38%. Spending 2023-24 forecast up 20%.
In 2023, it’s Nonresidential Buildings leading growth. In 2024, it will be Nonbuilding Infrastructure leading spending growth. Both are expected to grow more than the inflation index, so there will be real volume growth to report.
Residential construction (Dodge) starts since Jan 2021 have posted 17 out of 21 months of the highest residential starts ever posted. The 5 highest months ever are all in 2022.
Nonresidential Bldgs starts in Sept dropped 23% from August and yet still that was the 3rd highest month ever. July and August were 2nd and 1st.
Construction starts for Nonresidential Bldgs posted each of the last 4 (consecutive) months thru October higher than any months ever before. The avg of last 4 (consecutive) months is 33% higher than the avg of the best previous 4 mo ever (even non-consecutive). Growth in Manufacturing construction starts for 2022 far surpasses growth in any other market, up over 150% year-to-date.
Construction Spending Sept total up 0.2% from Aug. Aug & Jul were revised up 1.1% & 1.3%. Total spending YTD thru Sept’22 is up 11.4% from Sept’21. MAJOR movers; Mnfg up 16% since Jun. Jul & Aug were revised up 7.4% & 8.4%. Highway is up 9% since June. Jul & Aug were revised up by 4.0% & 4.4%.
SPENDING FORECAST

Total construction spending for 2022 is on track to increase +11.1%. Residential +16.8%, Nonres Bldgs +9.5%, Nonbldg +0.5%.
Comm/Rtl +18% Mnfg +32% Power -8% Pub Utilities +14%.
Current and predicted Inflation SEE Construction Inflation at Year-End 2022
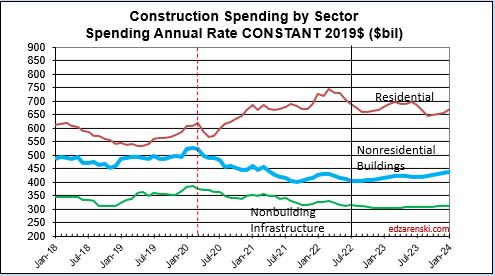
Inflation adjusted volume is spending minus inflation.
Total volume for 2022 falls 1%. Rsdn +3%, Nonres Bldgs -1%, Nonbldg -9%.
Total volume for 2023 is up 1%. Rsdn -3%, Nonres Bldgs +8%, Nonbldg +2%.
SPENDING TOTAL ALL $ CURRENT $ AND INFLATION ADJUSTED CONSTANT $
Overall Construction Spending is up 15% since the onset of the pandemic, but, after adjusting for 25% inflation, volume is down 10%. Residential jobs are near even on track with volume, but Nonres and Nonbldg have volume deficits of approx 20-25% vs jobs.
- Feb 2020 to Aug 2022
- Resdn spend +42%, vol +6.5%, jobs +7%
- Nonres Bldgs spend -8%, vol -24%, jobs -3%
- NonBldg spend -7.5%, vol -24%, jobs +1%
JOBS VS CONSTRUCTION VOLUME VS SPENDING (VOL = SPENDING MINUS INFLATION

Labor Shortage? Jobs should track volume, not spending growth. Vol = spending minus inflation. Volume is down while jobs are up. If the same production levels ($ put-in-place per worker) as 2019 were to be regained, theoretically, nonresidential volume would need to increase 20% with no increase in nonresidential jobs. I don’t expect that to occur, therefore, productivity will remain well below that of 2019.
LABOR PRODUCTIVITY

Over the next year or two, there could be several billion$ of construction spending to repair hurricane damaged homes in Florida. That spending will NOT be reported in Census spending reports. Renovations to repair natural disaster damage are not recorded in construction spending. Construction spending to replace homes entirely lost to damage IS reported in Census spending, but is reported as renovations/repair, not new SF or MF construction.
RESIDENTIAL SPENDING SF-MF-RENO CURRENT $ AND CONSTANT $


Construction Jobs and Inflation
Construction jobs through August 2022 increased to 1.1% above the pre-pandemic high in Q1’20. Factoring in hours worked, we find that is reduced slightly to show jobs x hours worked for August 2022 is 0.4% lower than the peak in Q1 2020. Most anyone would say jobs have returned to the pre-pandemic high.
Construction spending through July is 14.3% higher than the pre-pandemic high in Q1’20. BUT INFLATION through July is 23% higher than pre-pandemic Q1’20. Therefore real construction volume (spending minus inflation) is currently 7% BELOW the pre-pandemic high in Q1 2020.
Jobs are up, but volume is down.
So, when you read that jobs are back to pre-pandemic levels, maybe that’s not as great as you might think. Sure more people are back to work, but has the volume of work needed to support those jobs increased sufficiently?
Inflation hides a lot of reality. We now produce 7% less volume of work put-in-place with 1.1% more workers putting in 0.4% less hours than before. That’s a huge construction productivity loss, down 6.6% in the last 30 months. Where does that productivity loss show up in the data?
Here’s the plot of actual and forecast CONSTRUCTION SPENDING. Compare this to the next plot.
Here’s the plot of actual and forecast CONSTRUCTION SPENDING ADJUSTED FOR INLATION.
Notice, Residential volume is up 11% since Q1 2020, but nonresidential buildings volume is still down 23% and non-building volume is down 18%.
Let’s say construction labor is 35% of total construction cost. If wages go up by 5%, then total cost goes up by 5%x35% = 1.75%. Well, if productivity declines by 6.6%, labor cost goes UP by 6.6%x35% = 2.3%.
That’s the inflation cost. Here’s a look Behind the Headlines. These two plots show the number of jobs required to put-in-place $1 billion of volume (inflation adjusted spending) or the inverse, the amount of volume put-in-place by one job in one year.


It’s great that jobs are coming back, but don’t overlook the cost that has added to inflation. Don’t expect to see a lot of improvement over the next 12 months. In fact, if jobs continue to grow at the current rate (or any rate for that matter), this time next year the imbalance is worse.

Burning Questions – Recession, Labor, Infrastructure
I gave two conference presentations in the past month. The most pressing questions from the audience were:
Are we headed into a recession? When will recession start?
What can be done about the labor shortage?
How can we support all the infrastructure work that is about to begin?
RECESSION
There is no question the sizable drop in starts in 2020 lead to a downturn in construction spending, mostly felt in 2021, but extending somewhat into 2022. However, this quickly turned around for residential spending and nonres bldgs spending is now past the low point caused by the pandemic initiated slowdown. With new construction starts to date at all-time highs and the forecast for new construction starts in the pipeline, it’s hard to envision how this would lead to a construction recession.
- In 2021, new starts increased 17%. Residential +21%, Nonres Bldgs +15% and Nonbldg +9%.
- In 2022, new starts are forecast up 11%. Residential +10%, Nonres Bldgs +18% and Nonbldg +4%.
- In 2023, new starts are forecast up 10%. Residential +12%, Nonres Bldgs +7% and Nonbldg +11%.
Total of all starts year-to-date in 2022 are up 6% over Jan-May 2021. Nonres bldgs starts are up 17% year-to-date. For the past 6 months, Dec’21 to May’22, residential construction starts posted 5 of the 6 highest months ever. The 6mo total for residential starts is the highest 6mo total ever recorded, up 4% over the previous 6mo record, posted in 2021.
Residential new starts get spent at a ratio of 70:30. Nonresidential Bldgs spending from new starts, on average, gets spent over the next 3 years in the ratio of 20:50:30. That is, 20% of spending from all starts within the year gets spent within the year started, 50% gets spent in the following year and 30% gets spent in the 3rd and sometimes 4th year. So from this we can say, if new starts are up 10% for the year then spending from that source will increase 10% x 20% or 2% the 1st year, 10% x 50%, 5% the 2nd year and 10% x 30%, 3% the 3rd year. If we get 3 consecutive years of growth in new starts there would be no downward pressure on spending for the next 3 to 4 years.
In the 2nd half of 2021, residential starts, although still strong, posted a few lower monthly totals. Although 2022 spending will still finish the year up, these lower monthly starts from late 2021 will work to cause a slight spending dip in the 2nd half of 2022. Nonresidential Bldgs spending is slowly increasing in 2nd half 2022. Nonbldg spending is flat or very slowly decreasing. The net effect is spending will post a decline in 4 of the next 8 months of 2022, but the total declines may not result in 2 consecutive quarters of declines. By the time we head into 2023, all three major construction sectors are in a growth pattern.
So, we will see a few months of spending declines, but the new starts pool of work is growing, not decreasing. The current forecast model is predicting no recession on the horizon.
LABOR SHORTAGE
This next plot shows labor and volume of work (spending minus inflation) to support that labor growing equally, albeit with short-term peaks and troughs, from 2011 to 2018. In fact, this equal growth extends far back with only few years causing exception to this pattern. This plot, and the extension of this plot to older data, shows that normally, labor increases at the same rate as volume. You can see that 2018 posted a significant drop in volume while jobs continued to increase. This departure had nearly corrected itself by Jan 2020.
The most recent construction spending report, issued July 1, revised unadjusted spending data for 2020 and 2021, both years added $30+bil. That brought volume up those years on this plot. The current spread between jobs and volume of work is still 10%.
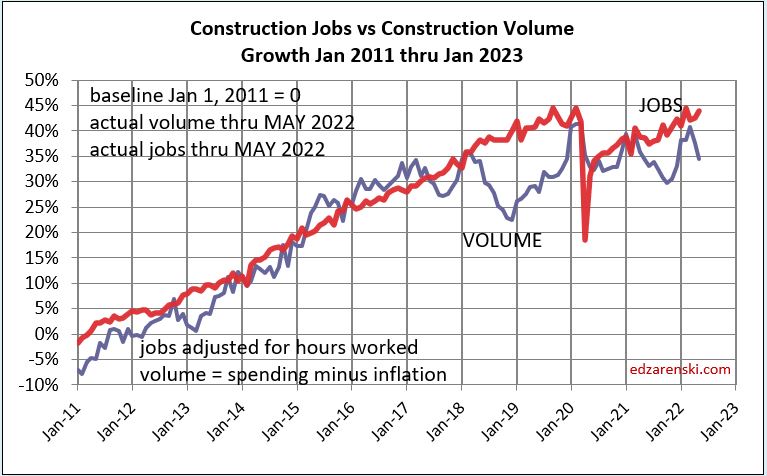
In May of 2020, jobs were already on the rebound, but the volume of work was not. Work volume did recover some at the end of 2020 but then fell again, as was predicted, into mid-2021. In May of 2020, jobs and the volume of work were near balance. Since May of 2020, spending increased by 22%, but most of that was inflation. Since May 2020, actual work volume increased by only 1.5%. Jobs increased by 9%.
The last time the normal jobs/volume growth pattern was disrupted like this was 2006, the only other time in the last 25 years this occurred.
Volume, not spending, supports jobs. If volume is down, support for more jobs drops. If jobs increase while volume is declining then productivity is declining and the number of jobs required to put-in-place $1 billion of construction volume increases. At the same time, the inverse, the amount of volume put-in-place per job, decreases. This productivity loss drives up construction labor cost inflation and the need for additional labor to complete the job.

edited/added 8-6-22 Where the construction jobs are:
From Feb 2020 to Jul 2022 Nonres Bldgs and Nonbldg jobs are down 3.5% and 1.5%. Volume of work is down 20%.
Residential jobs are up 6.5%. Rsdn volume is up 14%.
It’s not quite that bad in either sector because some workers classified and counted as nonresidential perform work in the residential sector.
Total jobs up 1%. Total volume down 7%. That’s a slip of 8% in productivity. If labor is only 30% of total construction cost, an 8% slip in productivity is a 2.4% increase in inflation. That’s in addition to changes in wages.
INFRASTRUCTURE
The current administration has approved an infrastructure spending bill that earmarks approximately $500 billion for construction spending. It will take several years to start all this work.
The infrastructure spending bill may fund construction for a variety of buildings and non-building types of construction, for example, highway, water and sewer, educational, healthcare, etc. Rather than strictly classified as infrastructure, or as commonly referred to as nonbuilding construction, this bill will fund some forms of buildings and non-building construction in the public construction sector.
The total of all public construction is only 25% of all construction. This subset of construction totals about $360 billion in annual construction spending. It has never increased by more than $37 billion in spending ($35 billion in volume) in a year. Average growth is closer to $10-$15 billion/year. This public sector of construction does not have the capacity to increase by $100 billion/year.
As you can see in the plot above, it takes about 5000 jobs to support $1 billion of volume for 1 year. So, increasing volume by $35 billion in one year would require 35 x 5000 = 175,000 new jobs for that year. Keep in mind, this is to support a subset of construction that is only 25% of all construction.
Jobs rarely (4 out of 50 yrs) increase by more than 400,000 in one year for all construction. Even taking out the 13 years when jobs dropped, the average jobs growth for the past 50 years is only 220,000/year for all construction. That would seem to indicate the average growth for the public sector, at 25% of all construction, averages only 55,000 jobs/year.
Total all construction for the three years 2022-2023-2024 is forecast to increase $140 billion, $117 billion and $116 billion. The remaining 75% of the construction industry still adds a lot of demand for growth and jobs beyond just that of the public sector that gets a boost from the infrastructure bill. But after adjusting for inflation, the growth in volume over this three-year period is only about $120 billion. That would generate a need to create 600,000 new jobs over the next three years. About 25% of those jobs support the infrastructure funded growth.
If the infrastructure spending bill adds $35-$40 billion/year in spending, $30-$35 billion/year in volume, the need would be 150,000 to 175,000 jobs/year to support that 25% of the construction industry. Since it is unlikely the public sector of construction could add that many jobs, it is more likely the amount of construction spending added yearly will be somewhat lower.
Infrastructure has a slower spending curve than the 20:50:30 for nonres bldgs, roughly more like 15:40:30:15. If $100 bil of new contract awards start in 2022 then spending would be $15 bil in 2022, $40 bil in 2023, etc.. At $100 bil of new starts per year, the highest one-year growth would be $40 bil, probably double the pace the sector can grow.

Construction Jobs and Spending Briefs 4-1-22
Construction Jobs report for Mar 2022 shows total jobs up 19,000 from Feb
Rsdn jobs +7,600, Nonres Bldgs +6,300, Civil +5,000
Although construction jobs increased by 19,000 in March, total hours worked dropped by 1.8% from Feb, so total workforce output is down.
It’s real hard to compare construction jobs growth by sector. If you work for a concrete firm or structural steel firm, with firm doing primarily nonresidential work, but you are out there putting in concrete or steel for a high-rise multifamily buildings, your job is still classified as nonresidential.
Jobs are up 82,000 year-to-date, 1.1% from Dec, but that’s also up 3.5% from ytd 2021. With the latest quarter at +1.1%, jobs are increasing at a rate of 4%/year. But inflation adjusted spending, building activity, is expected up only 2.5% in 2022, after dropping -2% in 2021. Jobs increased 2.5% in 2021.
2022 spending started the year at the highpoint. I expect a slow decline in monthly spending in all sectors of 2% over the 2nd half. That provides no support for jobs growth.
Construction jobs have nearly returned to pre-pandemic levels. The problem with construction jobs having returned to pre-pandemic levels is the level of inflation adjusted construction volume of activity that is needed to support those jobs is still 5% below Feb 2020 and 13% below the 2006 peak. So since Feb 2020, jobs are back to that level, but volume is not so productivity has dropped by 5%.
Construction Spending is up +10.4% year-to-date (in 2 months!) mostly driven by +15.5% ytd Residential.
A plot of residential construction spending inflation adjusted. Taking out inflation shows volume of building activity. Perhaps the trend in residential is strong enough to keep going.

Total spending is up +4% in 3mo since Nov 2021 (and 10% ytd-2mo), but I don’t expect this rate of growth to hold. However, this and any other changed data inputs revises my 2022 spending forecast.
Examples of big changes since initial forecast:
Manufacturing spending has increased so much in Jan-Feb, (up 35% ytd) that even if the next 10 months finish flat year/year, Mnfg will still finish up 5% for 2022.
Residential new starts for the latest 3 mo, Dec-Jan-Feb, avg is as high as any quarter last year. Nearly all of this spending occurs in 2022.

Construction buildings cost inflation over the last 4 years is up 25%. Labor cost, wages up 15% & productivity down 7%, is up 22%. But labor is 35% of total building cost so 22% x 35% = labor is 8% of that total 25% building cost inflation. Fully 1/3 of construction inflation over last 4 years went into workers pockets.
