Home » Non-Bldg Infrastructure (Page 3)
Category Archives: Non-Bldg Infrastructure
Infrastructure & Public Construction Spending
3-5-17
Infrastructure work does not normally grow in leaps and bounds.
Seldom does infrastructure construction spending grow by more than $10 billion in a year. Rarely does it grow by more than $20 billion.
Currently at about $300 billion a year, infrastructure represents only about 25% of all construction spending. The infrastructure sector is comprised of the longest duration type projects such as energy, highway/bridge, transportation terminals, railway and water/waste water resource development. It is not unusual for projects to take four to five years to reach completion.
Increasing new construction starts by $40 billion for new infrastructure work in any given year on average might add only $8 to $10 billion in spending in each of the next four or five years. To increase spending by $10 billion a year we would need to increase new starts by $40 billion every year. We’ve only ever come close to adding $40 billion in new starts once, in 2015.
In 2015, new infrastructure starts increased by $38 billion or 27%, due to an increase of $13 billion in new power generation plants and an increase of $21 billion in new LNG plants and port facilities. That will keep infrastructure spending growth elevated throughout 2018 and 2019. Measuring a total increase of 250% in power projects, that is a scenario unlikely to be duplicated in coming years.
2017 spending comes from: 10% 2014 starts; 35% 2015; 35% 2016 and 20% new starts in 2017.
Although new infrastructure starts were down in 2016 and are expected to decline again in 2017, the amount of work in backlog at the start of 2017 is the highest its ever been and spending in 2017 is forecast near the all-time (2015) high. Spending in 2018 from backlog will increase again and 2018 will hit another all-time high. There are no annual declines in spending predicted for the next four years. Some very large public infrastructure projects that started in 2014, 2015 and 2016 still contribute large amounts to spending in 2017 and well into 2018.
Increasing infrastructure spending by $10 billion a year would require adding about 35,000 to 40,000 new construction jobs per year. To accommodate all growth since the recession bottom, this sector averaged adding only 20,000 new jobs per year. Current spending growth is predicted to add $40 billion in work over the next three years and this will absorb all new heavy engineering jobs growth. The non-building infrastructure sector does not have the capacity at this time to increase spending by another $10 billion/year over its current growth rate, nor does it have the capacity to add an additional 40,000 jobs per year.
This summary of current projected spending does not include any future infrastructure work that might be generated from a proposed $1 trillion spending plan.
It is important to note here that 90% of all work in the power sector is private work. Only 60% of infrastructure work is publicly funded. However, some nonresidential building is publicly funded.

Public spending is not all public works projects.
Most public work is infrastructure, or public works projects. However, not all infrastructure is public work. The power market is the largest infrastructure market. But, already noted above, power work is mostly private. So the market responsible for one third of all infrastructure work is 90% private. Educational projects, typically considered nonresidential buildings, are 80% public and 20% private.

The two largest markets contributing to public spending are highway/bridge (32%) and educational (25%), together accounting for 57% of all public spending. The next largest market, transportation, is only about 10% of public spending.
Highway/bridge work fluctuates the most with large monthly swings up or down. However, 4 out of 5 times over the last 12 years, any large monthly move up or down was accompanied by a partially offsetting opposite move the following month. Highway spending hit an all-time high in 2015 and again in 2016.
Two of the three largest annual growth increases ever recorded in public spending were driven by educational spending. In the third largest growth year, highway just barely edged out educational spending for the top spot.
If educational work were to be considered part of future infrastructure expansion, then the maximum capacity to increase public infrastructure spending obviously increases. Together with other public works projects this could potentially provide a large enough market base to increase public infrastructure spending by $10 billion a year over and above the growth already in backlog or anticipated. But most of the added work would need to be to the education market. Even with potentially adding educational market work to the infrastructure expansion plan, the hope of expanding infrastructure spending by another $10 billion/year remains difficult at best.
Any increase to future work needs to be considered as over and above the spending growth patterns already due to work in backlog and new starts anticipated. This plot of predicted public spending does not include any future infrastructure work that might be generated from a proposed $1 trillion spending plan. About 80% of all spending in 2017 is already in backlog. About 50% of all the spending from Jan. 2018 through Jan. 2020 will already be in backlog by Jan. 2018.

The following article is an extension of this discussion Calls for Infrastructure Problematic
Infrastructure – Ramping Up to Add $1 trillion
1-30-17
How long would it take to accommodate adding $1 trillion of new infrastructure construction spending?
I read this in another recent article on the topic; “If passed, the ripple effect of an estimated $100 billion a year in new infrastructure construction would undoubtedly be felt throughout the industry.”
The article seems to imply the industry could absorb $100 billion in new infrastructure work and maintain that $100 billion added spending for 10 years. The infrastructure sector could not accommodate that massive amount of instantaneous growth. Let’s look at maximum historical rates of growth to understand why.

To really understand construction growth rates we need to look at all historical spending in constant dollars (inflation adjusted).All constant dollars in this analysis are converted to 2016$.The following spending historical data goes back to 1993. Jobs data goes back to 1970.
- Construction Industry total spending fastest rates of growth:
- Maximum growth one year, 2015, +$107 billion, in 2016$= $87 billion
- 2011 – 2015, 4 yrs, +$324 billion, in 2016$ = +$240 billion = $60bil/yr.
- 1995 to 1999, 4 yrs, +$200 billion, in 2016$ = +$200 billion = $50bil/yr.
- Infrastructure Sector spending fastest rates of growth:
- Maximum growth one year, 2007, +$40 billion, in 2016$= $36 billion
- 2005 – 2008, 3 yrs, +$87 billion, in 2016$ = +$52 billion = $17bil/yr.
- 1997 – 2001, 4 yrs, +$50 billion, in 2016$ = +$46 billion = $15bil/yr.
- Construction Industry Jobs fastest rates of growth:
- Maximum growth one year, 1999, 397,000 jobs
- 4 years from 1995 to 1999, average 317,000 jobs/year.
- 3 years from 2012 to 2015, average 266,000 jobs/year.
- Infrastructure Sector Jobs fastest rates of growth:
- Maximum growth one year, 2004, 65,000 jobs
- 3 years from 2003 to 2006, average 48,000 jobs/year
- 3 years from 2011 to 2014, average 26,000 jobs/year
The fastest one-year growth for the entire construction industry is $87 billion in 2015, but the fastest growth rate is never maintained for long. The period 2011-2015 is the highest average rate of growth at $60 billion/year. The entire industry has had jobs growth of more than 300,000/year only 6 times since 1970. 1995 to 1999 is the only period to average over 300,000 jobs/year longer than 2 years.
Infrastructure is only 25% of all construction work. The entire construction industry best growth rate ever achieved (in 2016$) absorbed $1 trillion in new spending over 5 years. Infrastructure has not absorbed $1 trillion newly added work in 25 years. The fastest one-year growth for the Infrastructure sector is $36 billion in 2007, but the highest average rate of growth is $17 billion/year. The current rate of growth since the recession is $10 billion/year.
The infrastructure sector has had jobs growth of more than 40,000/year only 3 times since 1993. Maximum jobs growth hit 65,000 in 2007. The best average jobs growth is 48,000 jobs/year and that has not occurred in the last 10 years. It’s the only period with average growth more than 26,000 jobs.
Let’s assume the fastest rates of growth can be duplicated once again. Let’s also assume that longer term growth will come closer to the long term average highs. So, infrastructure growth might reach $36 billion in a given year but could fall back to an average growth of $17 billion/year. Jobs could grow by 65,000/year but would probably average less than 48,000/year.
However, even with the addition of a new influx of infrastructure work, most of the other growth, which has been fairly constant for the last 25 years, is not going to go away. Since the recession, infrastructure has been increasing at $10 billion/year and jobs have been increasing 20,000/year. Assuming we maintain that level of normal infrastructure growth, then the remainder is what we might expect to accommodate in growth from new infrastructure stimulus.
If we could achieve maximum rates of growth we could increase infrastructure additionally through new stimulus by $26 billion/ year and increase jobs by 45,000/year.
If we could maintain long term best average rates of growth we could increase infrastructure through new stimulus by $7 billion/year and increase jobs by 28,000/year. Even if a portion of the normal growth goes away, it looks like the infrastructure sector could only accommodate adding about $10 billion/year in new stimulus work.
It must be noted that a large portion of infrastructure spending is private work, not publicly funded. Power is 90% private, 10% public. Highway is 100% public. Transportation is 30% private, 70% public. Sewage, Water and Conservation are 100% public. Communication is 100% private.
Fully 35% of all infrastructure work is private. Most of the huge increases in spending over the years are associated with the Power market. So this analysis counters any argument that publicly funded infrastructure can grow much faster. In fact, if only public works were taken into account, spending targets here would need to be reduced by 35% and the total duration to complete would be increased by 50%.
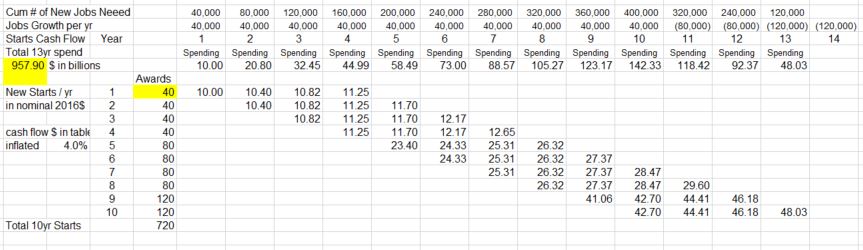
A cash flow schedule of all newly added work provided the plan needed to balance spending. All new work is assumed to take 4 years to complete. In the first year, $40 billion of new work starts, but only $10 billion gets spent. Spending flows at the rate of $10 billion/year for 4 years. New starts are added at a rate to continuously increase spending by $10 billion/year. By the 5th year we need to add $80 billion in new starts to get $20 billion in spending since all of year 1 work is now completed.
This table gives an indication of how cash flows. The full 13 year table is below.

I have assumed that inflation will add 4%/year to future spending. Five years from now the equivalent to adding $10 billion a year will be $12.2 billion a year. Due to inflation, we would spend $1 trillion to build the equivalent of $750 billion in today’s dollars. Increasing spending by the inflation adjusted equivalent of $10 billion per year, it would take 12 to 13 years to spend $1 trillion.
This scenario would push total infrastructure spending to the highest rates of long term growth on record. It’s not very likely growth like that could be sustained for very long. So, it’s possible total growth would fluctuate yet that we still keep our sights on achieving those long term growth rates. This allows for no economic downturn at any time in the next 10 years.
Another restraint to maximum growth rates is jobs. Infrastructure is only 25% of all construction. Maximum all construction jobs growth has exceeded 300,000/year a few times, but infrastructure jobs have increased by more than 40,000 only rarely and only once averaged over 40,000. While it takes about 5,000 to 6,000 workers to put-in-place $1 billion in construction, it takes only about 3,000 to 4,000 workers to put-in-place $1 billion of infrastructure. To reach maximum growth of $36 billion in infrastructure would require 110,000 to 140,000 new jobs per year, two to three times the long term growth. This analysis does not take into consideration any shortfall in jobs due to labor availability.
Setting spending growth to $10 billion/year results in 10 years of continuous record jobs and spending growth. Expectations of increasing infrastructure spending (not to be confused with starts) by $40 billion/year or $50 billion/year have not taken into consideration the maximum sustained growth rates in the industry. Talk of increasing infrastructure spending by $100 billion in a year is fantasizing.
added 2-2-17
In recent reading I came across a comment that both Educational and Health Care markets potentially could be included in Infrastructure funding. I take that to mean the public portion of those markets. Educational could be considered infrastructure and is 80% public ($70/$88bil). I would guess also Public Safety and Public Power could be included. Educational public spending is $70 billion/year. The others are $8 billion each. The short version of all the explanation above is that new infrastructure investment can grow a market at about half of the best total long term average growth of 10%/year. So these markets could absorb growth of about 5% or about $5 billion/year more.

More about Infrastructure written 3-6-17 Calls for Infrastructure Problematic
Infrastructure Outlook 2017 – Construction Spending
1-12-17
2-1-17 Upated to include Decmber data
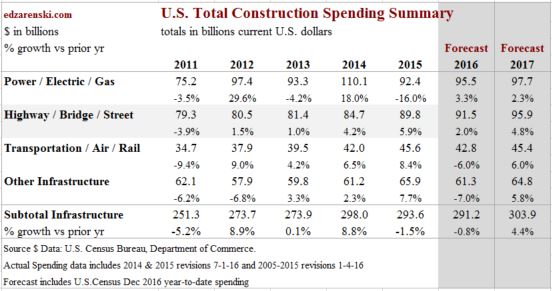
Non-building Infrastructure spending in 2016 will finish at $291 billion, down less than 1% from 2015. Spending based on projected cash flow from Dodge Data Starts predicted this drop. The negative drivers were Transportation, Sewage/Waste Disposal, Communications and Water Supply. Power, the largest infrastructure market at 34% of total sector spending, will finish up 3.3%. Highway/Street, 31% of total sector, will finish up 2%.
In 2017, Non-building Infrastructure, following two down years, will increase by 4.4% to $304 billion, due to growth in the highway and transportation markets. In the most recent quarter spending began to recover from 2016 lows posted in August and September. 2017 will be a record year for Infrastructure spending supported by spending generated from the Fixing America’s Surface Transportation Act and potentially the Water Resources Development Act.
Annual percent growth in new starts (backlog), by itself, is not necessarily a good indicator of spending in the following year. The duration of backlog must be known to forecast spending.
At the beginning of 2016, work in backlog had increased 9% over 2015, but because a large percentage was very long duration work, the amount of cash flow (work put-in-place) in 2016 from that backlog decreased from 2015.
At the beginning of 2017, work in backlog increased only 6% over 2016. What is significant though is that the amount of cash flow in 2017 from that backlog will be up 10%. That is being caused by long duration work-to-complete backlog from 2014 and 2015, which is dominated by spending in the power market. In the 1st five months of 2015, a years worth of Power work started and it’s not yet completed. It’s still contributing to infrastructure spending in 2017.
Although new starts in 2016 will finish down 6% from 2015, starts in 2015 were so strong that 2016 will still be a high volume of new starts. 2015 was up 25% from 2014. So, even though headlines will point to a 6% decline in new infrastructure starts in both 2016 and 2017, due to the distribution of spending from backlog, 2017 spending will post the largest growth in 3 years. 2017 will be a record year for spending on infrastructure, up more than 4% from 2016.
Infrastructure construction starts and spending is dominated by movements in Power and Highway markets. Power/Electric/Gas and Highway/Bridge/Street, about equally, comprise 65% of all infrastructure spending. Transportation/Air/Rail accounts for 15%. Sewage/Waste 8%, Communication 6%, Water 4% and Conservation 3%.
Power is 90% private, 10% public. Highway is 100% public. Transportation is 30% private, 70% public. Sewage, Water and Conservation are 100% public. Communication is 100% private.
Power project starts dropped 25% in 2016 but from the highest annual total of starts on record in 2015. In addition, power had very strong starts in late 2014. All of those very strong starts in late 2014 and all of 2015 are still ongoing in backlog and will contribute to strong spending in 2017. Almost half of all the spending in 2017 is generated from projects that started in 2014 and 2015. Power spending in 2017 will increase 2% over 2016 for a 6th consecutive year of near $100 billion in spending.
Highway/Street, the second largest public market, reached all-time highs in spending from the 3rd quarter 2015 through the 1st quarter 2016. After a 6 month slow down, spending in November again reached a new all-time high. Highway spending in 2017 will grow 5% over 2016.
Transportation hit all-time highs in spending all during the 2nd half of 2015. Spending declined by 6% in 2016 but is still the second highest year on record. It will again equal those 2015 highs throughout all of 2017. Transportation spending in 2017 will grow 6% over 2016.

Projected impact of proposed infrastructure stimulus:
- None of the starts or spending detailed above includes any projections of potential work from future stimulus.
- Infrastructure spending, about 25% of total construction spending, increased more than $25 billion in a single year only once. The average annual growth for the past 20 years is less than $10 billion/year. Although infrastructure growth is always erratic with no growth some years, the average growth for the last six years (post-recession) has averaged $10 billion/year. Some of those years included prior stimulus growth.
- The annual growth in PUBLIC Infrastructure has never exceeding $20 billion in a single year and averages only $7 billion.
- The average growth in infrastructure jobs (excluding all recessionary years because those years would make the result approach zero) is about 25,000 jobs per year.
- Based on infrastructure proportion of all construction, and on both all construction and infrastructure historical maximum rates of spending and jobs growth, it may be unrealistic to anticipate more than $10 billion/year growth in the infrastructure sector. ie., (from current total add $10bil yr1, $20bil yr2, $30bil yr3, etc.) See Infrastructure – Ramping Up to Add $1 trillion for more detailed explanation.
-
Also See Infrastructure & Public Construction Spending
Saturday Morning Thinking Outloud #1 – Infrastructure
10-29-16
Can the construction industry even accommodate adding $1 trillion of new infrastructure spending over 10 years?
It takes about 5000-6000 new jobs to support $1 billion of new construction work for a year. For infrastructure the number is lower. So $100 billion per year continuous for next 10 years would support about 400,000 new jobs for 10 years. Well, that’s not how it will happen, so let’s look a little closer.
- Historically the fastest rate of growth in spending takes about 3 years to increase 50%. That is for selected markets, never for the entire industry.
- Infrastructure spending grew 50% in 4 years from 2004 to 2008, when that sector was half the size what it is today.
- Infrastructure, about 25% of total construction spending, added spending more than $25 billion in a single year only once. The average annual growth for the past 20 years is less than $10 billion/year.
- Historical growth in jobs rarely exceeds 300,000 new jobs per year. It has never averaged that rate of growth for more than a 3 year stretch. That is for the entire industry.
- Spending after inflation (real volume growth) for all construction increased an average of $50 billion per year for the last 4 years. The same is expected in 2017.
- Jobs increased an average of 250,000 per year for the last 4 years.
- We could expect approximately the same growth in volume and jobs in 2018.
So here’s what we know. The entire construction industry has been growing on average at about $50 billion in volume and 250,000 jobs every year in recent data. Even with the addition of a new influx of infrastructure work, most of that other growth is not going to go away. But how much growth can the entire industry accommodate without bursting at the seams. Let’s make some broad assumptions to see what happens.
Let’s assume for the next 10 years the normal rate of new construction growth gets cut in half. In reality it probably wouldn’t, but we need to push some numbers to extremes to see what happens. So normal new volume, not including any boost from new federal infrastructure spending, might only grow at $25 billion per year and that would absorb 100,000-125,000 new jobs per year. That accounts for HALF of the entire industry volume growth and jobs growth. How much room does that leave for new growth or expansion in industry growth rates?
If we fill the difference with work from added new infrastructure spending, we can add $25 billion per year in new infrastructure spending and that will add about 100,000 new jobs per year. To account for how the work might be contracted out, let’s just assume in the first year we commit to $250 billion in contracts that are spread over 10 years to get to $25 billion a year in spending. In the 2nd, 3rd and 4th years we could also commit each time to another $250 billion in 10 year contracts that spread the spending out to $25 billion per year for 10 years.
By year 4, we’ve added $100 billion per year in new spending that will stretch out for the next 6 to 10 years ( note: this pushes spending $1 trillion out to 13 years). This spread of money over time, or cash flow, results in increased spending in the government infrastructure markets by 50% in 4 years, matching the best ever industry growth rates. We’ve increased jobs by 100,000 per year for 4 years to a total of 400,000 new jobs and they will all have funds to continue work for the next 6 to 10 years. All that just due to added infrastructure spending.
But let’s not forget the rest of the industry. This would push total spending growth and total industry jobs growth to the highest rates of growth on record. So this is a scenario that is unlikely to be achieved, and it’s not very likely that growth like that could be sustained for very long. It’s also not likely the rest of all the new growth in the industry is going to get cut in half to leave room for new added infrastructure work. So, it’s possible total growth over the next 4 years would be less than anticipated here. This allows for no downturn at any time in the next 10 years.
It begins to seem like it might be pretty difficult to add $1 trillion in spending to the infrastructure construction sector, which is only 1/4 of the entire industry, to be spent in the next 10 years.
When sometimes we push numbers to extremes just to see what happens, we get an unexpected picture of what might, or might not, be possible.

Construction Spending 2016 – Midyear Summary
Summary 2016 Construction Spending
9-7-16
Total Construction Spending for July reached a seasonally adjusted annual rate (SAAR) of $1.15 trillion, level with June which was revised upwards by $20 billion or nearly +1.8%. Monthly spending always gets revised in subsequent months. This year every month but May, which remained nearly unchanged, has been revised upwards, by an average of +1.4% and as much as 3.4%. Monthly values are subject to revision for two months after the first release and once again in May of the following year.
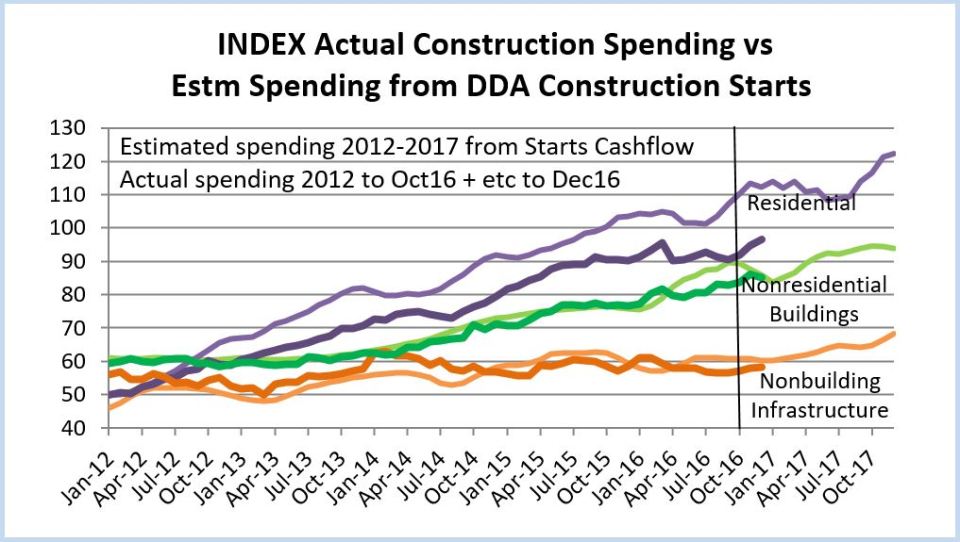
This plot, Construction Spending vs New Starts Cash Flows, shows actual spending (SAAR) by sector through July 2016 and projected trends of spending out to July 2017.

Previously I wrote that we should expect a short duration downturn in spending occurring between January and March. The expected monthly spending cash flows that would be generated from uneven new starts over the last two years indicated that a slowdown in spending would occur during the first quarter 2016. As it turns out, first quarter spending was much stronger than expected, averaging $1.17 trillion SAAR, primarily due to outstanding results in February and March for residential spending. But then April and May experienced significant declines, dropping to an average of only $1.14 trillion SAAR, down almost 3% from Q1. Now with June and July spending both up 1% from the April and May lows, it looks like we may be past that short duration downturn.
Total Construction Spending year-to-date (YTD) through July is up 5.6% over the same seven months 2015. Spending slowed in April and May from a 1st quarter average of $1.17 trillion that reached close to a 10 year high and falls just 4% short of the all-time high. However, it must be noted, that compares unadjusted current dollars, values of all dollars current in the year spent.
When comparing inflation adjusted constant dollars, all dollars adjusted to the same point in time, we can see 2016 spending is still 18% below the 2006 highs.

Total spending YTD through July is slightly ahead of what I predicted back in December, but it’s slightly below what I expected for May, June and July . I expect 2nd half spending to average above $1.2 trillion SAAR, but slightly lower than I originally forecast.
I’ve revised my 2016 spending forecast down slightly to total $1.190 trillion, up 7% from $1.112 trillion in 2015.
How does actual spending YTD compare to my prediction at the beginning of the year?
- Total predicted YTD through July $638.2b, actual YTD $647.7b (+$9.5bil, +1.5%).
- Residential predicted YTD $245.1b, actual YTD $259.2b (+$14.1bil, +5.8%).
- Nonresidential Bldgs predicted YTD $236.9b, actual YTD $228.1b (-$8.8bil, -3.7%).
- Non-building Infrastr predicted YTD $156.2b, actual YTD $160.5b (+$4.3bil, +2.8%).
Where are the revisions?
The single largest reduction in spending is in Nonresidential Buildings Manufacturing. Although there are other variances, that could account for the entire revision downward. Predicted construction starts for Manufacturing was lowered by nearly 35% after the initial start-of-year forecast was made.
Non-building Infrastructure spending increase is being supported by a 20%+ increase in power, which I didn’t expect. New starts for power projects have increased more than 20% since the initial forecast.
Residential construction had unusually large gains in February and March, almost all of that in residential renovations, offset only partially in April through July by declines mostly in new single-family housing.
Here’s my revised 2016 spending forecast based on YTD spending and new construction starts through July, compared to my prediction in December 2015.
- Total predicted Dec 2015 $1,206.2b, July 2016 $1,189.9b (-$16.3bil, -1.4%).
- Residential predicted Dec 2015 $473.8b, July 2016 $481.8b (+$8.0bil, +1.7%).
- Nonresdntl Bldgs predicted Dec 2015 $439.2b, July 2016 $410.9b (-$28.3bil, -6.4%).
- Non-bldg Infrastr predicted Dec 2015 $293.2b, July 2016 $297.3b (+$4.1bil, +1.4%).
Spending and construction starts are often confused by some analysts who refer to starts data as spending. Starts represent total project value recorded in the month the project begins. To determine spending activity, starts values must be spread out over the duration of the projects. Spending is dependent on cash flows each month generated from all previous construction starts. Cash flows expected based on Dodge Data construction starts are indicating a return to growth in spending in the 2nd half 2016. (See chart above Index Actual Construction Spending vs New Starts Cashflows).

Spending Breakout by Sector
Residential construction spending for July totaled a SAAR of $452 billion, remaining near level for the last four months. Residential spending YTD through July is up 6.5% over 2015. Spending slowed in April and May from a very strong 1st quarter average that reached close to a 10 year high. The current 3-month average is just 1% below the 1st quarter and is still at its highest since the 2nd half of 2007 but is 10% below the current dollar all-time high in 2006. I’m still expecting some upward revisions to June or July residential spending.
Residential spending just experienced the strongest three-year stretch of spending growth on record, up 60% in 2013-2014-2015. After taking out inflation, volume growth was only 31%, but that is still the strongest ever for three consecutive years. Spending growth in 2016 will reach only +9%. After adjusting for inflation that represents volume growth of less than +4%, the slowest in 5 years. New starts YTD (as reported by Dodge Data) although down from the 1st quarter, are still near post-recession highs. Starts from late 2015 and early 2016 will still be generating spending into early 2017. 2017 will repeat nearly identical to 2016. What we may be seeing is that it might be difficult to register another year of very high percentage growth in 2016 or 2017 because it is being measured against the 2015 10-year high. Another factor limiting very high growth may be a limited supply of labor to expand the workforce.
Total Nonresidential SAAR spending for July is $701 billion, down slightly from June, but monthly SAAR has varied only +/- 1% for the last six months. YTD spending compared to 2015 is up 5.1%. Nonresidential spending also slowed in April and May but is now up 1.5% from those lows. The current 3-month average is up slightly from the 1st quarter and is just 3% below the pre-recession 2008 current dollar high.
Nonresidential Buildings spending for July totaled a SAAR of $403 billion, down slightly from June but up 1.3% from the May dip. Spending YTD for nonresidential buildings through July is up 8.0% over 2015. The current 3-month average of $403 billion is up slightly from the 1st quarter but is still 9% below the peak in 2008.
Non-building Infrastructure spending for July fell to a SAAR of $289 billion, down only slightly over for the last four months. YTD spending through July is up only 1.3% over 2015. Spending began to slow in April and May and is now at the 2016 low. The current 3-month average is down 4% from the 1st quarter. However, spending on nonbuilding infrastructure reached an all-time high in the first half of 2014 and has remained near those highs through 2015 into the 1st quarter of 2016.
9-7-16
Public spending average for the 1st six months of 2016 is the highest since 2010 and is up 10% from the 2014 low point. YTD public spending is up 0.2% from 2015. All of Highway plus 80% of Educational makes up 55% of all public construction spending. The next largest markets, all of Sewage/Wastewater plus 70% of Transportation accounts for only 19% of public sending. All other markets combined make up less than 20%.
The biggest mover to total public spending this year is educational spending. Public educational spending is up only 4.0% YTD, but because it represents almost 25% of all public spending, it’s has a bigger net impact of +1.0% on moving the trend up than any other single public market. Public commercial spending is up 36.6% YTD but has only a 1% market share of public work. Highway and street is up 2.6% YTD. At 30% of total public that results in a net move of +0.8%. Office, public safety, power, sewage/waste disposal and water supply are all down YTD by a combined -5.3%. At a combined market share of 21% that nets a -1.1% reduction in YTD public spending.
Private spending is dominated by a 52% market share of residential work. At 6.6% growth that nets 3.4% growth in private spending. Several of the nonresidential building markets have high YTD growth (and/or a large market share of private work); lodging +30%, office +27%, Amusement +22%, commercial +10% and power +8%. These five markets combined represent 29% of private spending and combined are up +15% YTD for a net impact of +4.4% to private work.
For a base of reference, here’s a few points in spending history.
Total Construction Spending
- 8 years 1998-2005 up 77%
- 3 years 2003-2005 up 32%
- 3 years 2008-2010 down 30%
- 4 years 2012-2015 up 41%
Residential
- 8 years 1998-2005 up 133%
- 3 years 2003-2005 up 57%
- 3 years 2007-2009 down 60%
- 3 years 2013-2015 up 60%
Nonresidential Buildings
- 5 years 2004-2008 up 64%
- 3 years 2006-2008 up 45%
- 3 years 2009-2011 down 36%
- 2 years 2014-2015 up 25%
Non-building Infrastructure
- 7 years 1995-2001 up 56%
- 4 years 2005-2008 up 60%
- 3 years 2009-2011 down 8%
- 3 years 2012-2014 up 19%
See this post for expanded details on Construction Spending – Nonresidential Markets – Buildings and Infrastructure
See this post for expanded details on Construction Inflation
What Drives Construction Spending?
3-23-16
New construction starts drive construction spending. For all the discussion regarding the monthly rise and fall of spending, most of the spending in any given month is already predetermined since two thirds of all construction spending in the next 12 months comes from projects that were started prior to today. This is commonly referred to as backlog.
The pattern of spending does not follow the pattern of new starts which can fluctuate dramatically. It follows the pattern developed by the cashflow from all previous starts. Data for new construction starts is sourced from Dodge Data & Analytics. Cash flow is developed independently. Here’s a much simplified example of cashflow: a new $20 million project start is to be completed in 20 months, therefore we expect this project to generate $1 million of spending every month for the next 20 months.
This plot is an Index, so the ratios of starts and actual spending show the relative volume of each of these three major sectors as compared to each other.

Nonresidential buildings new construction starts were elevated for 16 out of the last 24 months. Starts were strong from February through July of 2015. A slowdown occurred in the second half of 2015 but the last four months have been gaining slowly. It looks like the backlog of elevated starts will keep spending rising at least until the end of 2016 before we see a slight dip in spending.
75% of all nonresidential building spending in 2016 comes from projects that were started between early 2014 and the end of 2015. Each month, new starts generate only 4%-5% of monthly spending. As we start the new year, backlog accounts for 95% of January spending. We know a lot about spending within the next few months, but what we have in backlog for December at the beginning of the year from previous starts accounts for only 50% of December activity. We will add about 4-5% more to December backlog from new starts each month this year.
Five out of six times in the last 18 months that nonbuilding infrastructure new construction starts jumped 25% to 50% above the running average it was due to massive new starts in the power sector. Some of these projects are worth several billions of dollars. While this causes new starts to fluctuate wildly, these projects sometimes take four to five years from beginning to completion, so the cash flow is spread out over a very long period, therefore spending does not experience the same magnitude of monthly change as starts.
80% of all nonbuilding spending in 2016 comes from projects that started from mid-2013 through the end of 2015. New starts each month generate only about 3% of monthly spending.
The average of residential starts for the last three months is higher than any time since 2007 when residential starts were already on the decline by 24% from the previous year. The volume of residential starts predicts that spending should be higher than it is currently. This could mean that some starts have been delayed. Or, it could be because residential starts have the shortest duration, they may be the most difficult to predict spending from starts.
55% of all residential building spending in 2016 comes from projects that started between late 2014 and the end of 2015. New starts each month generate almost 10% of monthly spending.
(6-5-16) RE: a discussion related to a decline in nonresidential permits suggests nonresidential spending will decline. Yes, but at what rate? Permits are directly related to new construction starts. Since every month of new starts has an impact of only 4-5% on nonres spending in every following month for the next 20-25 months, then a 10% drop in permits in a single month would cause only a 0.4% to 0.5% reduction in spending in each of the following 20-25 months. It would take a prolonged trend of declining permits and therefore declining new starts to really see a dramatic decline in spending, and then the greatest effect would be well out into the future.
January 2016 Construction Economics Report
For the latest Construction Economics news follow this link
Construction Economic Outlook
…
…
January 2016 economic report:
BUILDING FOR THE FUTURE
Construction Economics – Market Conditions in Construction.
Construction spending may reach historic growth in 2016. We are currently near the most active 3 year period of growth in construction in more than 20 years, and it’s already been ongoing since 2013-2014.
Construction spending is forecast to increase 9.7% in 2016. Spending could reach a total 30% growth for the three years 2014-15-16. The only comparable periods in the last 20 years are 29% in 2003-04-05 and 27% in 2013-14-15.
Uneven growth rates ranging from rapidly increasing spending to slight dips is more an indication of the effects of uneven new starts patterns than a loss of growth momentum.

SPENDING
Nonresidential buildings spending is forecast to grow 13.7% in 2016 and the three-year total growth could reach 40% for 2014-15-16. The only comparable growth periods in the last 20 years are 40% in 2006-07-08 and 32% in 1995-96-97. Major contributions are increasing from institutional work in educational and healthcare markets. Office, commercial retail, lodging and manufacturing will decline considerably from from the levels in 2015 but still provide support to 2016 growth.
Residential spending increased 46% in 2013-14-15, similar to only one comparable period in the last 20 years, 48% in 2003-04-05. Residential spending will slow several percent early in 2016 before resuming upward momentum to finish the year with 12% growth, slightly less than growth in 2014 and 2015.
Non-building infrastructure projects, in two of the last three years have barely shown any gains, entirely due to declines in power plant projects. This will repeat in 2016. Spending will decline over the next six months due to the ending of massive projects that started 24 to 42 months ago, then resume moderate growth. Following a 0.5% increase in 2015, spending will increase only 1.2% in 2016, held down by a 10% drop in power projects, the second largest component of infrastructure work.
JOBS
Construction added 1.0 million jobs in the five years 2011-2015. 800,000 jobs were added in the last three years. In addition, hours worked increased to an all-time high adding the equivalent of 240,000 more jobs over the last five years.
In the two years 2014-2015, jobs increased the most since 2004-2005. Growth in nonresidential buildings and residential construction in 2014 and 2015 led to significant labor demand and wage growth. To support forecast spending, jobs need to grow by 500,000 to 600,000 in 2016-2017.
From the low-point of the recession in January 2010, the unemployment rate began declining as a result of the unfortunate reason of workers leaving the construction workforce. That decline halted in early 2013, at which point the workforce once again started growing. Since then the unemployment rate has been declining due to the non-working pool being reabsorbed into the the employed workforce.
There are numerous reports of labor shortages in some building professions. Average construction unemployment for Nov-Dec-Jan equaled the lowest on record (for this 3mo period) last seen in 2006, indicating a low available nonworking pool from which to grow jobs. This data supports the argument of labor shortages and potential difficulties ahead in growing employment. However, jobs continue to grow at the fastest rate in 10 years.
INFLATION
Construction inflation for buildings in 2016-2017 is quite likely to advance higher and more rapidly than previously thought. Long term construction cost inflation is normally about double consumer price inflation. Construction inflation in rapid growth years is much higher than average long-term inflation. Since 1993, long-term annual construction inflation for buildings has been 3.5%, even when including the recessionary period 2007-2011. During rapid growth periods, inflation averages more than 8%.
Spending growth, up 35% in the four-year period 2012-2015, exceeded the growth during 2003-2006 (33%) and 1996-1999 (32%) which were the two fastest growth periods on record with the highest rates of inflation and productivity loss. Construction spending growth for the four year period 2013-2016 is going to outpace all previous periods.
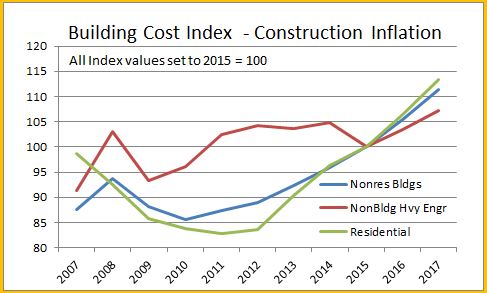
Inflation cost for residential buildings, nonresidential buildings and infrastructure projects do not follow the same pattern. For the last three years, the Gilbane Building Cost Index for nonresidential buildings has been increasing and has averaged just over +4%. Residential buildings cost indices averaged just over +6% but have been decreasing. Both are expected to climb in 2016. Caution: composite all-construction cost indices or indices that do not represent final cost should not be used to adjust project costs.
Infrastructure indices are so unique to the type of work that individual specific infrastructure indices should be used to adjust cost of work. The FWHA highway index dropped 4% in 2013-2014 but increased 4% in 2015 and is expected to increase in 2016-2017. The IHS power plant cost index gained 12% from 2011-2014 but then plummeted in 2015 to an eight year low. The Producer Price Index (PPI) industrial structures index and the PPI other nonresidential structures index both have been relatively flat or declining for the last three years.
Anticipate construction inflation for residential and nonresidential buildings during the next two years closer to the high end rapid growth rate of 6% to 8% rather than the long term average of 3.5%.
The full report provides analysis for what occurred in 2015, data that supports 2016 forecasts and historical trends that shape the construction industry.
Author’s note: I provided all opinion in this economic report. Now, as an independent construction economics analyst, I compile economic information and perform data analysis. You can now find all this analysis here in this new blog format. EdZ
Construction Spending – Reports of It’s Death May Be Greatly Exaggerated
Is activity climbing or declining? Will costs go up or down? Will we have a winter slowdown? Where are the markets headed? I read an article this morning that stated “momentum is losing steam.” Is it?
I’ve been gathering Construction economic reports for comparison and I see some predictions for 2016 that frankly are only about what I’m predicting for 2015. To be fair, there are reliable predictions that indicate growth similar to what I predict. When data was available for two thirds or better of 2015 total activity there were still predictions for how specific markets would finish the year that varied by as much as 20% to 30%. In one instance the year-to-date actual through September has already exceeded the year end estimate from one firm. Surprising, once that much actual year-to-date information is in hand that there could be that much variation.
And how will markets perform in 2016? Here’s a few examples from a variety of sources; educational, healthcare, lodging and manufacturing all have more than one estimate for 2016 growth in the range of 0% to 4%, values that would not keep spending growth up with inflation, meaning volume would actually decline. My estimates for those markets are all 10% or higher. Variations of 10% to 15% in growth are common in the data.
So, here’s a few comments on predictions and on what to expect.
Unless something Earth-shattering happens, there is a select set of monthly data that statistically predicts the yearly outcome for total spending and market spending, within +/-1.5% for a smaller data set and within +/-1% for a slightly larger data set, but you have to wait longer to get that larger data set. It failed once in 14 years, by 1/2 of 1 percent. The same analysis can be performed individually for markets and sectors. The potential variance increases for some markets to about +/-3%.
The Dodge Momentum Index and the AIA Inquiries index are leading indicators to potential future work. They foretell activity in the Architectural Billings Index (ABI), which is a leading indicator to new construction starts. New starts provide the future cash flows for spending.
Spending in any given month is the sum of how much can be put-in-place generated by the cash flow from each of the project starts that got booked in the previous year or two, or three for long duration projects. For the next month the unknown amount is only about 3% or 5% that will be generated by new starts in the most recent 30 days. The remainder is already booked. Two months out the prediction includes 6% to 10% uncertainty, and so on.
Expect a winter slowdown. It’s not because of the weather. There may be additional repercussions if we experience severe weather, but the slowdown is predetermined because very large starts that got booked from a year to two years ago are reaching completion and dropping out of the monthly spending. Starts can be erratic. This causes periodic fluctuations in monthly spending. It’s normal.
Also what may not be apparent is what happens due to the difference in seasonally adjusted (SA) and not seasonally adjusted (NSA) values. Readers most often track the changes in SA values, but spending is generated from cash flow and cash flow is generated from the NSA values. Differences can be huge. As an example, August starts with an SA of $300bil produce 50% more actual NSA dollar volume to cash flow than February starts with an SA of $300bil. This may cause erratic spending patterns.
Residential spending will slow several percent to a low point in February before resuming upward momentum to finish the year stronger than 2015. Periods of low start volumes need to work their way thru the system and this produces growth patterns with periodic dips.
Nonresidential buildings will slow only moderately in the next few months before we see 15% growth through the middle of the year, only to see another slowdown late next year, leading into a considerably slower 2017. Office new construction starts in 2015 are up 50% from 3 years ago, educational up 25% over same period. Manufacturing starts are down 70% in 2015 and that is still at the second highest ever recorded. Total spending is still strong in 2016 at 10% growth. Major contributions appear from institutional work in educational and healthcare. Office and manufacturing still provide very strong support to growth.
Infrastructure projects spending will decline for the next six months due to the ending of massive projects that started 24 to 42 months ago. There will be large advances in spending midyear before we experience another slowdown later in 2016. I’m currently predicting spending will grow less than 2% in 2016, held down by a 10% drop in Power the second largest component of infrastructure work.
Mixed within the three sectors above are Private and Public spending. Residential is about 98% private and makes up about 50% of all private work. Along with manufacturing and large portions of power, commercial/retail, office and healthcare makes up nearly 90% of all private work. Private growth is the sum of the parts, predicted at 10%+ for 2016. Public work is all or a large portion of highway/street, educational, transportation and sewage/waste. Along with small contributions from water and a portion of power, these markets comprise 80% of all public work. Again, the sum of parts shows growth at 8% in 2016.
From the middle of Q1’16 to the end of Q3 we will register an annual growth rate of 20%, but due to the dips at the beginning and the end of the year total 2016 construction spending growth will come in at 11%. Construction spending momentum is not losing steam. We are seeing the affect of a few years of erratic growth patterns and a shift from commercial to institutional work.

