Home » Starts (Page 2)

Category Archives: Starts

Pandemic #13 – Midyear Construction Outlook

See Also this update   Construction Forecast Update 10-16-20

SEE ALSO   Pandemic #14 – Impact on Construction Inflation

Midyear Construction Outlook 8-14-20 based on

  • Actual Spending data includes revisions 2018-2019 issued 7-1-20
  • Actual Jobs data includes BLS Jobs to July (12th) issued 8-7-20
  • Forecast includes US Census June 2020 year-to-date spending 8-3-20
  • Forecast includes Dodge construction starts Midyear Update 8-6-20

The first important thing to note is that the US Census, on 7-1-20, revised all spending data back several years. This is an annual occurrence. This analysis includes all revised data, which adds about $30 billion to 2018, $60 billion to 2019, half of all adding to residential, and revises 2020 data. Not everyone has yet updated to this recently revised data, so you may see differences when comparing forecast reports among several firms. If needed, refer to the percent.

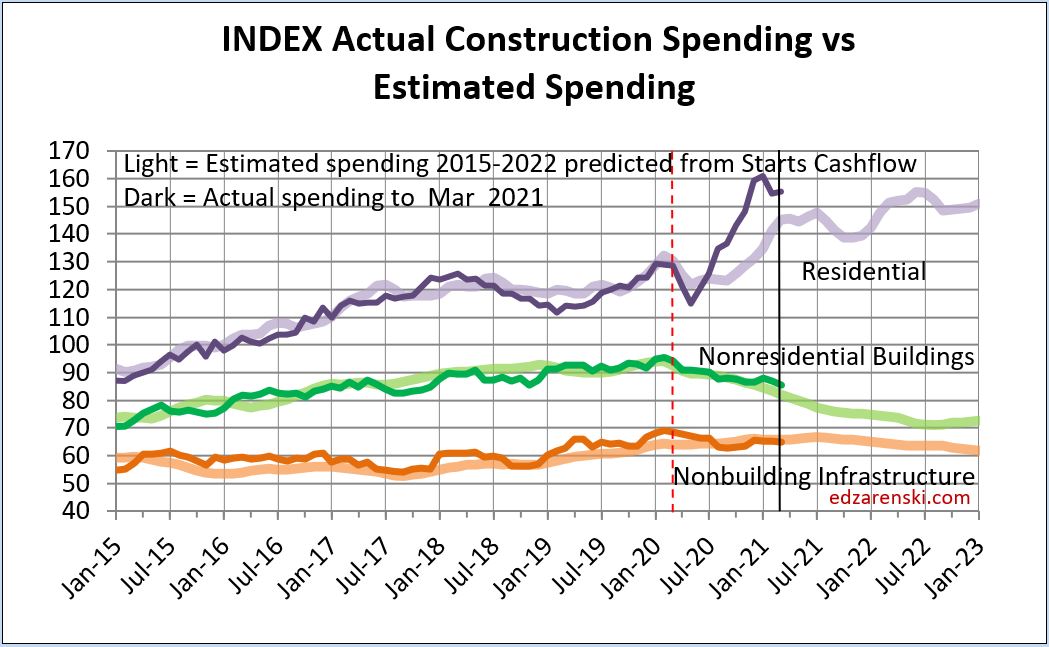
Initial impact on spending from project delays/shutdowns

This compares the current construction spending data to a 2020 Forecast from April 1 before any Pandemic Impacts were recorded. It compares actual to what was expected Pre-Pandemic. The change in year-to-date (ytd) all occurred in 2nd quarter data. In fact, 1st quarter ytd growth was forecast at 7% and it came in at 9.5%. 2nd quarter growth was forecast at 6.8% and it came in at 1%.

Construction Spending 2020 year-to-date (ytd) thru June vs 2019

Actual ytd vs Pre-Pandemic Forecast ytd. Nearly all this change is due to projects delayed/shutdown.

  • Nonres Bldgs down 2.4% ytd in 6mo vs pre-pandemic forecast
  • NonBldg UP 3.0%
  • Residential down 4.9%
  • TOTAL down 1.9%

The measure of decline due to Pandemic delays and shutdowns is not the difference between Q1 and Q2 growth in ytd spending. Nor is the impact measured by the current difference in ytd performance vs 2019. It’s the difference between what was forecast for ytd growth pre-pandemic vs actual ytd growth.

For instance, Residential construction spending thru Q2, as reported in the US Census June construction spending release, is up ytd 7.8%. But pre-pandemic it was forecast to be up 12.7% ytd after 6 months. Hence, residential spending has been impacted by a 12.7% – 7.8% = 4.9% decline from original forecast thru June.

Future impact on spending from lost construction starts

Part one of the decline in construction spending was due to delays/shutdowns. Part two will be the impact of reduced construction starts. That has very little affect right now, but will play out over the next few years. But remember once again, the impact in 2021 is not measured by the difference between 2020 and 2021, its the difference between current forecast for 2020/2021 and the pre-pandemic forecast for 2020/2021.

Year-to-date, total construction starts are down 14%. Residential new starts are down 5%, nonresidential buildings down 22% and non-building infrastructure starts are down 14%.

Dodge updated their forecast to show 2020 construction starts for nonresidential buildings fall on average 20%, less in some markets, but -30% to -40% in a few. Only warehouses is up. Non-building starts fall on average 15%. Only Highway/Bridges is up. Residential starts may fall only 5%-10%.

How those lowered starts affect spending is spread out over cash flow curves for the next few years. This has a major impact on jobs later in 2020 and all of 2021 into 2022. For nonresidential buildings, the greatest impact to spending and jobs affected by a reduction of new starts in 2020 occurs from 2021 into 2022 when many of those lost starts would have been reaching peak spending.

Only about 20% of new starts gets spent in the year they started. 50% gets spent in the next year. The effect of new starts does not show up immediately. If new nonresidential buildings starts in 2020 are down 22%, on average, the affect that has on 2020 is reduced spending by -22% x 20% = – 4.4%. But the affect it has on 2021 is -22% x 50% = -11%.

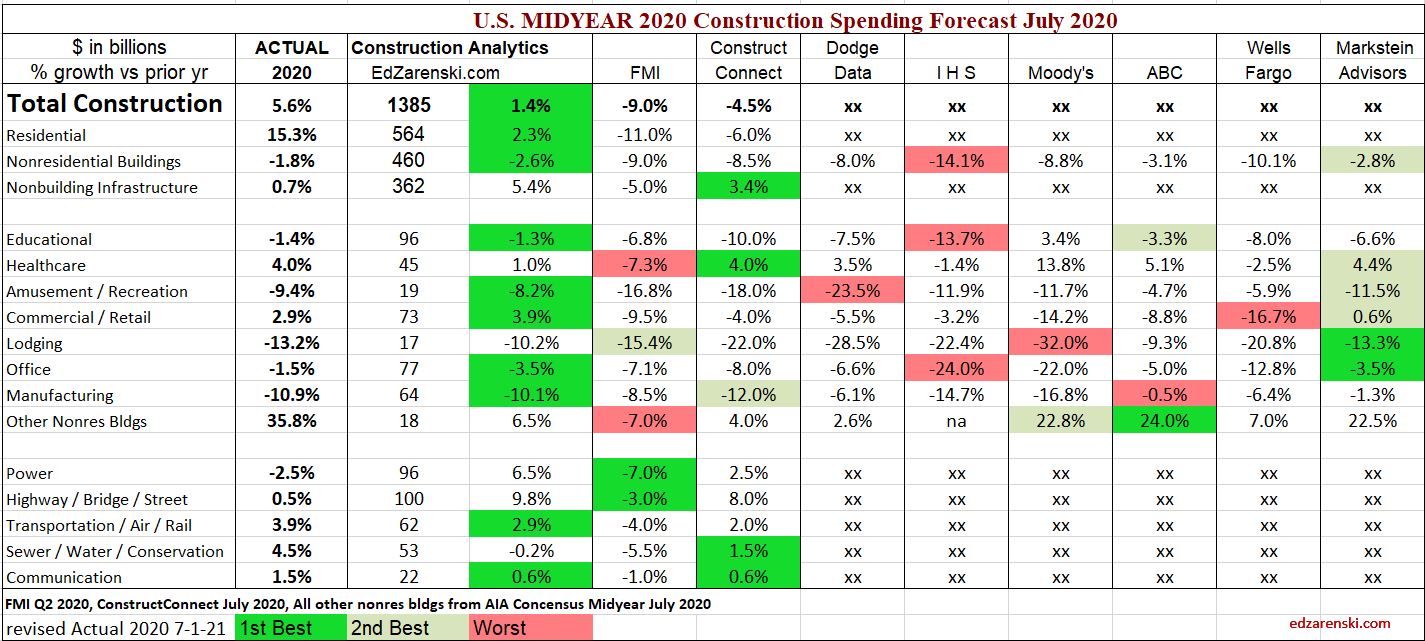
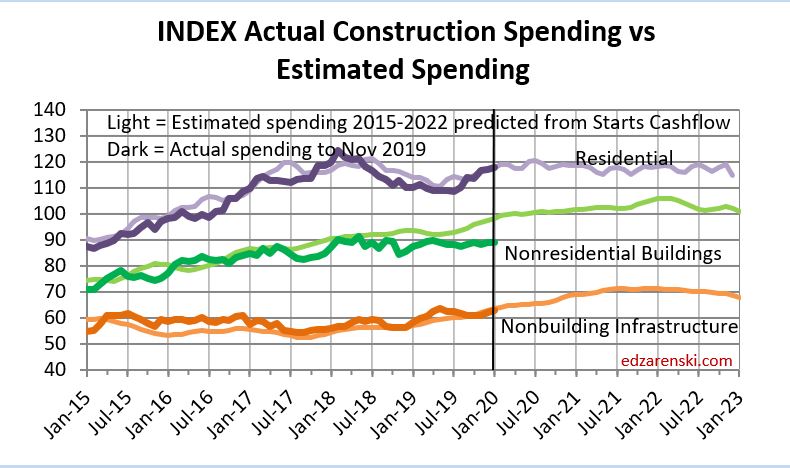
Construction Spending FORECAST 2020 vs Pre-Pandemic Forecast

This change in forecast incorporates reduced new construction starts for 2020 but also includes the impact from delays and shutdowns.

  • Nonres Bldgs down 5.4% for 2020 vs pre-pandemic forecast
  • NonBldg down 0.3%
  • Residential down 6.5%
  • TOTAL down 4.5% vs pre-pandemic forecast

Construction Spending FORECAST 2021 vs Pre-Pandemic Forecast

Nearly all this change due to a reduction in new construction starts in 2020. Notice, it is nonresidential buildings that are impacted the most, down 10% from the pre-pandemic forecast.

  • Nonres Bld down 9.9% for 2021 vs pre-pandemic forecast
  • NonBldg down 6.4%
  • Residential UP 5.8%
  • TOTAL down 2.5% vs pre-pandemic forecast

Future impact on backlog from delays/cancellations and reduced starts

Starting Backlog is the Estimate-to-Complete (ETC) value of all projects under contract at the beginning of a period. Projects in starting backlog could have started last month or last year or several years ago. Many projects in backlog extend out several years in the schedule to support future spending, so backlog growth in not an indicator that tracks year over year with spending. Current backlog at the start of 2020 would still contribute some spending for the next 6 years until all the projects in backlog are completed.

The last time starting backlog decreased was 2011. Starting backlog will fall 10% in 2021 and 2% in 2022. Except for residential work, about 80% of annual spending comes from starting backlog.

Some of the projects delayed or canceled started before Jan. 2020. When one of those projects is delayed, the portion of the project delayed gets removed from 2020 backlog, but then gets added to future backlog. When one of those projects is canceled, the portion of the project not yet put-in-place gets removed from 2020 and future backlog. Not only does that reduced future backlog but also that retroactively reduces the backlog that was on record at the start of 2020. Therefore, 2020 backlog is reduced by delays and cancellations and future backlog is increased by delays, but reduced by cancellations and a loss of new construction starts.

The following is the difference between what was forecast for backlog pre-pandemic and currently projected backlog based on delays, cancellations and reduced starts.

Backlog projected for the start of 2020:

  • Total Construction down 3.6% vs pre-pandemic forecast
  • Nonresidential buildings down 8.3%
  • Non-building infrastructure up 0.5%
  • Residential backlog down 2.2%, new starts down 5.4%

Although two thirds of Residential spending comes from new starts within the year, 2020 backlog is down 2.2%. 2020 new starts are down 5.4%.

The biggest changes to 2020 backlog are Manufacturing, Commercial/Retail and Amusement/Recreation, all down 10% to 15%.

Backlog projected for the start of 2021:

  • Total Construction down 9.8% vs pre-pandemic forecast
  • Nonresidential buildings down 15.1%
  • Non-building infrastructure down 9.4%
  • Residential backlog up 3.6%, starts up 8.4%

For 2021, Power and Environmental Public Works are down 20% and 10% respectively, but Nonresidential Buildings shows most of the losses. Lodging -40%, Amusement -28%, Manufacturing -26%, and Office and Commercial both down about 15%.


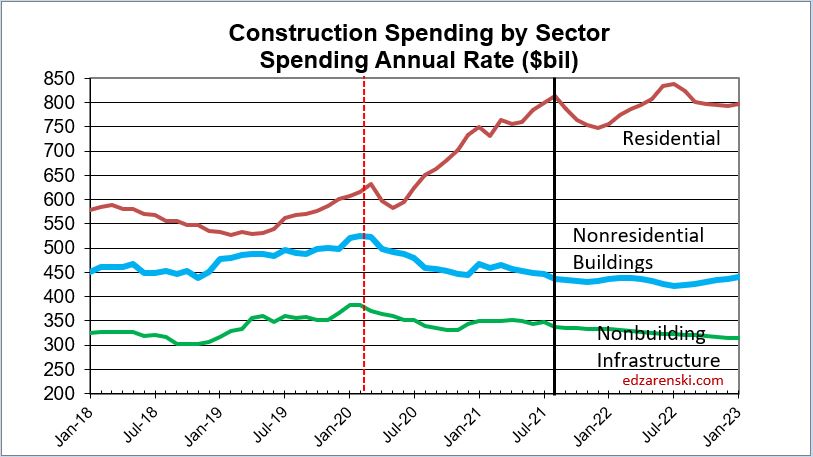
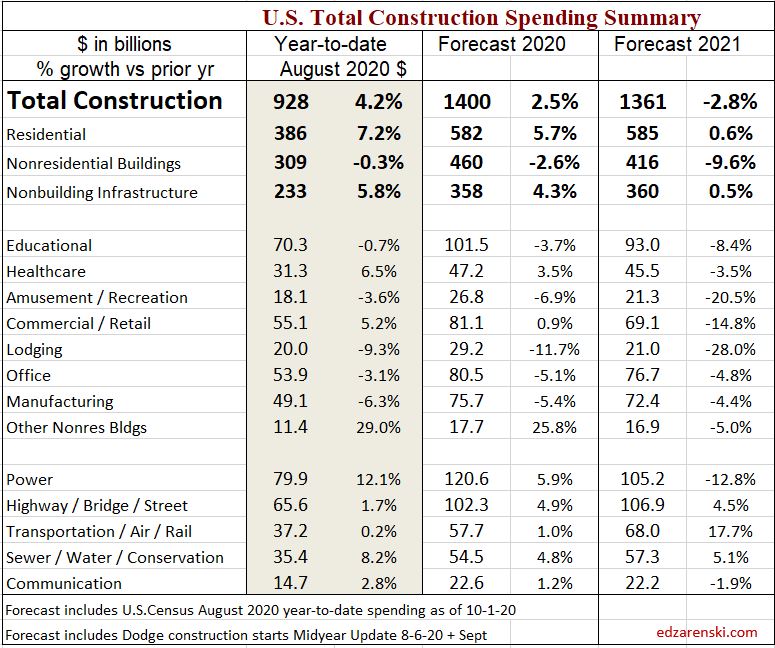
Spending Forecast 2020 – 2021

Now that we have highlighted the change in the forecast compared to the pre-pandemic forecast, let’s look at the current spending forecast for 2020 and 2021.

Spend Recession 2020 Summary 8-14-20

See Pandemic #11 – June Construction Spending Update  for coverage of midyear spending year-to-date through June.

Spend Sector monthly 2015-2022 8-11-20

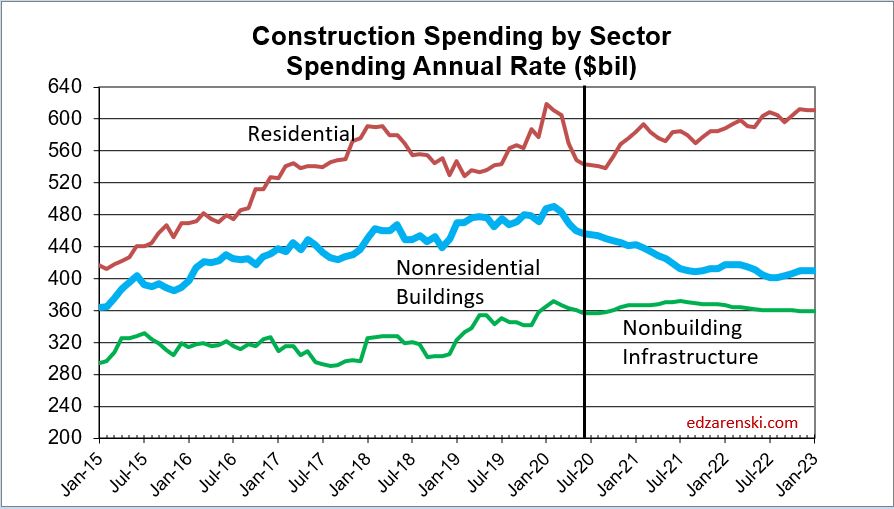
For 2020, the biggest declines are Manufacturing, Lodging and Amusement/Recreation, all down -8% to -10%. Commercial/Retail ends up +3.9% (this market is 60% Warehouse). Office and Educational are down -3% and -1%. Nonresidential buildings takes the brunt of declines in both 2020 and 2021.

In 2021, every nonresidential building market is down from 2020, some markets down 10% to 20%. Educational, Healthcare and Office are all down 3% to 5%. Non-building infrastructure Power market is down -11%, but Highway and Transportation are up +10% to 20%.

Spend YTD 2020 plus Markets 2020 2021 8-14-20

Almost every market has a weaker spending outlook in 2021 than in 2020, because of lower starts in 2020. Starts lead to spending, but on a curve, a good average for nonresidential buildings is 20:50:30 over three years. 20% of the total of all starts in 2020 gets spent in 2020 (yr1) and that represents also about 20% of all spending. 50% of the total value of 2020 starts gets spent in the following year, 2021. So, 50% of spending in 2021 is generated from 2020 starts. If starts are down 20% and 50% of spending comes from those starts, spending will be down 20% x 50% of the work.

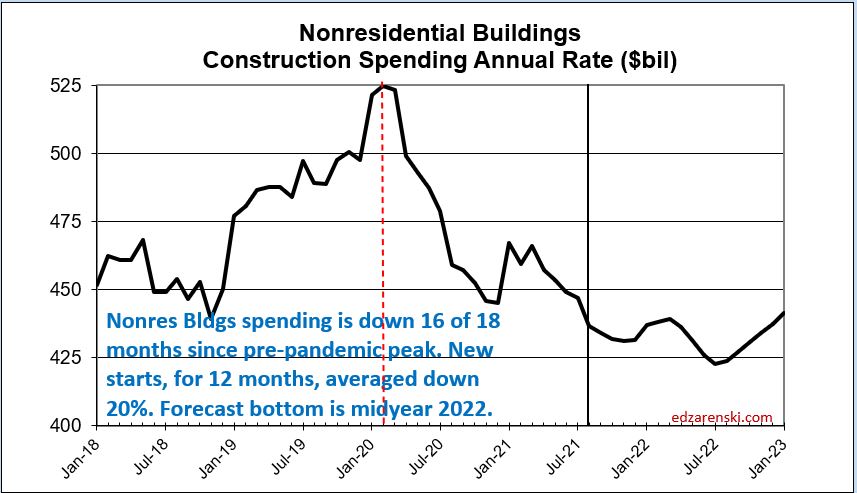
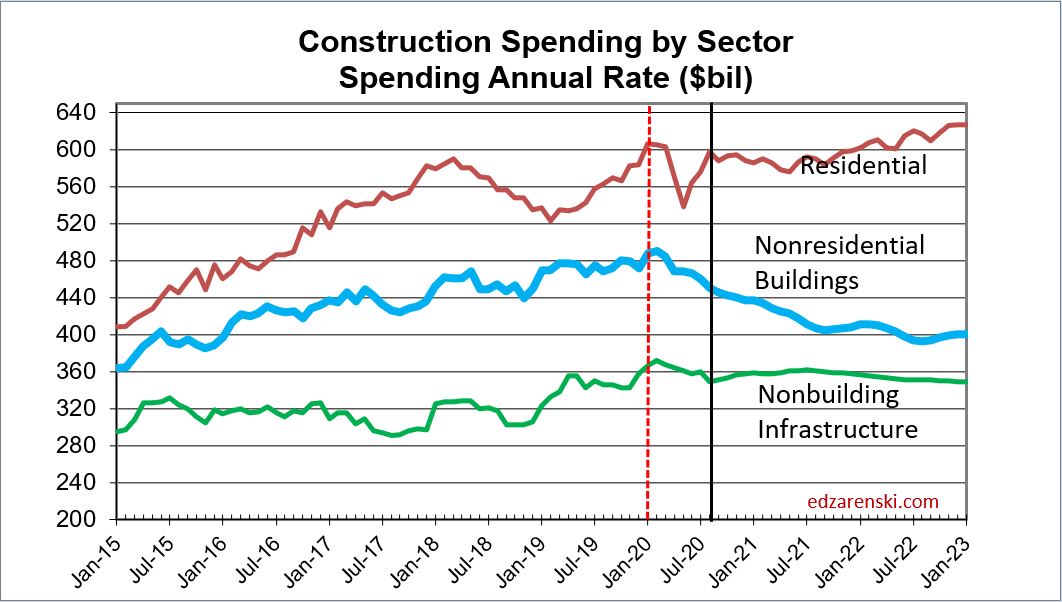
Although starts are forecast down 15% to 20% in 2020 and UP 5% to 15% in 2021, the drop in starts in 2020 has the greatest impact on reducing spending in 2021. By June of 2021, spending is down 10% from Feb 2020 and volume is down 14%.

Before we can look at the effect on jobs, we need to adjust spending for inflation. The plot above “Spending by Sector” is current dollars. Here that plot is adjusted for inflation and is presented in constant $. Constant $ show volume. Notice residential remains in a narrow range after adjusting for inflation. No sector shows improvement in volume through Jan. 2023.

Spend Sector Constant2019 monthly 2015-2022 8-16-20

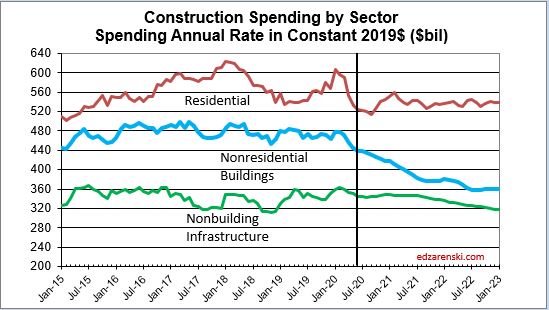
By far the greatest decline in volume is in the nonresidential buildings sector. Volume declines follow in line with spending declines. The greatest losses in 2020 are Amusement/Recreation, Lodging and Manufacturing. In 2021, every major nonresidential building market drops in volume.

Why 400,000 construction jobs are not coming back

Reduced starts in 2020 has a major impact on jobs later in 2020 and all of 2021 into 2022. For nonresidential buildings, the greatest impact to spending and jobs occurs from 2021 into 2022 when many of those lost starts would have been reaching peak spending.

Jobs data show construction added 20,000 more jobs in July. After losing almost 1,100,000 jobs in March and April (out of a prior total 7,600,000), we regained 450,000 jobs in May and 160,000 in June. That leaves construction down 440,000 jobs from the February high point.

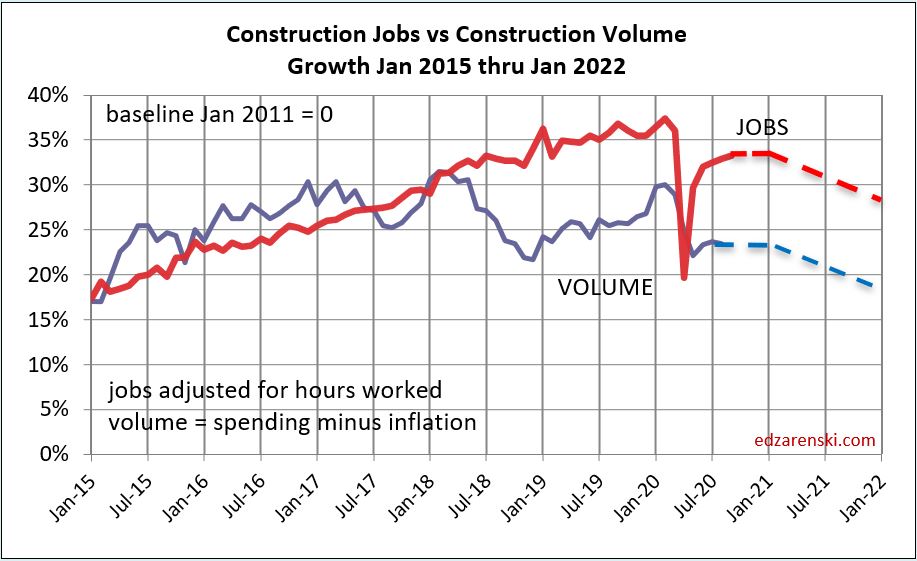
Jobs are down 6% from Feb to July, but construction spending is down 7% through June and volume (spending adjusted for inflation) is down 9%.

Although we may get slight jobs growth in the next few months, there is little to no volume growth to support it. Spending is currently down 7% from the Feb high and volume is down 9%. More spending declines are minimal through Q1 2021. Due to the large declines in new construction starts, we will begin to see additional spending and volume declines by spring 2021. Most of the decline will be in nonresidential buildings.

This annual plot back to 1999 shows construction spending vs construction volume. Volume is spending minus inflation.  Notice, volume never recovered to peak 2005. Also notice, recent volume began to decline in 2018.

Spend current vs constant thru 2021 8-11-20

The long-term view of jobs vs volume shows an important point. With few exceptions jobs and volume grow equally. Setting a baseline to zero in 1990, there was a spread in 1992 that was nearly equalized by 1998. Jobs and volume growth remained near equal until 2004. Leading into 2006, spending increased by the most in 30 years. Jobs, which seem to lag slightly, grew 15% from 2004 thru 2006. But inflation posted the highest rate in 30 years. While jobs grew to meet spending growth, almost all the spending growth was inflation. By 2006, jobs growth exceeded construction volume by more than 15%.

Jobs vs Volume 1991-2022 2006 deficit 8-14-20

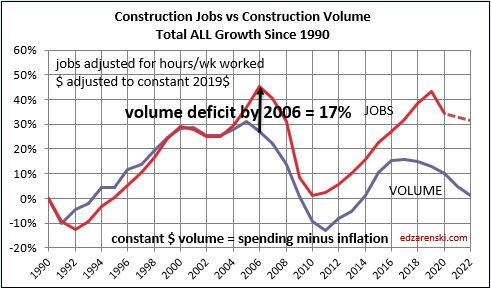
As I said, with few exceptions, jobs and volume grow equally. If we modify history to reset the baseline to 2006 by increasing volume, the plot now shows that all years from 2006 to 2017 remained consistent in jobs growth vs volume growth. So, with exception of 1992 and 2004-2005, all years from 1990 to 2017 had consistent growth in jobs and volume.

Leading into 2017, spending once again reached a rate of near record growth, second only to 2004-2005. Again, jobs, which seem to lag slightly, grew to meet spending growth. But inflation posted the highest rate since 2006. Once again, jobs grew rapidly, but almost all the spending growth was inflation. By 2019, for the second time, jobs growth exceeded construction volume by almost 15%.

Jobs vs Volume 1991-2022 2006 deficit reset 8-14-20

Jobs are supported by growth in construction volume, spending minus inflation. We will not see construction volume return to Feb 2020 level at any time in the next three years. This time next year, volume will be 5% lower than today, 14% below the Feb 2020 level.

We are currently down 440,000 construction jobs from the Feb high. We may regain 40,000 to 50,000 more jobs before the end of the year. But the declining work volume due to a reduction in new starts in 2020 is indicating by this time next year, not only is there no volume to regain 400,000 lost jobs, but we may lose another 200,000 jobs and be down 600,000 jobs below the Feb 2020 high.

The following plot is the same jobs and volume data as above, only plotted monthly rather than annually. Much of the fear decline of jobs in April has been corrected, but jobs are still down 440,000 from the February high. And yet, the plot shows jobs in excess of construction volume by about 12%.

Jobs vs Volume 2015-Jul 2021 dashed 8-14-20

Volume is set to decline at least for the next two years. There will be no volume growth to support jobs growth and long-term jobs growth already exceeds volume growth by 12%. This is not an environment that supports jobs growth.

Pandemic #10 – June New Construction Starts

Construction Starts gain 5% in May, 6% in June. But let’s put that in perspective. Starts year-to-date through June are down 14% compared to same 6mo 2019. Starts in Q2 2020 are down 22% compared to Q1 2020.

Non-building construction starts rose 27% in June driven by 108% gain in utility/gas plants, 63% increase in miscellaneous non-building construction and 38% rise in environmental public works projects >> Dodge June 2020 Report New Construction Starts

Non-building infrastructure construction starts for the 1st half 2020 were down 14% even though June starts were up huge. But that is almost entirely due to Utilities/Power Plants, 40% of the total of non-building markets, down 40%.

Highway and Bridge represents almost 40% of non-building markets and starts are up 8% for the 1st half 2020 compared to same period 2019.

Public works, almost 20% of non-building markets, posted starts for 1st half 2020 down 20%.

Commercial (Comm/Rtl, Lodging, Offc) and Multifamily (Dodge multifamily includes Asst Liv Fac, Dorms, MF Housing, Housing Reno) construction starts are down 22% in 1st half 2020. This group represents 20% of total of all construction markets.

Institutional building construction starts (Educ, Hlthcr, Amuse/Rec) are down 15% in the 1st six months of 2020 compared to same period 2019.

Manufacturing starts are down 38% ytd 2020 compared to same period 2019.

Single family residential starts are down only 1% in 1st half 2020 from same period 2019. That market alone represents 20% of all construction.

Expect 2020 spending declines in Amuse/Rec, Lodging, Offc, Mnfg. Expect increases in CommRtl (it’s all in warehouses, stores are down), and most non-building markets.

Even with new construction starts down 10%-15%, cash flow patterns are still indicating nonresidential construction spending will be up in 2020. Greatest strength is in non-building work. A reduction in 2020 new construction starts will show the greatest impact in 2021.


Coming in August:

Aug 3 – Construction Spending Report for June, will include revisions to April and May, both expected to be revised down.

Aug 7 – July jobs report for the period June 14 through July 18.

Aug – Revised Construction Outlook to include Data through June spending, July jobs and June new construction starts.


2020 Construction Forecast Briefs

2020 Construction Forecast Briefs

12-23-19 updated 1-4-20

updated 1-4-20 – The construction spending forecast for 2019 is revised up to $1,304 billion, still a decrease of 0.2% vs 2018. Almost all of the revision up is residential spending that was added in Oct and Sept Census spending revisions released 1-3-20.

The forecast for 2020 construction spending is $1,360 billion, up 4.5% over 2019.

Total Spending increased 9%/yr. from 2012 to 2016, then in 2017 and 2018 slowed to 4%/yr. Spending declined <1% in 2019 and is forecast up 3% to 4% for both 2020 and 2021. 

New construction starts, as reported by Dodge Data and Analytics, increased 7%/year in 2016 and 2017, but only 3% in 2018. Starts are forecast to decline slightly in 2019 and 2020.

New construction starts data captures a share of the total market or a portion of all construction spending, on average about 60% of all construction. In this analysis every market is adjusted by its own individual market share factor.

Applying the market share factors, starts are forecast up slightly in both 2019 and 2020.

Backlog reaches a post-recession high starting 2020, up 20% from 2017, up 100% from 2013. Starts and backlog growth are forecast to remain below 3%/year gain or decline over the next few years. Total spending has only slight gains in 2021 and 2022.

Backlog at the beginning of the year or new starts within the year does not give an indication of what spending will be like within the year. Backlog increases if new starts during the year is greater than spending during the year. An increase in backlog could be a level rate of market activity for a longer duration. It takes several years for all the starts in a year to be completed. Cash flow shows the spending over time. 

The best indicator of future construction activity is the sum of the projected cash flow generated by all the construction starts that have been recorded.

plots updated 1-4-20

Spending cash flow predicted from Dodge Starts and construction spending to date.

Starts CF 2015-2022 1-18-20

A what if scenario in which new construction starts drop by 10%:

On average about 20% of new nonresidential construction starts gets spent within the year started, 50% is spent in the next year and 30% is spent in future years. (For residential the spending curve is more like 70%-30%). If new starts drop by 10% this year, that has only a -2% impact on total nonresidential buildings spending for this year. It would be -5% next year, -3% after. If starts drop a second year, the same impacts occur, shifted one year out, and the total impact for both years is added.

Only about 30% of residential spending within the year comes from backlog and 70% from new starts. If residential new starts drop 10% that impacts total residential spending by 7% in that year.

Nonresidential Buildings starts (excluding Terminals) have reached a new high every year since 2009, but the last three years starts are up only 2% to 3%/year. Every market posted increases in 2017 and 2018. Only Commercial/Retail and Amusement/Recreation declined in 2019. Backlog for Office Buildings, which includes data centers, is up 100%+ since 2015. Spending is still up 4% in 2020 but then with the slowdown in starts forecast in 2020, backlog growth stalls and spending slows in 2021-2022.

Nonresidential buildings markets advancing in 2020-2021 are Educational, Healthcare, Office and Manufacturing. Markets declining are Amusement/Recreation, Commercial/Retail and Lodging.

Non-building Infrastructure starts (including Terminals), up 4% in 2019, are at an all-time high. The two markets with the largest share of new starts are Highway/Bridge and Transportation. Transportation terminals and rail starts are up 30% in the last three years, but backlog has nearly doubled because a large portion of those starts is very long duration projects. Starts are forecast up only 1% in 2020 but backlog peaks in 2021. Spending increases are in the 6% to 8% range at least for the next two years.

Spending in recent years has been boosted by Transportation terminals, Highway and Public Works projects. Power is flat or down slightly.

Residential starts averaged 19%/year growth from 2012 to 2016 but slowed to 5%/year for 2017 and 2018. Starts declined in 2019 and are forecast to decline again in 2020.

The outlook for residential construction spending has improved slightly. Previous forecast had residential spending in 2019 down 6% and 2020 up only 2%. That’s been revised to now forecast 2019 down 4.5% and 2020 up 5%. Spending holds steady in 2021.

If spending is increasing 3%/year at a time when inflation is 5%/year, then real volume is declining. In the last two years, spending increased only 3%, but construction inflation totaled 9%, therefore

in two years, real volume declined by 6%, yet jobs increased by 7.5%.

Since early 2018, jobs have been increasing while construction volume is declining. The volume of work in the last two years does not support jobs growth.

Volume, spending adjusted for inflation in Constant 2017$

Spend Sector 2015-2021 1-4-20.JPG

Nonresidential Buildings will post declines in volume in 2020 & 2021. Residential volume gains 1% in 2020 but slips again in 2021. Non-building Infrastructure will increase volume about 3%/year. Overall, total construction volume declined in 4 of the last 6 quarters and is forecast to drop slightly in 2 or 3 quarters in 2020.

One of the best predictors of construction inflation is the level of activity in an area. When the activity level is low, contractors are all competing for a smaller amount of work and therefore they may reduce margins in bids. When activity is high, there is a greater opportunity to bid on more work and bids can be higher. The level of activity has a direct impact on inflation.

Volume declines should lead to lower inflation as firms compete for fewer new projects. However, if jobs growth continues while volume declines, then productivity continues to decline and that will add to labor cost inflation.

Jobs vs Volume growth set to base year 2011

Jobs vs Volume 2015-2020 monthly 1-10-20

Average long-term nonresidential buildings inflation excluding recession years is 4.2%.

Average long-term (30 years) nonresidential construction cost inflation is 3.5% even with any/all recession years included.

Nonresidential buildings cost inflation for 2018 and 2019 averaged 5%. It’s predicted closer to 4.5% for 2020 and 4% for 2021.

Residential buildings cost inflation for 2018 and 2019 averaged 4%. It’s predicted at 3.75% for 2020 and 2021.

BCI 2005-2022 12-9-19


For more on the 2020 Forecast see these

2020 Construction Spending Increases, but Volume is Down

Expect Construction Jobs Growth to Slow in 2020

Construction Starts > Cashflow > Backlog > Spending

The path from construction starts to spending is not direct and not quite as simple as you might think. Spending is the market activity measure that drives all construction economics, so that’s where we need to get too. With an appropriate modeling technique we can get from new starts to predicted spending in a few steps.

Starts CF 2015-2020 11-27-19

New Construction Starts (construction starts referred to here is Dodge Data & Analytics New Construction Starts) is excellent data for forecasting. The following forecast is entirely developed from starts data. No actual spending is incorporated into this forecast. The purpose is to show that using the data properly can produce an accurate forecast.

The starts data is a survey. As in any survey, starts represents a portion of new construction activity. Study shows the survey size varies with each market from about 40% to 70% of actual. Starts data captures a share of the total market or a portion of all construction, on average about 60% of all construction.

The easiest way to understand this is to compare total annual construction starts to total annual spending. National construction starts from 2016 to 2019 range from $750 billion/year to $800 billion/year, while spending in this period ranges from $1,200 billion/year to $1,300 billion/year. From this we see starts data captures a share of about 60% of the total construction market.

The total starts survey averages about 60% of the actual market. In this analysis every market is adjusted by its own individual market share factor. The adjusted starts represent the full amount of starts that would generate the full amount of spending.

To predict spending activity from new construction starts, the starts data must be spread over time using appropriate cash flow curves. On average about 20% of new construction starts gets spent within the year started, 50% is spent in the next year and 30% is spent in years three and four. The cash flow curves used in this model are specific to each market type and can vary from the average. 

Applying a market survey factor to develop full magnitude of spending and an expected duration for all starts, depending on market type, to produce a forecast cash flow from starts data, the predicted pattern of spending is developed. The factors have been shown to produce a reliable prediction of total future market activity.

Forecast Summary Table National 10-14-19

Backlog at the beginning of the year or new starts within the year does not give an indication of spending within the year. New starts within the year could contribute spending spread out over several years. Total cash flow in the year, or spending, could include cash flow from projects that started or entered backlog years ago.

Backlog increases if new starts during the year is greater than spending during the year. However, an increase in backlog does not necessarily indicate there will be an increase in market activity. An increase in backlog could represent a level rate of market activity, but for a longer duration.

Cash flow provides the best indicator of how much and when spending will occur. Cash flow from all previous starts gives a prediction of how spending will change monthly from all projects in backlog. Cash flow totals of all jobs can vary considerably from month to month, are not only driven by new jobs starting but also old jobs ending, and are heavily dependent on the type, size and duration of jobs.

Total of all national construction starts increased every year since 2008. New starts slowed to +2% in 2018 and are forecast at a potential decline of 0.2% in 2019. Backlog is still up leading into 2020 but after that starts and backlog are forecast to remain flat or decline over the next few years. Total spending declines in 2022. However, as the next tables will show, work distribution is uneven with residential declining and nonresidential up.

Forecast Total All Markets Table National 10-14-19

Nonresidential Buildings starts (excluding Terminals) reached a new high every year since 2009. The last three years starts are up 3% to 4% per year. Every market posted increases in 2017 and 2018. Only Commercial/Retail declined in 2019. The largest increases over the last two years were Educational and Office Buildings. Spending is still strong in 2020 but then with the slowdown in starts forecast in 2020, backlog growth stalls and spending slows in 2021-2022.

75%-80% of all Nonresidential Buildings spending within the year will be generated from projects that were booked in starting backlog at the beginning of the year.

CF Forecast NonResidential Table National 10-14-19

Nonbuilding Infrastructure markets total spending amounts to only about 70% of nonresidential buildings markets. The largest infrastructure markets are Highway/Bridge and Power but the largest increases in new starts recently are in Transportation (including all terminals) and Environmental Public Works. Transportation starts are up 25% in the last last three years and backlog to start 2020 is up 80%. Public Works starts are up 22% and backlog is up 30%

Nonbuilding Infrastructure starts can be erratic with a long pattern of up then down years. Starts (including Terminals) gained only 2% in 2019 but that is only low because Power, the largest market overall saw starts decline by 7%. Total infrastructure starts are at an all-time high.

CF Forecast NonBuilding Table National 10-14-19

Infrastructure backlog peaks in 2020 and remains high into 2021. Spending increases are in the 6% to 8% range at least for the next two years. Infrastructure projects typically have the longest duration. Projects contribute spending sometimes up to 5 or 6 years. The largest spending increases in 2020 are in Transportation and Highway projects.

The Residential table shows that most of the spending in any year is cash flow from new starts. For short duration residential spending, single-family residential and renovations work, approximately 75% of the spending occurs in the year of the starts and 20% in the following year.

Forecast Residential Table National 10-14-19

For long duration residential spending, typical of multifamily residential, approximately 50%-55% of the spending occurs in the year of the start, 35%-40% in the next year and only 5%-10% occurs two years out.

Only 25% (for short duration SF and Reno) to 50% (for longer duration MF) residential spending within the year comes from work that was booked in backlog at the beginning of the year. The performance of residential spending in the year is very much dependent on new starts.

The level of activity has a direct impact on inflation. When the activity level is low, contractors are all competing for a smaller amount of work and therefore they may reduce bids. When activity is high, there is a greater opportunity to bid on more work and bids can be higher.

Residential construction saw a slowdown in inflation to only +3.5% in 2015. However, the average inflation for six years from 2013 to 2018 was 5.5%. It peaked at 8% in 2013. Residential construction spending dropped an unexpected 6% in 2019 and after adjusting for inflation that is a 10% decline in construction volume. Typically, large declines in volume are accompanied by declines in inflation. National average residential construction inflation for 2019 is now at 3.8%. 2020 is forecast at 3.75%.

Nonresidential Buildings indices have averaged 4.4% over the last five years and have reached over 5% in the last three years. But spending slowed dramatically in 2019. This forecast indicates spending in most nonresidential buildings markets will gain little in 2019, the slowest rate of growth post-recession. However, new starts in 2018 and 2019 boosted backlog and 2020 spending will post the strongest gains in four years. Strong gains in spending historically has led to accelerated inflation. National average nonresidential buildings construction inflation for 2019 is now at 4.8%. 2020 is forecast at 4.2%.

Construction Statistics – Behind The Headlines

Examples of how commonly reported construction data can often be misused – Construction Spending and Construction Starts


Construction Grew $41 billion, 3.3%, from 2017 to 2018

An increase in construction spending is often referred to as growth for the industry, but that is incorrect. Construction spending measures the change in the dollar value of work performed, not the volume of work performed.

Crate of Apples

The difference between spending (or revenue) and volume can be explained by a simple example, the Crate of Apples. A farm stand sold a crate of apples last year for $100. Costs have gone up. Today the same size crate of apples sells for $110. Farm stand revenues increased 10%, but the amount of business volume did not increase. Volume of sales is still one crate of apples. All the increase in revenue was inflation.

The $41 billion increase in construction spending from $1.266 trillion in 2017 to $1.307 trillion in 2018 is a 3.3% increase. However, construction inflation for that period averaged 4.7%. Construction inflation adds only cost, not volume, to the amount of work. Construction spending is measured in current dollars, actual dollars spent within the year in the value that year. Construction volume is measured in constant dollars, adjusted for inflation, so any and all years can be compared to each other.

Real construction volume adjusted for inflation actually decreased 1.4% from 2017 to 2018.

Total Construction volume, after accounting for inflation, has been down for five of the last six quarters. Construction volume peaked from Q1 2017 to Q1 2018, is now down 6% from the 2018 peak.

Spend current vs constant 2019 10-3-19

Construction volume is not directly reported. It is not a commonly referenced industry measure reported in the news. But it is a more important indicator of activity in the industry than spending. Volume is found only through analysis of spending and inflation data.

Another common misrepresentation using spending data relates to jobs growth. Jobs growth is often compared to spending growth where a 3% to 4% increase in jobs from year to year is substantiated if we have a similar 3% to 4% growth in spending. However, current $ spending is not yet adjusted for inflation and does not represent growth in real volume of work. Jobs must be compared to volume. Real volume increases are represented by constant $, or construction spending adjusted for inflation.

In the last 2 years jobs have increased by about 8% but real construction volume has decreased by about 6%. In recent years, construction volume has not supported jobs growth.

Jobs vs Volume 1991-2019 10-3-19


Construction Starts Predict Changes in Spending

Two very important criteria must be known about new construction starts in order to properly predict spending.

1st – To predict spending from new starts, the starts data must be spread over time using an appropriate cash flow curve. A simple illustrative spending pattern for nonresidential buildings starts, or a typical cash flow curve, for total starts within a year is: 20% of the revenue gets spent in the 1st year, 50% in the 2nd year and 30% in the 3rd year. This shows predicting spending in any given year is dependent on several previous years of starts.

Starts vs Spending Cash Flow Illustrated 10-5-19

Multi-billion $ highway projects, manufacturing facilities, power projects and transportation terminals often have much longer duration cash flow curves. In other words, if your intent is to predict construction spending in 2019, you need to know what starts were at a minimum in 2017 and 2018, and in many cases back to 2016 or even 2015.

Starts spread over time with cash flow curves predict spending.

Starts CF 2015-2020 11-27-19

2nd – For new construction starts survey sample to be used to compare to itself from year to year to predict growth in spending, sample size must be known. Starts data captures a share of the total market or a portion of all construction, on average about 60% of all construction. The easiest way to see this is compare total construction starts to total spending. Starts from 2016 to 2019 range from $750 billion to $800 billion while spending in those years ranges from $1,200 billion to $1,300 billion. From this we see starts capture a share of the total market. Any time a survey of a total population is used to forecast the total, the survey share of total must be considered.  If sample size is not constant, the apparent growth in starts does not all reflect real growth in spending.

Amusement/Recreation is an example that shows starts that generate a predicted cash flow pretty well balanced with actual spending from year to year. The share of starts in the survey is fairly consistent never varying from 63% to 66% from year to year.

Starts SHARE Amuse 10-5-19

Office provides an example of variation in sample share of total. Starts generate predicted cash flow that increased substantially from 49% to 57% and remained higher compared to actual spending.

Starts SHARE Office 10-5-19

Office starts increased from $21 billion in 2013 to $50 billion in 2019. This data generates the predicted cash flow that is compared to actual spending. To predict total spending from unadjusted starts, unadjusted starts CF$ are factored up (divided by) share of total market. If the share of market captured in the survey remained constant then the predicted spending would remain close to 50%. 

CF$ Predicted/Actual shows that Cash Flow Share of actual spending was 48%-50% for several years but then jumped to 56%-57%. The predicted cash flow generated from the increase in starts is not entirely representative of an increase in spending but represents the combined value of the expected increase in spending and an increase in share of market data captured.

Starts cash flow and starts survey share of total spending are never directly known or published. These factors are found only through analysis of the data.

The Educational market data shows a similar situation as Office data. Starts generate predicted cash flow that increased substantially compared to actual spending.

Starts SHARE Educat 10-5-19

Starts data generate predicted cash flow to forecast spending. This requires tracking share of total market captured in the starts survey data to account for any growth in the market share captured vs growth in predicted spending.


Construction Starts Cash Flow vs Spending

This plot overlays two data sources, starts cash flow and spending. For each of the three major market sectors, Residential, Nonresidential Buildings and Non-building Infrastructure, a light colored line and a dark line are plotted. The light line is the expected direction spending will move estimated from the monthly cash flows from Dodge Data construction starts data. The dark line is the movement in actual spending. All the nonresidential buildings and infrastructure data is the sum of all the markets within the sectors. This plot is not generated for each market.

Starts CF 2015-2020 8-8-19

The actual spending should follow a pattern that is similar to the direction of movement predicted by the estimated spending. If the patterns are similar, it is an indication that the forecasting tools are generally accurate. The thing to watch for is that the direction of movement was predicted accurately. For instance, the Non-building Infrastructure lines show pretty well from Jan 2017 through June 2019 that the starts data estimated the direction spending would move. To a lesser degree, Nonresidential Buildings shows correlation. Residential spending long term agrees with the estimate from starts cash flows, but spending is much more smoothed and actual spending inflection points seem to lag the estimated.


Reliability of Predicted Construction Forecast Data is always foremost in the thoughts of an analyst. Cash flow models provide for approximately 75% to 80% actual jobs data in the predicted spending for the forecast 12 months out. For next month’s forecast we have 96%-97% actual jobs data in the forecast, only missing jobs that start within the next 30 days. Reliability trails off each month. So, this is useful as a way to check the forecasting model. Essentially, this provides a check on the method I use for forecasting spending. It lends credence to the validity of the future forecast.

The forecast monthly changes in cash flow generated by the starts data are used to predict future spending in all Construction Analytics spending forecasts.

(note 10-3-19: major revisions to starts data cash flow substantially reduces forecast spending in both 2019 and 2020. These revisions won’t be posted until November. Largest downward revisions 2019, Residential -15, Highway -10. Largest downward revisions 2020 Residential -23, Manufacturing -10, Power -12, Highway -12) 

11-25-19 table updated

Spend Forecast 2018-2019-2020-2021 11-19-19

July 2019 Construction Briefs

7-26-19

Total all construction jobs including supervisory jobs is now only 3% below pre-recession high. However, volume of work adjusted for inflation is still 18% lower than pre-recession high. From the 2006-2007 pre-recession peak until now, non-supervisory jobs have recovered to within 6% of the previous high and supervisory jobs are now 7% higher than pre-recession high. 

Residential Construction jobs are up 78,000 in the past year, ~3% growth in jobs, but residential construction volume in the same period dropped 8%. Considering residential construction spending is down 8% ytd, residential construction inflation is up minimum 2-3%, so volume is down 10%-11%, and residential jobs are up 3%, 2019 will be the worst year for residential productivity declines since the period 2006-2009.

Rider Levett Bucknall national average construction cost inflation is currently up 2.6% for the 1st 6 months 2019, 5.2% annualized. It’s up 5.7% year over year. This is in line with Turner Construction’s quarterly Building Cost Index, also up 2.6% year-to-date, annualized 5.2%, and up 5.5% year over year. These are both nonresidential building final cost inflation indices.

The PPI average Final Cost of 4 Nonresidential Trades for the 1st 6 months is up 2.9%, annualized at 5.8%. The PPI average Final Cost of 5 Nonresidential Buildings for the 1st 6 months is up 2.6%, annualized at 5.2%.

Construction Analytics current nonresidential building cost index for 2019 is 5.0%.

Forecasting construction spending in 2019 up less than 2%, and composite construction inflation of 4.2%, real volume for 2019 will be down about 2.5%.

The share of total residential construction spending on renovations remained fairly stable from 2013 thru 2018 between 34% and 37% at an average rate of 36%, substantially lower than 2009-2012 when it ranged between 42%-48% and averaged 45%. The 2019 share of residential spending on renovations is forecast to reach 40%. Only 50% of all spending is single-family residential. Keep that in mind when referencing residential jobs to housing units.

With the release of data for July 2019 on September 3, 2019, un-adjusted construction spending data will be revised back to January 2013. Expect revisions to 2018 construction spending, in particular, I expect significant revisions to RESIDENTIAL spending in 2018. Residential construction spending in 2018 recorded 5 individual months in which the spending reported by Census varied from the statistical monthly avg by greater than 3 standard deviations. In 19 years, the only time reported spending has ever exceeded 3 standard deviations from the normal statistical monthly average was during the 2006-2009 recession. I expect all of these to be revised away.

Due to the delay in release of construction spending revisions, which would normally have been published July 1st, my midyear construction forecast will be delayed. There’s more to it than just updating 2018 spending. The spending data helps prove the new starts data, which then supports the forecast. Preparation of the midyear forecast begins after the release of the data update September 3rd.

What’s Happening In Construction Starts? YTD total is down 8% from 2018, BUT

These markets recently posted the best construction starts 12 month totals ever over the noted period. Much of the spending from these starts occurs in 2020.

  • Manufacturing from Jun18>May19
  • Office May18>Apr19
  • Educational Jun18>May19
  • Public Works May18>Apr19

These very long duration markets posted best new starts ever; Highway Dec 17>Nov18, up 25% compared to the prior 12 months which was the the 2nd best 12mo ever, with peak spending from those starts expected in 2020, and Transportation (2yrs) Jan17>Dec18, up 25% from the prior 2 years, but with the peak 12 months up 35% from the prior 2 years, with peak spending 2020.

2020 Starting Backlog for these six markets will be up an average of 25%, at the highest starting backlog ever for each of the six markets.

Non-building Infrastructure construction starts increased 46% over the last 5 years (since lowpoint Q2 2014). Non-building Infrastructure spending increased 7% in 2018 and is forecast to increase 13%/yr for both 2019 and 2020. Big increases in Highway, Transportation and Public Works.

The markets dragging on construction spending are Commercial/Retail, Power and Residential. My forecast shows Commercial Retail declining from now through 2020, but hidden in that is the fact that Stores are down but Warehouses are up; Power which slows to finish flat next year; Residential construction starts peaked in Q1 2018. Year-to-date 2019 starts are down 9% from 2018. Although YTD spending is down 8%, we will see some improvement in the 2nd half 2019. Residential spending should finish down 5% in 2019 and shows very little improvement in 2020.

Spend Sector 2015-2019 8-5-19

Keep in mind the affect if inflation. If spending in a particular market drops 5% AND there is 5% inflation, the real market volume is down 10%. All nonresidential inflation indices are currently between 4% and 5% and are expected to remain near 4% in 2020. Residential inflation is currently near 3.5%.

Construction volume (spending inflation adjusted) hit a 3-year low in Nov-Dec-Jan. Annual volume since Dec 2015 increased 8% but then dropped 7%. Volume for the last 2 years increased less than 1%. Most of the decline to the low was residential. Nonresidential buildings and Non-building Infrastructure were flat.  All three sectors are expected to improve slightly in the 2nd half 2019, although real residential volume will still be down 9% in 2019 and 2% in 2020. Nonresidential Buildings and Non-building Infrastructure will post 6% and 9% increases in volume for 2020.

Construction Markets 2019 YTD Volume +/-   (Volume = Spending – Inflation)

  • TOTAL ALL -5%
  • Residential -12%
  • Manufacturing +5%
  • Office +4%
  • Lodging +3%
  • Amusement/Rec +4%
  • Public Safety +4%
  • Highway +8%
  • Transportation +3%
  • Public Works +12%
  • Commercial -13%
  • Educational -3%
  • Healthcare -5%
  • Power -4%
  • Communication -13%

ALSO SEE

May Construction Spending Report -Changes Since Dec 2019 Forecast

Notes on April 2019 Construction Spending Report

What If No Future Starts?

6-27-19

What if there were no new construction starts beyond today?

What if the last new construction starts recorded for May (released by Dodge June 21) were the last to be posted and once those projects reached completion there would be no more work?

Of course this is a totally unlikely scenario, but deleting all future predicted starts allows to perform an important test. All the construction starts recorded as of today make up the backlog, and eventually that backlog will run out. So, if the new starts spigot was turned off today, how much spending would remain for 2019, 2020 and beyond? (For use later, new construction starts recorded through May generally equal an average of 40% of all starts expected each year).

The questions then are: How dependent is the spending forecast on construction backlog? How dependent is the construction spending forecast on new construction starts? What magnitude of miscalculation in the new starts forecast would be imparted to the spending forecast?

Single-family residential projects can take as little as 6 to 9 months to reach completion, multi-family perhaps twice as long. For the average nonresidential building, completion would be reached in about 24 months, but some large industrial projects will take three years or more. For some of the airport, highway and rail expansion mega-projects, the cash flow schedule of spending will take four to eight years to reach completion.

An average of ten years of monthly cash flows produces an average spending schedule for the various construction market sectors. Recognize that starts are posted every month, so January starts have twelve months of spending in the 1st year while projects that start in December have only one month of spending in the 1st year.

Residential project starts net about 65% of money spent in the 1st year, the year started, 30% spent in the following year and 5% spent in the third year, or 65-30-5. Although each type of nonresidential work has a more specific cash flow schedule, the average for nonresidential buildings is 20% spent in the year started, 50% in the second year and 30% in the third year, or 20-50-30. Very long duration infrastructure projects have a spending distribution on average that looks like 15-30-30-15-10.

Residential projects have the shortest schedule to completion. Work flow needs continual replenishment from new starts to support spending. The amount of work in backlog today would support only two thirds of anticipated 2019 spending and less than 10% of 2020 spending.

All Nonresidential buildings type currently have enough work in backlog to support 90%-93% of the total forecast spending in 2019. Current backlog would support only 50% of the total spending forecast for 2020. There’s only enough to support 10%-20% in 2021.

Power and Highway backlog as of today would support 95% of the total forecast spending in 2019 and 70%+ in 2020. Because these are long duration projects, there is enough in backlog today to support 40% of spending in 2021.

That’s a lot of good facts, but how can we use that information to perform an important test?

Let’s use the average nonresidential building for an example. For this example, let’s try to determine the validity of our 2019 forecast based on what we have in backlog today. New starts through May is about 40% of total starts expected in the year. Backlog through May supports 92% of spending in the current year. Spending in any given month has cash flow from an average of the previous 24 months of project starts, so the average of large numbers reduces potential error from backlog. The validity of our annual spending forecast is dependent on whether or not we correctly predicted the remaining 60% of starts for the year, and those starts support 8% of the spending forecast.

Therefore if we incorrectly forecast the remaining 60% of starts by 25%, then we incorrectly forecast total annual spending by 25% x 8% = 2%.

For the 2020 forecast, the math gets just a little more complicated. Remember we stated earlier that the typical spending schedule for nonresidential buildings is 20-50-30. So 20% of 2020 spending comes from new starts in 2020. Only 80% of 2020 spending comes from work in backlog at the start of the year. Based on what we have in backlog today, new starts through May 2019 supports 50% of 2020 spending. We are dependent on the expected new starts in 2019 to get us up to 80% of the expected spending in 2020.

We are expecting 60% more in starts in 2019 and that will support the currently missing 30% of 2020 spending. If we incorrectly forecast the remaining 60% of starts by 25%, then we incorrectly forecast total annual spending for 2020 by 25% x 30% = 7.5%.

Also for 2020, since 20% of all spending within the year comes from new starts within the year, if we incorrectly forecast 2020 new starts by 25%, then we incorrectly forecast total annual spending for 2020 by 25% x 20% = 5%.

I’ve posed this scenario by asking what would happen if we incorrectly forecast the remaining starts by an error of 25%. That would be a huge error, not very likely to occur. I’ve been tracking Dodge Data & Analytics construction starts for more than 10 years and have seen enough data to expect that by mid-year the unanticipated error in forecast starts for the end of the year might be more on the order of 5% to 10%, not 25%. And in fact, historically, revisions to year end starts data is usually UP, not down.

So, by deleting all remaining forecast starts data, we see the spending forecast based on cash flow of new starts would require a very large error in the starts forecast to translate into a large error in the spending forecast. If we apply a more reasonable and yet still conservative error of 10% in all projections of future starts, the forecast for 2019 spending would be off by less than 1% and the forecast for 2020 off by a total of 5%.


Construction Starts – Behind the Headlines

New Construction Starts data represents a share or a portion of all construction, on average about 60% of all construction. Dodge Data starts totaled approximately $740 billion and $785 billion for 2016 and 2017. Total construction spending was $1,246 billion in 2017 and $1,300 billion in 2018. What happens if within individual markets the share of information collected in the starts data is not constant from year to year?

Office starts increased by an average of 20%/year from 2012 to 2015. Spending increased by 20%/year from 2013 to 2016. But then in 2016, starts increased 31% and spending in 2017 turned to a 1% decline. 2018 spending gained only 10%. That was unusual and unexpected since 2016 starts indicated a very large increase in spending the following year.

Growth in starts can signify one of two things; future growth in spending, or growth in capturing a larger share of the market. To find share of market captured, starts need to be compared to the cash flow over the time for which those starts will be spent. Typical cash flows predict 20% gets spent in the year started, 50% in the following year and 30% in the 3rd year.

For the period 2011-2015, office starts compared to the value of cash flow over the next 3 years stayed within a range of 45% to 50% of total spent. For 2016 starts, the share of starts compared to cash flow of those starts jumped to 60%. In other words, the growth in spending in 2017 and 2018 did not correspond to the huge growth in starts in 2016. The 31% growth in 2016 starts did not produce future growth in spending but may have mostly represented growth in capturing a larger share of the market.

Analysis shows similar activity in Transportation starts versus spending and to a lesser extent is several other markets.

Starts vs Spending Cash Flow Offc Trans 4-22-19

Construction Starts Data can vary year to year as a share of total market activity. Commonly used to predict future spending, the share of market captured in the starts data, if not consistent, can skew any use to forecast spending. Starts share of market must be analyzed before starts can be used to forecast future spending.

How to Use Construction Starts Data

New Construction Starts data is published monthly by Dodge Data and Analytics. Starts data captures a share of the total market or a portion of all construction, on average about 50% to 60% of all construction. Changes in sample size can introduce potential errors in forecast when using starts to predict construction spending.

In any survey, if sample size remains constant, let’s say at 50% of actual output, but survey response increases 5%/year, then that reflects output should increase at 5%/year. However, if survey response increases at 5%/year but sample size is increasing at 3%/year (50%, 53%, 56%, 59%, etc.) then actual output should increase at only 2%/year.

For a survey sample to be used to compare to itself from year to year to predict growth in spending, sample size must remain constant from year to year. If it is not constant, the apparent growth in starts does not all reflect real growth in spending.

It is impossible within a single year to verify if the current market share captured is constant with previous year sample size. The sample period of data is a year of new starts. To find out if the sample size is consistent, the sample must be compared to actual spending from starts from that period. Starts from any given year get spent over a period of the next 2 to 4 years. It takes several years to see the pattern of starts sample size versus actual spending. 

An average spending pattern for nonresidential buildings starts, OR A TYPICAL CASH FLOW CURVE, for any given year is: 20% of the revenue gets spent in the year started, 50% in the next year and 30% in the 3rd and 4th year. Multi-billion $ highway projects, manufacturing facilities, power projects and transportation terminals would have much longer duration cash flow curves. In other words, if you desire to predict construction spending in 2019, you need to know what starts were at a minimum in 2017 and 2018, and in many cases back to 2016 or even 2015.

2018 construction starts do not provide enough information to predict 2019 spending.

If starts survey sample size varies from year to year, it’s possible some of the spending growth anticipated from new starts may not represent growth in real volume of future work but could simply represent a change in sample size. Potential significant variations in sample size are seen in the data and may cause errors in the forecast.

Here are some examples. In the following table the line item “starts vs actual cash flow $” uses cash flow curves unique to each type of construction. For instance, in Office and Educational the spending curve is close to the average 20%/50%/30% as described above. That means 2015 starts is compared to a cash flow curve that spreads spending of 2015 starts over the next three years by 20%/50%/30%.

Starts vs Spending Cash Flow 3-2-19

In the Educational data we see it is unusual that Starts and Backlog continued to grow for five years but that same rate of growth was not reflected in actual spending. From 2013 to 2018 new starts increased more than 60% but spending for the period of those starts (97% gets spent between 2014-2020) increased only 30%. That would seem to indicate a very large volume of work is growing in backlog, and spending, at some point, should boom and remain high for an extended period. But the cash flow model is not in agreement.

A possible explanation is the sample survey of new starts has been increasing, so not all the starts growth for five years represents growth in new work. Some of the increase in starts is simply growth in sample size.

As evidence, Educational starts for the period 2012-2015 averaged just less than 50% sample size of actual total spending. In 2016-2018 the average sample size vs spending was over 60%.


Office Spending increased by 20%/year from 2013 to 2016, but in 2017 it turned to a 1% decline. That was unusual and unexpected since 2016 starts and 2017 backlog had both reached 10-year highs. Highly probable is that the sample size of starts increased dramatically in 2016 and the increase in starts was not all growth in real volume but was partially just a change in sample size, therefore the 2017 spending forecast may have been significantly overstated.

For the period 2011-2015 sample size increased from 45% to near 50% of actual total spending. In 2016, sample size jumped 25%! For 2016-2018 the average sample size vs spending was near 60%.


Transportation Terminals and Rail starts reached record high in 2017, both up 120% after a 35% increase in 2016. Starting Backlog increased 22% in 2017 then jumped 95% in 2018. Spending in 2018 is forecast to finish up more than 20%. However, Transportation sample size of new starts may have increased far more than any other market. Does it all represent a real increase in future spending or is this a good example of a change in sample size?

For the period 2011-2015 sample size increased from 25% to 30% of actual total spending. In 2016, sample size jumped to 40% of actual. In 2017 sample size jumped to 70%!

A large portion of the 2017 increase in starts is expected to be a change in sample size. Starts more than doubled from 2015 to 2017. If all that represented an increase in volume, spending would have doubled from 2016 to 2019. We already have actual spending in hand of more than half of 2017 starts and there is no possible outcome that shows the 125% increase in new starts in 2017 will produce an equivalent increase in spending. Most of the actual spending occurs in 2018 and 2019. For those two years, spending will be up 35%.


Office in 2016 posted a 31% increase in starts, mostly due to Hudson Yards and Vanderbilt Tower in NYC. This appears to have increased the annual share of market captured in the starts for 2016. Overall spending in the following years did not increase. Transportation starts in 2017 posted a 121% increase, but almost all of that can be attributed to an increase in market share captured due to $16 billion in starts for LaGuardia, Orlando and LAX airport work. In a year when several multi-billion $ projects start, the starts data share of market increases. This signifies a change in survey size, not an equally sizable increase in future construction spending.

Starts vs Spending Cash Flow 3-12-19

These examples show that starts share of market captured from year to year are not all consistent and therefore starts compared to previous year should not be used to predict spending directly but that starts sample size must be analyzed before using the data to forecast future spending. Construction Analytics models adjusted starts using unique cash flow curves to predict construction spending for the Economic Forecast published here.

Starts Modeling 3-7-19

%d bloggers like this: