Home » Starts (Page 3)
Category Archives: Starts
Construction Starts > Cashflow > Backlog > Spending
The path from construction starts to spending is not direct and not quite as simple as you might think. Spending is the market activity measure that drives all construction economics, so that’s where we need to get too. With an appropriate modeling technique we can get from new starts to predicted spending in a few steps.

New Construction Starts (construction starts referred to here is Dodge Data & Analytics New Construction Starts) is excellent data for forecasting. The following forecast is entirely developed from starts data. No actual spending is incorporated into this forecast. The purpose is to show that using the data properly can produce an accurate forecast.
The starts data is a survey. As in any survey, starts represents a portion of new construction activity. Study shows the survey size varies with each market from about 40% to 70% of actual. Starts data captures a share of the total market or a portion of all construction, on average about 60% of all construction.
The easiest way to understand this is to compare total annual construction starts to total annual spending. National construction starts from 2016 to 2019 range from $750 billion/year to $800 billion/year, while spending in this period ranges from $1,200 billion/year to $1,300 billion/year. From this we see starts data captures a share of about 60% of the total construction market.
The total starts survey averages about 60% of the actual market. In this analysis every market is adjusted by its own individual market share factor. The adjusted starts represent the full amount of starts that would generate the full amount of spending.
To predict spending activity from new construction starts, the starts data must be spread over time using appropriate cash flow curves. On average about 20% of new construction starts gets spent within the year started, 50% is spent in the next year and 30% is spent in years three and four. The cash flow curves used in this model are specific to each market type and can vary from the average.
Applying a market survey factor to develop full magnitude of spending and an expected duration for all starts, depending on market type, to produce a forecast cash flow from starts data, the predicted pattern of spending is developed. The factors have been shown to produce a reliable prediction of total future market activity.

Backlog at the beginning of the year or new starts within the year does not give an indication of spending within the year. New starts within the year could contribute spending spread out over several years. Total cash flow in the year, or spending, could include cash flow from projects that started or entered backlog years ago.
Backlog increases if new starts during the year is greater than spending during the year. However, an increase in backlog does not necessarily indicate there will be an increase in market activity. An increase in backlog could represent a level rate of market activity, but for a longer duration.
Cash flow provides the best indicator of how much and when spending will occur. Cash flow from all previous starts gives a prediction of how spending will change monthly from all projects in backlog. Cash flow totals of all jobs can vary considerably from month to month, are not only driven by new jobs starting but also old jobs ending, and are heavily dependent on the type, size and duration of jobs.
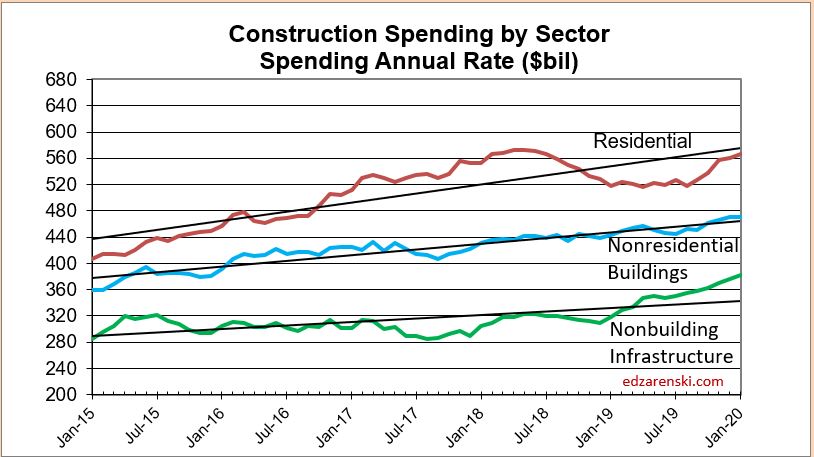
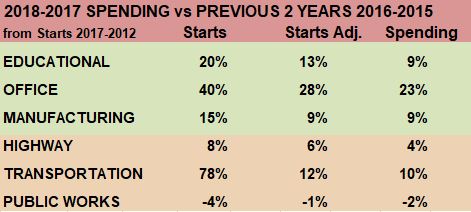
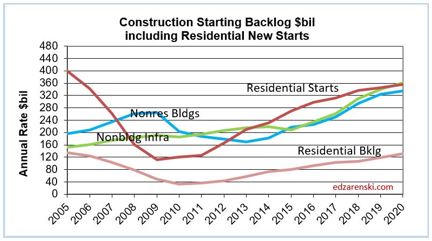
Total of all national construction starts increased every year since 2008. New starts slowed to +2% in 2018 and are forecast at a potential decline of 0.2% in 2019. Backlog is still up leading into 2020 but after that starts and backlog are forecast to remain flat or decline over the next few years. Total spending declines in 2022. However, as the next tables will show, work distribution is uneven with residential declining and nonresidential up.

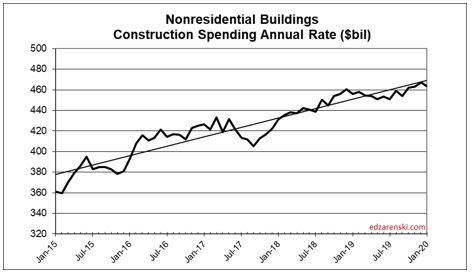
Nonresidential Buildings starts (excluding Terminals) reached a new high every year since 2009. The last three years starts are up 3% to 4% per year. Every market posted increases in 2017 and 2018. Only Commercial/Retail declined in 2019. The largest increases over the last two years were Educational and Office Buildings. Spending is still strong in 2020 but then with the slowdown in starts forecast in 2020, backlog growth stalls and spending slows in 2021-2022.
75%-80% of all Nonresidential Buildings spending within the year will be generated from projects that were booked in starting backlog at the beginning of the year.

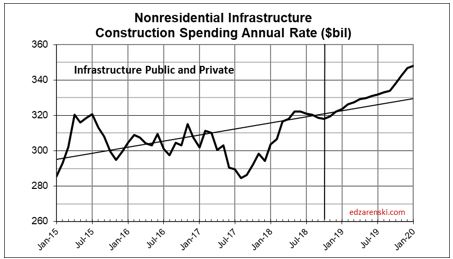
Nonbuilding Infrastructure markets total spending amounts to only about 70% of nonresidential buildings markets. The largest infrastructure markets are Highway/Bridge and Power but the largest increases in new starts recently are in Transportation (including all terminals) and Environmental Public Works. Transportation starts are up 25% in the last last three years and backlog to start 2020 is up 80%. Public Works starts are up 22% and backlog is up 30%
Nonbuilding Infrastructure starts can be erratic with a long pattern of up then down years. Starts (including Terminals) gained only 2% in 2019 but that is only low because Power, the largest market overall saw starts decline by 7%. Total infrastructure starts are at an all-time high.
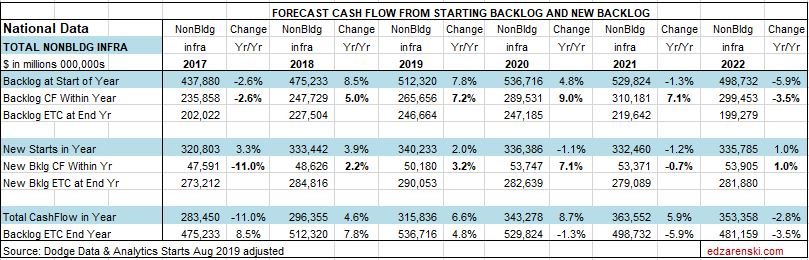
Infrastructure backlog peaks in 2020 and remains high into 2021. Spending increases are in the 6% to 8% range at least for the next two years. Infrastructure projects typically have the longest duration. Projects contribute spending sometimes up to 5 or 6 years. The largest spending increases in 2020 are in Transportation and Highway projects.
The Residential table shows that most of the spending in any year is cash flow from new starts. For short duration residential spending, single-family residential and renovations work, approximately 75% of the spending occurs in the year of the starts and 20% in the following year.
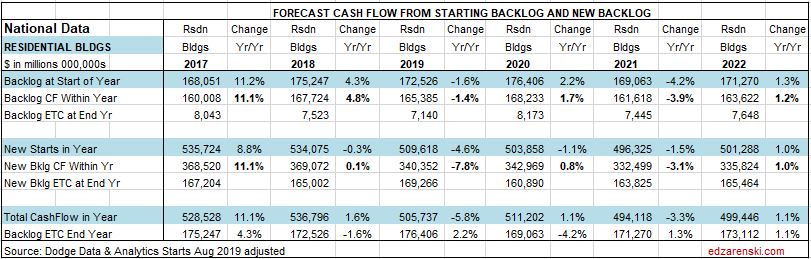
For long duration residential spending, typical of multifamily residential, approximately 50%-55% of the spending occurs in the year of the start, 35%-40% in the next year and only 5%-10% occurs two years out.
Only 25% (for short duration SF and Reno) to 50% (for longer duration MF) residential spending within the year comes from work that was booked in backlog at the beginning of the year. The performance of residential spending in the year is very much dependent on new starts.
The level of activity has a direct impact on inflation. When the activity level is low, contractors are all competing for a smaller amount of work and therefore they may reduce bids. When activity is high, there is a greater opportunity to bid on more work and bids can be higher.
Residential construction saw a slowdown in inflation to only +3.5% in 2015. However, the average inflation for six years from 2013 to 2018 was 5.5%. It peaked at 8% in 2013. Residential construction spending dropped an unexpected 6% in 2019 and after adjusting for inflation that is a 10% decline in construction volume. Typically, large declines in volume are accompanied by declines in inflation. National average residential construction inflation for 2019 is now at 3.8%. 2020 is forecast at 3.75%.
Nonresidential Buildings indices have averaged 4.4% over the last five years and have reached over 5% in the last three years. But spending slowed dramatically in 2019. This forecast indicates spending in most nonresidential buildings markets will gain little in 2019, the slowest rate of growth post-recession. However, new starts in 2018 and 2019 boosted backlog and 2020 spending will post the strongest gains in four years. Strong gains in spending historically has led to accelerated inflation. National average nonresidential buildings construction inflation for 2019 is now at 4.8%. 2020 is forecast at 4.2%.

Construction Statistics – Behind The Headlines
Examples of how commonly reported construction data can often be misused – Construction Spending and Construction Starts
Construction Grew $41 billion, 3.3%, from 2017 to 2018
An increase in construction spending is often referred to as growth for the industry, but that is incorrect. Construction spending measures the change in the dollar value of work performed, not the volume of work performed.

The difference between spending (or revenue) and volume can be explained by a simple example, the Crate of Apples. A farm stand sold a crate of apples last year for $100. Costs have gone up. Today the same size crate of apples sells for $110. Farm stand revenues increased 10%, but the amount of business volume did not increase. Volume of sales is still one crate of apples. All the increase in revenue was inflation.
The $41 billion increase in construction spending from $1.266 trillion in 2017 to $1.307 trillion in 2018 is a 3.3% increase. However, construction inflation for that period averaged 4.7%. Construction inflation adds only cost, not volume, to the amount of work. Construction spending is measured in current dollars, actual dollars spent within the year in the value that year. Construction volume is measured in constant dollars, adjusted for inflation, so any and all years can be compared to each other.
Real construction volume adjusted for inflation actually decreased 1.4% from 2017 to 2018.
Total Construction volume, after accounting for inflation, has been down for five of the last six quarters. Construction volume peaked from Q1 2017 to Q1 2018, is now down 6% from the 2018 peak.

Construction volume is not directly reported. It is not a commonly referenced industry measure reported in the news. But it is a more important indicator of activity in the industry than spending. Volume is found only through analysis of spending and inflation data.
Another common misrepresentation using spending data relates to jobs growth. Jobs growth is often compared to spending growth where a 3% to 4% increase in jobs from year to year is substantiated if we have a similar 3% to 4% growth in spending. However, current $ spending is not yet adjusted for inflation and does not represent growth in real volume of work. Jobs must be compared to volume. Real volume increases are represented by constant $, or construction spending adjusted for inflation.
In the last 2 years jobs have increased by about 8% but real construction volume has decreased by about 6%. In recent years, construction volume has not supported jobs growth.

Construction Starts Predict Changes in Spending
Two very important criteria must be known about new construction starts in order to properly predict spending.
1st – To predict spending from new starts, the starts data must be spread over time using an appropriate cash flow curve. A simple illustrative spending pattern for nonresidential buildings starts, or a typical cash flow curve, for total starts within a year is: 20% of the revenue gets spent in the 1st year, 50% in the 2nd year and 30% in the 3rd year. This shows predicting spending in any given year is dependent on several previous years of starts.

Multi-billion $ highway projects, manufacturing facilities, power projects and transportation terminals often have much longer duration cash flow curves. In other words, if your intent is to predict construction spending in 2019, you need to know what starts were at a minimum in 2017 and 2018, and in many cases back to 2016 or even 2015.
Starts spread over time with cash flow curves predict spending.
2nd – For new construction starts survey sample to be used to compare to itself from year to year to predict growth in spending, sample size must be known. Starts data captures a share of the total market or a portion of all construction, on average about 60% of all construction. The easiest way to see this is compare total construction starts to total spending. Starts from 2016 to 2019 range from $750 billion to $800 billion while spending in those years ranges from $1,200 billion to $1,300 billion. From this we see starts capture a share of the total market. Any time a survey of a total population is used to forecast the total, the survey share of total must be considered. If sample size is not constant, the apparent growth in starts does not all reflect real growth in spending.
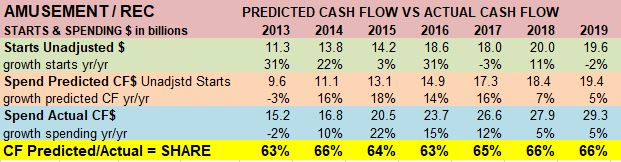
Amusement/Recreation is an example that shows starts that generate a predicted cash flow pretty well balanced with actual spending from year to year. The share of starts in the survey is fairly consistent never varying from 63% to 66% from year to year.
Office provides an example of variation in sample share of total. Starts generate predicted cash flow that increased substantially from 49% to 57% and remained higher compared to actual spending.
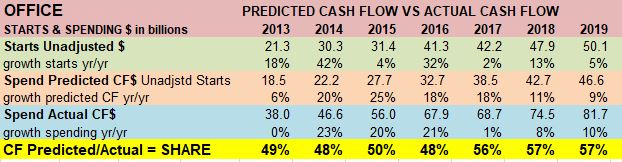
Office starts increased from $21 billion in 2013 to $50 billion in 2019. This data generates the predicted cash flow that is compared to actual spending. To predict total spending from unadjusted starts, unadjusted starts CF$ are factored up (divided by) share of total market. If the share of market captured in the survey remained constant then the predicted spending would remain close to 50%.
CF$ Predicted/Actual shows that Cash Flow Share of actual spending was 48%-50% for several years but then jumped to 56%-57%. The predicted cash flow generated from the increase in starts is not entirely representative of an increase in spending but represents the combined value of the expected increase in spending and an increase in share of market data captured.
Starts cash flow and starts survey share of total spending are never directly known or published. These factors are found only through analysis of the data.
The Educational market data shows a similar situation as Office data. Starts generate predicted cash flow that increased substantially compared to actual spending.
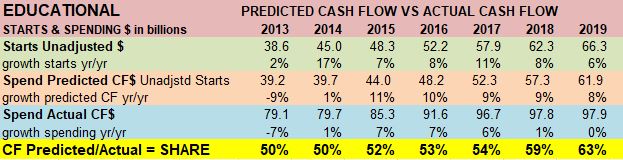
Starts data generate predicted cash flow to forecast spending. This requires tracking share of total market captured in the starts survey data to account for any growth in the market share captured vs growth in predicted spending.

Construction Starts Cash Flow vs Spending
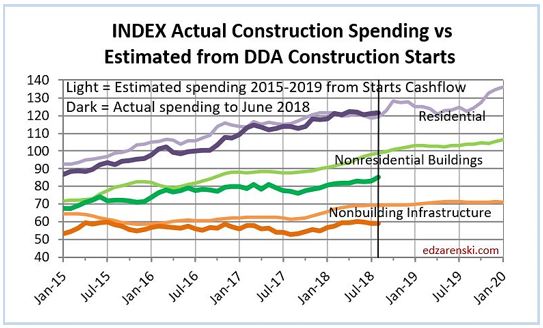
This plot overlays two data sources, starts cash flow and spending. For each of the three major market sectors, Residential, Nonresidential Buildings and Non-building Infrastructure, a light colored line and a dark line are plotted. The light line is the expected direction spending will move estimated from the monthly cash flows from Dodge Data construction starts data. The dark line is the movement in actual spending. All the nonresidential buildings and infrastructure data is the sum of all the markets within the sectors. This plot is not generated for each market.

The actual spending should follow a pattern that is similar to the direction of movement predicted by the estimated spending. If the patterns are similar, it is an indication that the forecasting tools are generally accurate. The thing to watch for is that the direction of movement was predicted accurately. For instance, the Non-building Infrastructure lines show pretty well from Jan 2017 through June 2019 that the starts data estimated the direction spending would move. To a lesser degree, Nonresidential Buildings shows correlation. Residential spending long term agrees with the estimate from starts cash flows, but spending is much more smoothed and actual spending inflection points seem to lag the estimated.
Reliability of Predicted Construction Forecast Data is always foremost in the thoughts of an analyst. Cash flow models provide for approximately 75% to 80% actual jobs data in the predicted spending for the forecast 12 months out. For next month’s forecast we have 96%-97% actual jobs data in the forecast, only missing jobs that start within the next 30 days. Reliability trails off each month. So, this is useful as a way to check the forecasting model. Essentially, this provides a check on the method I use for forecasting spending. It lends credence to the validity of the future forecast.
The forecast monthly changes in cash flow generated by the starts data are used to predict future spending in all Construction Analytics spending forecasts.
(note 10-3-19: major revisions to starts data cash flow substantially reduces forecast spending in both 2019 and 2020. These revisions won’t be posted until November. Largest downward revisions 2019, Residential -15, Highway -10. Largest downward revisions 2020 Residential -23, Manufacturing -10, Power -12, Highway -12)
11-25-19 table updated

July 2019 Construction Briefs
7-26-19
Total all construction jobs including supervisory jobs is now only 3% below pre-recession high. However, volume of work adjusted for inflation is still 18% lower than pre-recession high. From the 2006-2007 pre-recession peak until now, non-supervisory jobs have recovered to within 6% of the previous high and supervisory jobs are now 7% higher than pre-recession high.
Residential Construction jobs are up 78,000 in the past year, ~3% growth in jobs, but residential construction volume in the same period dropped 8%. Considering residential construction spending is down 8% ytd, residential construction inflation is up minimum 2-3%, so volume is down 10%-11%, and residential jobs are up 3%, 2019 will be the worst year for residential productivity declines since the period 2006-2009.
Rider Levett Bucknall national average construction cost inflation is currently up 2.6% for the 1st 6 months 2019, 5.2% annualized. It’s up 5.7% year over year. This is in line with Turner Construction’s quarterly Building Cost Index, also up 2.6% year-to-date, annualized 5.2%, and up 5.5% year over year. These are both nonresidential building final cost inflation indices.
The PPI average Final Cost of 4 Nonresidential Trades for the 1st 6 months is up 2.9%, annualized at 5.8%. The PPI average Final Cost of 5 Nonresidential Buildings for the 1st 6 months is up 2.6%, annualized at 5.2%.
Construction Analytics current nonresidential building cost index for 2019 is 5.0%.
Forecasting construction spending in 2019 up less than 2%, and composite construction inflation of 4.2%, real volume for 2019 will be down about 2.5%.
The share of total residential construction spending on renovations remained fairly stable from 2013 thru 2018 between 34% and 37% at an average rate of 36%, substantially lower than 2009-2012 when it ranged between 42%-48% and averaged 45%. The 2019 share of residential spending on renovations is forecast to reach 40%. Only 50% of all spending is single-family residential. Keep that in mind when referencing residential jobs to housing units.
With the release of data for July 2019 on September 3, 2019, un-adjusted construction spending data will be revised back to January 2013. Expect revisions to 2018 construction spending, in particular, I expect significant revisions to RESIDENTIAL spending in 2018. Residential construction spending in 2018 recorded 5 individual months in which the spending reported by Census varied from the statistical monthly avg by greater than 3 standard deviations. In 19 years, the only time reported spending has ever exceeded 3 standard deviations from the normal statistical monthly average was during the 2006-2009 recession. I expect all of these to be revised away.
Due to the delay in release of construction spending revisions, which would normally have been published July 1st, my midyear construction forecast will be delayed. There’s more to it than just updating 2018 spending. The spending data helps prove the new starts data, which then supports the forecast. Preparation of the midyear forecast begins after the release of the data update September 3rd.
What’s Happening In Construction Starts? YTD total is down 8% from 2018, BUT
These markets recently posted the best construction starts 12 month totals ever over the noted period. Much of the spending from these starts occurs in 2020.
- Manufacturing from Jun18>May19
- Office May18>Apr19
- Educational Jun18>May19
- Public Works May18>Apr19
These very long duration markets posted best new starts ever; Highway Dec 17>Nov18, up 25% compared to the prior 12 months which was the the 2nd best 12mo ever, with peak spending from those starts expected in 2020, and Transportation (2yrs) Jan17>Dec18, up 25% from the prior 2 years, but with the peak 12 months up 35% from the prior 2 years, with peak spending 2020.
2020 Starting Backlog for these six markets will be up an average of 25%, at the highest starting backlog ever for each of the six markets.
Non-building Infrastructure construction starts increased 46% over the last 5 years (since lowpoint Q2 2014). Non-building Infrastructure spending increased 7% in 2018 and is forecast to increase 13%/yr for both 2019 and 2020. Big increases in Highway, Transportation and Public Works.
The markets dragging on construction spending are Commercial/Retail, Power and Residential. My forecast shows Commercial Retail declining from now through 2020, but hidden in that is the fact that Stores are down but Warehouses are up; Power which slows to finish flat next year; Residential construction starts peaked in Q1 2018. Year-to-date 2019 starts are down 9% from 2018. Although YTD spending is down 8%, we will see some improvement in the 2nd half 2019. Residential spending should finish down 5% in 2019 and shows very little improvement in 2020.
Keep in mind the affect if inflation. If spending in a particular market drops 5% AND there is 5% inflation, the real market volume is down 10%. All nonresidential inflation indices are currently between 4% and 5% and are expected to remain near 4% in 2020. Residential inflation is currently near 3.5%.
Construction volume (spending inflation adjusted) hit a 3-year low in Nov-Dec-Jan. Annual volume since Dec 2015 increased 8% but then dropped 7%. Volume for the last 2 years increased less than 1%. Most of the decline to the low was residential. Nonresidential buildings and Non-building Infrastructure were flat. All three sectors are expected to improve slightly in the 2nd half 2019, although real residential volume will still be down 9% in 2019 and 2% in 2020. Nonresidential Buildings and Non-building Infrastructure will post 6% and 9% increases in volume for 2020.
Construction Markets 2019 YTD Volume +/- (Volume = Spending – Inflation)
- TOTAL ALL -5%
- Residential -12%
- Manufacturing +5%
- Office +4%
- Lodging +3%
- Amusement/Rec +4%
- Public Safety +4%
- Highway +8%
- Transportation +3%
- Public Works +12%
- Commercial -13%
- Educational -3%
- Healthcare -5%
- Power -4%
- Communication -13%
ALSO SEE
May Construction Spending Report -Changes Since Dec 2019 Forecast
What If No Future Starts?
6-27-19
What if there were no new construction starts beyond today?
What if the last new construction starts recorded for May (released by Dodge June 21) were the last to be posted and once those projects reached completion there would be no more work?
Of course this is a totally unlikely scenario, but deleting all future predicted starts allows to perform an important test. All the construction starts recorded as of today make up the backlog, and eventually that backlog will run out. So, if the new starts spigot was turned off today, how much spending would remain for 2019, 2020 and beyond? (For use later, new construction starts recorded through May generally equal an average of 40% of all starts expected each year).
The questions then are: How dependent is the spending forecast on construction backlog? How dependent is the construction spending forecast on new construction starts? What magnitude of miscalculation in the new starts forecast would be imparted to the spending forecast?
Single-family residential projects can take as little as 6 to 9 months to reach completion, multi-family perhaps twice as long. For the average nonresidential building, completion would be reached in about 24 months, but some large industrial projects will take three years or more. For some of the airport, highway and rail expansion mega-projects, the cash flow schedule of spending will take four to eight years to reach completion.
An average of ten years of monthly cash flows produces an average spending schedule for the various construction market sectors. Recognize that starts are posted every month, so January starts have twelve months of spending in the 1st year while projects that start in December have only one month of spending in the 1st year.
Residential project starts net about 65% of money spent in the 1st year, the year started, 30% spent in the following year and 5% spent in the third year, or 65-30-5. Although each type of nonresidential work has a more specific cash flow schedule, the average for nonresidential buildings is 20% spent in the year started, 50% in the second year and 30% in the third year, or 20-50-30. Very long duration infrastructure projects have a spending distribution on average that looks like 15-30-30-15-10.
Residential projects have the shortest schedule to completion. Work flow needs continual replenishment from new starts to support spending. The amount of work in backlog today would support only two thirds of anticipated 2019 spending and less than 10% of 2020 spending.
All Nonresidential buildings type currently have enough work in backlog to support 90%-93% of the total forecast spending in 2019. Current backlog would support only 50% of the total spending forecast for 2020. There’s only enough to support 10%-20% in 2021.
Power and Highway backlog as of today would support 95% of the total forecast spending in 2019 and 70%+ in 2020. Because these are long duration projects, there is enough in backlog today to support 40% of spending in 2021.
That’s a lot of good facts, but how can we use that information to perform an important test?
Let’s use the average nonresidential building for an example. For this example, let’s try to determine the validity of our 2019 forecast based on what we have in backlog today. New starts through May is about 40% of total starts expected in the year. Backlog through May supports 92% of spending in the current year. Spending in any given month has cash flow from an average of the previous 24 months of project starts, so the average of large numbers reduces potential error from backlog. The validity of our annual spending forecast is dependent on whether or not we correctly predicted the remaining 60% of starts for the year, and those starts support 8% of the spending forecast.
Therefore if we incorrectly forecast the remaining 60% of starts by 25%, then we incorrectly forecast total annual spending by 25% x 8% = 2%.
For the 2020 forecast, the math gets just a little more complicated. Remember we stated earlier that the typical spending schedule for nonresidential buildings is 20-50-30. So 20% of 2020 spending comes from new starts in 2020. Only 80% of 2020 spending comes from work in backlog at the start of the year. Based on what we have in backlog today, new starts through May 2019 supports 50% of 2020 spending. We are dependent on the expected new starts in 2019 to get us up to 80% of the expected spending in 2020.
We are expecting 60% more in starts in 2019 and that will support the currently missing 30% of 2020 spending. If we incorrectly forecast the remaining 60% of starts by 25%, then we incorrectly forecast total annual spending for 2020 by 25% x 30% = 7.5%.
Also for 2020, since 20% of all spending within the year comes from new starts within the year, if we incorrectly forecast 2020 new starts by 25%, then we incorrectly forecast total annual spending for 2020 by 25% x 20% = 5%.
I’ve posed this scenario by asking what would happen if we incorrectly forecast the remaining starts by an error of 25%. That would be a huge error, not very likely to occur. I’ve been tracking Dodge Data & Analytics construction starts for more than 10 years and have seen enough data to expect that by mid-year the unanticipated error in forecast starts for the end of the year might be more on the order of 5% to 10%, not 25%. And in fact, historically, revisions to year end starts data is usually UP, not down.
So, by deleting all remaining forecast starts data, we see the spending forecast based on cash flow of new starts would require a very large error in the starts forecast to translate into a large error in the spending forecast. If we apply a more reasonable and yet still conservative error of 10% in all projections of future starts, the forecast for 2019 spending would be off by less than 1% and the forecast for 2020 off by a total of 5%.

Construction Starts – Behind the Headlines
New Construction Starts data represents a share or a portion of all construction, on average about 60% of all construction. Dodge Data starts totaled approximately $740 billion and $785 billion for 2016 and 2017. Total construction spending was $1,246 billion in 2017 and $1,300 billion in 2018. What happens if within individual markets the share of information collected in the starts data is not constant from year to year?
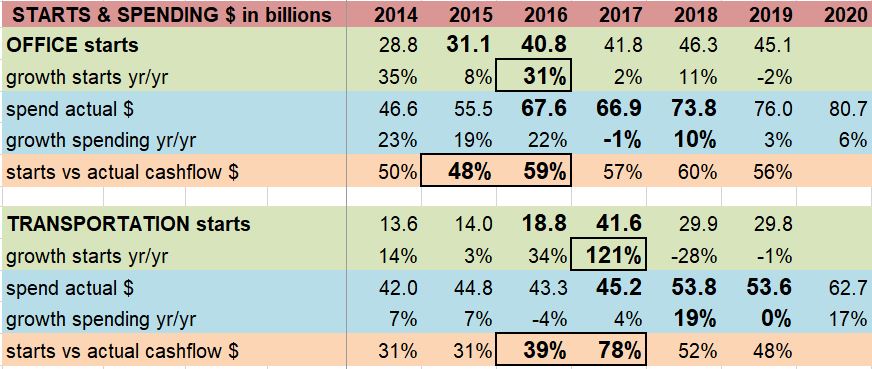
Office starts increased by an average of 20%/year from 2012 to 2015. Spending increased by 20%/year from 2013 to 2016. But then in 2016, starts increased 31% and spending in 2017 turned to a 1% decline. 2018 spending gained only 10%. That was unusual and unexpected since 2016 starts indicated a very large increase in spending the following year.
Growth in starts can signify one of two things; future growth in spending, or growth in capturing a larger share of the market. To find share of market captured, starts need to be compared to the cash flow over the time for which those starts will be spent. Typical cash flows predict 20% gets spent in the year started, 50% in the following year and 30% in the 3rd year.
For the period 2011-2015, office starts compared to the value of cash flow over the next 3 years stayed within a range of 45% to 50% of total spent. For 2016 starts, the share of starts compared to cash flow of those starts jumped to 60%. In other words, the growth in spending in 2017 and 2018 did not correspond to the huge growth in starts in 2016. The 31% growth in 2016 starts did not produce future growth in spending but may have mostly represented growth in capturing a larger share of the market.
Analysis shows similar activity in Transportation starts versus spending and to a lesser extent is several other markets.
Construction Starts Data can vary year to year as a share of total market activity. Commonly used to predict future spending, the share of market captured in the starts data, if not consistent, can skew any use to forecast spending. Starts share of market must be analyzed before starts can be used to forecast future spending.

How to Use Construction Starts Data
New Construction Starts data is published monthly by Dodge Data and Analytics. Starts data captures a share of the total market or a portion of all construction, on average about 50% to 60% of all construction. Changes in sample size can introduce potential errors in forecast when using starts to predict construction spending.
In any survey, if sample size remains constant, let’s say at 50% of actual output, but survey response increases 5%/year, then that reflects output should increase at 5%/year. However, if survey response increases at 5%/year but sample size is increasing at 3%/year (50%, 53%, 56%, 59%, etc.) then actual output should increase at only 2%/year.
For a survey sample to be used to compare to itself from year to year to predict growth in spending, sample size must remain constant from year to year. If it is not constant, the apparent growth in starts does not all reflect real growth in spending.
It is impossible within a single year to verify if the current market share captured is constant with previous year sample size. The sample period of data is a year of new starts. To find out if the sample size is consistent, the sample must be compared to actual spending from starts from that period. Starts from any given year get spent over a period of the next 2 to 4 years. It takes several years to see the pattern of starts sample size versus actual spending.
An average spending pattern for nonresidential buildings starts, OR A TYPICAL CASH FLOW CURVE, for any given year is: 20% of the revenue gets spent in the year started, 50% in the next year and 30% in the 3rd and 4th year. Multi-billion $ highway projects, manufacturing facilities, power projects and transportation terminals would have much longer duration cash flow curves. In other words, if you desire to predict construction spending in 2019, you need to know what starts were at a minimum in 2017 and 2018, and in many cases back to 2016 or even 2015.
2018 construction starts do not provide enough information to predict 2019 spending.
If starts survey sample size varies from year to year, it’s possible some of the spending growth anticipated from new starts may not represent growth in real volume of future work but could simply represent a change in sample size. Potential significant variations in sample size are seen in the data and may cause errors in the forecast.
Here are some examples. In the following table the line item “starts vs actual cash flow $” uses cash flow curves unique to each type of construction. For instance, in Office and Educational the spending curve is close to the average 20%/50%/30% as described above. That means 2015 starts is compared to a cash flow curve that spreads spending of 2015 starts over the next three years by 20%/50%/30%.

In the Educational data we see it is unusual that Starts and Backlog continued to grow for five years but that same rate of growth was not reflected in actual spending. From 2013 to 2018 new starts increased more than 60% but spending for the period of those starts (97% gets spent between 2014-2020) increased only 30%. That would seem to indicate a very large volume of work is growing in backlog, and spending, at some point, should boom and remain high for an extended period. But the cash flow model is not in agreement.
A possible explanation is the sample survey of new starts has been increasing, so not all the starts growth for five years represents growth in new work. Some of the increase in starts is simply growth in sample size.
As evidence, Educational starts for the period 2012-2015 averaged just less than 50% sample size of actual total spending. In 2016-2018 the average sample size vs spending was over 60%.
Office Spending increased by 20%/year from 2013 to 2016, but in 2017 it turned to a 1% decline. That was unusual and unexpected since 2016 starts and 2017 backlog had both reached 10-year highs. Highly probable is that the sample size of starts increased dramatically in 2016 and the increase in starts was not all growth in real volume but was partially just a change in sample size, therefore the 2017 spending forecast may have been significantly overstated.
For the period 2011-2015 sample size increased from 45% to near 50% of actual total spending. In 2016, sample size jumped 25%! For 2016-2018 the average sample size vs spending was near 60%.
Transportation Terminals and Rail starts reached record high in 2017, both up 120% after a 35% increase in 2016. Starting Backlog increased 22% in 2017 then jumped 95% in 2018. Spending in 2018 is forecast to finish up more than 20%. However, Transportation sample size of new starts may have increased far more than any other market. Does it all represent a real increase in future spending or is this a good example of a change in sample size?
For the period 2011-2015 sample size increased from 25% to 30% of actual total spending. In 2016, sample size jumped to 40% of actual. In 2017 sample size jumped to 70%!
A large portion of the 2017 increase in starts is expected to be a change in sample size. Starts more than doubled from 2015 to 2017. If all that represented an increase in volume, spending would have doubled from 2016 to 2019. We already have actual spending in hand of more than half of 2017 starts and there is no possible outcome that shows the 125% increase in new starts in 2017 will produce an equivalent increase in spending. Most of the actual spending occurs in 2018 and 2019. For those two years, spending will be up 35%.
Office in 2016 posted a 31% increase in starts, mostly due to Hudson Yards and Vanderbilt Tower in NYC. This appears to have increased the annual share of market captured in the starts for 2016. Overall spending in the following years did not increase. Transportation starts in 2017 posted a 121% increase, but almost all of that can be attributed to an increase in market share captured due to $16 billion in starts for LaGuardia, Orlando and LAX airport work. In a year when several multi-billion $ projects start, the starts data share of market increases. This signifies a change in survey size, not an equally sizable increase in future construction spending.
These examples show that starts share of market captured from year to year are not all consistent and therefore starts compared to previous year should not be used to predict spending directly but that starts sample size must be analyzed before using the data to forecast future spending. Construction Analytics models adjusted starts using unique cash flow curves to predict construction spending for the Economic Forecast published here.


Track Construction Starts Long Term
12-26-18
Some important points in the Construction Starts data that show how important it is to keep track of long-term trends. The month to month reports can often make the data look much different than the trend. Most recent data here is the November report issued Dec 20 by Dodge Data.
Here’s the spending forecast that shows how starts are impacting construction spending 2019 construction economic forecast nonresidential Dec 2018
Manufacturing construction starts in Nov plunged 71%.
Manufacturing starts in Oct were up 180% and June was up 1300%, 2 of top 5 best months ever. Starts are on track to finish the year up 20%+, 2nd best year ever.
Transportation terminals construction starts in Nov plunged 73%.
Transportation terminals had a blockbuster year in 2017, up 125% with 3 of the best ever monthly starts. Oct 2018 was 4th best starts ever. 2018 will finish as 2nd best year ever.
Amusement/Recreation starts in Nov dropped 18%.
Amusement/Rec starts in October was the 3rd best month ever recorded. Nov is still near one of the best ever. Amuse/Rec starts in 2018 will total the best year ever recorded up 25% from 2017, up 100% in 5 years.
Educational construction starts in Nov dropped 6%.
Educ starts have declined 3 months in a row, but that is from the highest 4 months ever recorded. 2018 construction starts are on track to finish up 13%, the best year ever, averaging gains of 11% a year for last 5 years. Starts from the last five months of 2017 posted the highest 5mo total in at least seven years, 13% higher than the next best 5mo
Healthcare construction starts are down 8% in Nov.
Healthcare starts could finish 2018 down 3%, but on average are up 4%+/year for the last 5 years. Starts are near the all-time high reached last year.
Office construction starts in Nov down just 2%.
Office construction starts declined 4 of last 5 months, but June, Oct and Nov were the 3 best months in 10 years. Office starts are on track to finish 2018 up 15%, best year ever, up over 100% in last 5 years.
Commercial/Retail starts have been increasing every year since 2010 but starts in 2018 are flat vs 2017 Starts are at a peak but after 5 years of 15%-20% growth/year are up only 4% in the last two years.
Commercial starts are seeing strong gains from distribution centers (warehouses which are in commercial spending). The decline in retail stores is being hidden by the increase in warehouses, which are at an all-time high. Stores are down 10% from the peak in 2016. Warehouses are still up only 4% in 2018 but increased 500% from 2010 to 2017.
Highway and Bridge construction starts fell 33% in Nov.
Highway starts in October were the highest since January 2014. Highway starts have increased on average 3%+/year the last 7 years. Starts in 2018 reach an all-time high.
Environmental Public Works includes Sewerage projects, Water Supply and Conservation, or dams, water resource and river/harbor projects. New starts for all these types projects declined from 2014 through 2017. In 2018, through November, Water Supply posted 5 down months, Sewerage post 6 down months and Conservation posted 7 down months. Yet all are forecast to finish 2018 with gains.
More on Construction Starts

2019 Construction Economic Forecast – Summary – Dec 2018
Construction Analytics 2019 Construction Economic Forecast
This Dec. 2018 Construction Economic Forecast analysis addresses New Construction Starts, Inflation, Cash Flow or distribution of construction work over time, Annual Backlog and Spending. New Starts is new work entering Backlog. Cash Flow gives the pattern of Spending. Inflation differentiates between Revenue and Volume. Backlog, which can be referenced to assess expected future Volume and Spending, provides an indication of when Volume occurs or in what year Revenues occur. Starts data is from Dodge Data & Analytics. Spending data is from the U.S. Census Bureau. Jobs data is from the Bureau of Labor Statistics. Inflation data is from the source labeled. Cash flow, Backlog and Inflation forecast data are developed internally. All data in this report is national level data. All forecast data is by Construction Analytics.
NOTE 12-6-18: Dodge Data and Analytics new construction starts for October, released 11-20-18, reached the 2nd highest seasonally adjusted annual rate ever, 2nd only to June 2018. Most spending from these new starts will occur in 2020. U.S. Census construction spending for October posted large reductions to several months of residential spending. Construction Starts for October, the Dodge end-of-year report and October spending, all released between 11-21-18 and 12-3-18 significantly alter this analysis, by far most of the 2019 and 2020 changes are significant reductions in residential spending. See the 2019 Construction Economic Forecast – Nonresidential for detail on all nonresidential and non-building markets
This analysis was edited to include the most recent starts data and the U S Census October spending data.
For a fully formatted PDF of this Report click
2019 Construction Economic Forecast – Summary – Dec 2018
Link to the 2019 Nonresidential Forecast Report
2019 Construction Economic Forecast – Nonresidential – Nov 2018
Summary
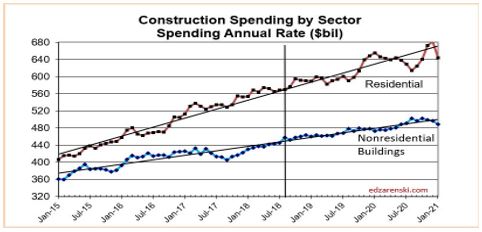
Total of All construction spending is forecast to increase 6.0% to $1.321 trillion in 2018 and 1.5% to $1.341 trillion in 2019. Spending in 2020 is forecast to reach $1.426 trillion.

Nonresidential Buildings construction spending is forecast to increase 5.8% to $444 billion in 2018, dip -0.2% to $443 billion in 2019 and climb 8.9% to $482 billion in 2020. Office (which includes data centers) and Amusement/Recreation support the 2019 but there is downward pressure from slowdowns or timing of cash flow in Manufacturing, Lodging, Healthcare and Educational. Educational, Healthcare, Recreation, Office and Manufacturing all support growth in 2020.
Residential construction spending for 2018 was recently revised down and starts for 2019 are expected flat to down slightly. The forecast is now for an increase of 5.6% to $562 billion in 2018, 0.5% to $564 billion in 2019 and 2.3% to $577 billion in 2020. Although residential spending is still increasing, growth has slowed to less than inflation. Real volume after inflation is declining.
Nonbuilding Infrastructure construction spending is forecast to increase 7.2% to $316 billion in 2018, 5.5% to $334 billion in 2019 and 9.9% to $367 billion in 2020. Transportation spending provides strong growth for the next three years from record new starts in 2017 and the 2nd best year of starts in 2018. Public Works had strong growth in 2018 starts and Highway starts hit a new high in 2018.

In July of the following year the spending data for the previous two years gets revised. Those revisions are always up, although some markets may increase while others decrease. So, even though the current forecast for 2018 is $1,321 trillion, a gain of 6.0%, that will most likely increase.
Dodge Data construction starts are initially anticipated to finish 2018 flat compared to 2017. However, starts are always revised upward in the following year. I expect revisions will show 2018 starts increased by 4% over 2017. Even with revisions, 2018 starts will post the slowest growth since 2011. Starts increased 84% in the period 2012-2017, residential 150% and nonresidential buildings 80%. This forecast includes only a total of 10% new starts growth for the 3-year period 2018-2020.
Starting backlog, currently at an all-time high, increased on average 10%/year the last three years. For 2019 starting backlog is forecast up 10% over 2018. 80% of all Nonresidential spending within the year will be generated from projects in starting backlog. Due to long duration jobs, 2019 nonresidential buildings starting backlog is up 50% in the last 4 years. Current indications are that 2019 backlog will be up 6%-8% across all sectors.
Construction Inflation Indices
When construction is very actively growing, total construction costs typically increase more rapidly than the net cost of labor and materials. In active markets overhead and profit margins increase in response to increased demand. These costs are captured only in Selling Price, or final cost indices.
General construction cost indices and Input price indices that don’t track whole building final cost do not capture the full cost of inflation on construction projects.
Revenue is spending but real volume is spending minus inflation. Outside of recession years, nonresidential buildings construction spending year over year growth dropped below 4% only SIX times in 50 years. The long-term average inflation is 3.75%. Every year that spending dropped below 4% growth, nonresidential buildings real volume declined.
To differentiate between Revenue and Volume you must use actual final cost indices, otherwise known as selling price indices, to properly adjust the cost of construction over time.
Construction Analytics Nonresidential buildings inflation forecast for 2018 is 4.9%. Current reliable inflation forecasts range from 4.7% to 5.6%. Spending needs to grow at a minimum of 4.7% just to stay ahead of construction inflation. Inflation in this sector has been at 4% or higher the last four years.
Selling Price is whole building actual final cost. Selling price indices track the final cost of construction, which includes, in addition to costs of labor and materials and sales/use taxes, general contractor and sub-contractor margins or overhead and profit.
Construction Analytics Building Cost Index, Turner Building Cost Index, Rider Levett Bucknall Cost Index, Beck Cost Index and Mortenson Cost Index are all examples of whole building cost indices that measure final selling price of nonresidential buildings only. The individual average annual growth for all these indices over the past 4-years is 4.6%/year.
Producer Price Index (PPI) for Construction Inputs is an example of a commonly referenced construction cost index that does not represent whole building costs. The PPI tracks material cost at the producer level, not prices or bids at the contractor as-built level.
Engineering News Record Building Cost Index (ENRBCI) and RSMeans Cost Index are examples of commonly used indices that DO NOT represent whole building costs yet are commonly used to adjust project costs. The ENRBCI tracks a limited market basket of labor and materials. RSMeans holds the quantity of materials and labor for a building constant. Neither index addresses contractor margins. However, they are useful in that they also publish input cost indices from many cities. This provides a reference to compare those cities to the national average, but still, only for a limited basket of labor and materials. Neither gives any indication of the level of market activity in an area.
Residential construction saw a slowdown in inflation to only +3.5% in 2015. However, the average inflation for six years from 2013 to 2018 is 5.7%. It peaked at 8% in 2013. It climbed back over 5% for 2016 and currently is near 5.5% in 2018. Anticipate national average residential construction inflation for 2018 at least 5.5 % to 6%.
Nonresidential Buildings indices have averaged 4% to 4.5% over the last five years and have reached over 5% in the last three years. Nonresidential buildings inflation totaled 18% in the last four years. My forecast shows nonresidential buildings spending in 2018 will reach the fastest rate of growth in three years, which historically has led to accelerated inflation.
There are clear signs of increasing construction activity and a tightening construction labor market. The national construction unemployment rate recently posted below 4%, the lowest on record with data back to 2000. During the previous expansion it hit a low average of 5%. During the recession it went as high as 25%. The average has been below 5% for the last 18 months. An unemployment rate this low potentially signifies labor shortages. The Job Openings and Labor Turnover Survey (JOLTS) for construction is at or near all-time highs. A tight labor market will keep labor costs climbing at the fastest rate in years. Labor shortages cause contractors to pay premiums over and above normal wage increases to keep workers from leaving. Some premiums accelerate labor cost inflation but are not recorded in published wage data.
Recent news of tariffs has extended beyond just steel. I calculated a 25% tariff on raw steel would add 1% to the cost of nonresidential steel buildings. Hi-rise residential buildings, if building is structural steel, would fall in this category. Wood framed residential impact would be small. A 25% increase in mill steel could add 0.65% to final cost of building just for the structure. It adds 1.0% for all steel in a building. If your building is not a steel structure, steel still potentially adds 0.35%.
Anticipate national average construction inflation for nonresidential buildings for 2018 and 2019, including steel impact, of 4.25% to 5.5%, rather than the long-term growth average of 4%. Adjust for any other yet unknown tariffs that may hit after Jan 1, 2019.
In the following plot, Construction Analytics Building Cost Index annual percent change for nonresidential buildings is plotted as a line against a bar chart background of the range of all other nonresidential building inflation indices. Usually the lows are formed by market basket input indices while the highs are formed by other selling price indices.
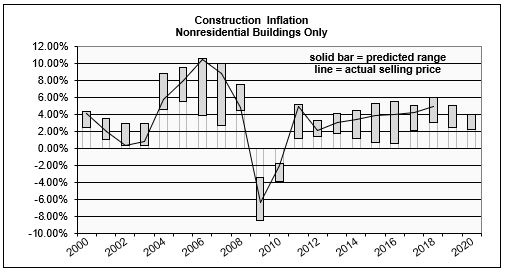
As noted above, some reliable nonresidential selling price indexes have been over 4% since 2014. Currently most selling price indices are over 5% inflation in 2018. Notice during that same period seldom did any input indices climbed above 3%.

Every index as published has its own base year = 100, generally the year the index was first created, and they all vary. All indices here are converted to the same base year, 2017 = 100, for ease of comparison. No data is changed from the original published indices.

Non-building Infrastructure indices are far more market specific than any other type of index. Reference specific Infrastructure indices rather than any average.
These links point to comprehensive coverage of the topic inflation and are recommended reading.
Click Here for Link to a 20-year Table of 25 Indices
Click Here for Cost Inflation Commentary – text on Current Inflation
Current$ vs Constant$
Comparing current $ spending to previous year spending does not give any indication if business volume is increasing. The inflation factor is missing. If spending is increasing at 5%/year at a time when inflation is 4%/year, real volume is increasing by only 1%.
The current Nonresidential buildings forecast of spending growth at 6.0% for 2018 would suggest that after inflation, nonresidential buildings construction volume is growing slightly. So expect volume growth in 2018, but next year 4.3% inflation and no spending growth is signaling a volume decline in 2019.
Nonresidential spending increased 43% since 2010, but there was 30% inflation. Real nonresidential volume since 2010 has increased by only 12%. Nonresidential jobs increased by 27% during that period, 15% greater than volume growth.
Residential spending increased by 110% since 2010, but after inflation, real residential volume increased by only 57%. Jobs increased by only 37%, 20% short of volume growth.
When comparing inflation adjusted constant dollars, 2018 spending will still be lower than all years from 1998 through 2007. In 2005 constant $ volume reached a peak at $1,450 billion. At current rates of growth, we would not eclipse the previous high before 2022.
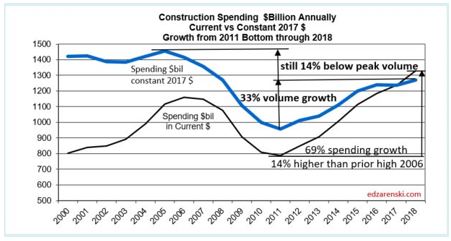
Spending in current $ is 14% higher than the previous 2006 high spending.
Volume after adjusting for inflation is still 14% lower than the previous 2005 high volume.
Jobs and Volume
The period 2011-2017 shows both spending and jobs growth at or near record highs.
A spending forecast of 6.6%+ in 2018, or an increase of $83 billion in construction spending, demands a few words on jobs growth. Construction requires about 5000 workers for every added $1 billion in construction “volume”. But construction jobs growth seems to closely follow growth in spending. Construction jobs have increased by 400,000 in a year only four times in the last 50 years, each time accompanied by one of the four highest spending growth increases in 50 years. However, $80 billion in added spending is not the same as $80 billion in volume, and jobs needed is based on volume.
Although spending will increase 6.6%, construction inflation has been hovering near 4.5% for the last five years. Real volume growth in 2018 after inflation is expected to be near 2% or only $26 billion. That would mean the need, if there are no changes in productivity, is to add only about 130,000 additional jobs in 2018, a rate of growth that is well within reach. That is less than the average jobs growth for the last seven years.
Construction added 1,400,000 jobs in the last 5 years, an average of 280,000/year. The only time in history that exceeded jobs growth like that was the period 1993-99 with the highest 5-year growth ever of 1,483,000 jobs. That same 1993-99 period had the previous highest 5-year spending and volume growth going back to 1984-88.
Total spending increased 60%+ since 2010, but with 30% inflation. Real total volume since 2010 has increased by only about 30%. Jobs also increased by 30%, in balance with need. But the results are much different for Residential than Nonresidential.
Nonresidential spending increased 50% since 2010 with 35% inflation. Nonresidential volume since 2010 has increased by only 15%. Jobs increased by 27%, 12% in excess of volume growth.
Residential spending increased by 125% since 2010, but after 40% inflation, real residential volume increased by 85%. Jobs increased by only 40%, 45% short of volume growth.
Residential construction labor cannot be directly compared to residential volume because
- Some residential high-rise jobs, for example structure, are performed by firms whose primary activity is commercial construction. Those jobs are classified as nonresidential.
- Buildings that are multi-use commercial retail and residential, even lo-rise, may be built by contractors whose firms are classified nonresidential labor. The construction spending would be broken out to residential and nonresidential, but the labor would not.
- Some residential immigrant labor is not counted
For these reasons, it is best to simplify comparisons of spending activity to total labor.
For more on Jobs see Construction Jobs and Residential Construction Jobs Shortages
New Construction Starts
New construction starts for the six months in the 1st half 2018 reached an all-time high.
New Construction Starts three-month average for May-Jun-Jul is $840 billion, all-time high.
Year-to-date (YTD) 2018 starts are currently reported as up only 2% from 2017, but 2017 starts through September have already been revised up by 9%, 10% in nonresidential buildings, 16% in non-buildings and 3% in residential. 2018 starts will not be revised until next year. Revisions have always been up.
Revisions for the last 10 years averaged more than +7%/yr., with most of the upward revision in nonresidential buildings. Revisions to nonresidential buildings have been greater than 10%/year for the last 7 years. Therefore, 2018 starts growth is very likely under-reported.
All construction starts data in this report references Dodge Data & Analytics Starts Data.
Dodge releases its first forecast of next year’s starts every year in the 4th quarter. Last year the first forecast for 2018 was for starts to increase 3% to $765 billion. 2018 starts, based on data as of September, could reach $806 billion, but at first appearing to show no gain from 2017. That’s because 2017 has already been revised up by $50 billion. After 2018 revisions are posted next year, 2018 starts could reach $830-$840 billion. Dodge forecast 2019 starts at $808 billion, no change from 2018. This will be subject to two upward revisions.
- Previous year starts always later get revised upwards. Therefore, current year starts YTD growth is always understated. This analysis compensates for that.
- New starts will generate record high starting backlog for every sector in 2019.
- Even a low forecast for starts in 2019 produces record backlog for 2020.
For nonresidential buildings spending, long duration jobs can sometimes have a 5 to 6-year schedule. On average most years have at least some projects start that will be under construction for 4 years. For an entire year’s worth of starts, approximately 20% of the spending occurs in the year started, 50% in the next year, 25% in the third year and only 5% in the fourth year or later year. Residential starts contribute spending into the third year. This means that nonresidential spending growth in 2019 is still being affected by starts from 2016 and residential growth from starts in 2017. This also means that nonresidential spending growth in 2019 is still being affected by starts from 2016.
The next two plots show the 3-month moving average and trend line of starts for Residential and Nonresidential Buildings. Starts can be erratic from month to month. The trend line gives a better impression of how starts impact spending. It is the rate of change in starts cash flows that provides a predicting tool for spending.

The plot below is an index. The plot shows greater accuracy in the forecast when the slope of the predicted cash flow and actual spending plot lines move in the same direction. It’s not the spread between the lines that gives any indication. If the slope of the lines is the same, then the cash flow accurately predicted the spending.
The light green line for nonresidential buildings spending estimated from starts cash flow shows smooth spending, even though actual monthly starts are erratic (see nonres bldgs plot shown above). The actual spending often follows close to the pattern estimated from cash flows.
Starts are sometimes misinterpreted in common industry forecasting articles. Starts dollar values represent a survey of about 50% to 60% of industry activity, therefore Starts dollar values cannot ever be used directly to indicate the volume of spending. Also, Starts do not directly indicate changes in spending per month or per year. Only by including an expected duration for all Starts and producing a forecast Cash Flow from Starts data can the expected pattern of spending be developed. Finally, it is the rate of change in Starts Cash Flows that gives an indication of the rate of change in spending.
Starting Backlog
Nonresidential Buildings starting backlog at the beginning of 2018 reached an all-time high. For nonresidential buildings this backlog will contribute spending until the end of 2021. 2019 Backlog is forecast to increase 8%. For purposes of this analysis, I’ve set only moderate or low increases in starts for 2020 and 2021, so this forecast may hold down the future backlog and spending forecast. However, backlog leading into 2019 is up 70% in 5 years.

Starting Backlog is the Estimate-to-Complete (ETC) value of all projects under contract at the beginning of a period. Projects in starting backlog could have started last month or last year or several years ago.
- 75%-80% of all Nonresidential Buildings spending within the year will be generated from projects in starting backlog.
- 80%-85% of all Non-Building Infrastructure spending within the year will be generated from projects in starting backlog.
- 70% of All Residential spending within the year is generated from new starts, but this is weighted because 85% of all residential work is short duration single family and renovation work.
- 65% on long duration Multifamily Residential spending within the year will be generated from projects in starting backlog.
Non-building Infrastructure starting backlog at the beginning of 2018 reached an all-time high. Some of this is very long-term work that will contribute spending until the end of 2025. In fact, more than half of all spending in 2019 comes from projects that started prior to Jan 2018. 2019 Backlog is forecast to increase 10%. Backlog is up 45% in 5 years but is up 50% in just the last 3 years.

Multifamily residential has a longer duration and a greater percentage of spending comes from backlog. But, due to the shorter duration of projects, about 75% of single family and residential renovation spending within the year is generated from new starts. Unlike nonresidential, backlog does not contribute nearly as much short-term residential spending within the year.

Cash Flow
Simply referencing total new starts or backlog does not give an indication of spending within the next calendar year. Projects, from start to completion, can have significantly different duration. Whereas a residential project may have a duration of 6 to 12 months, an office building could have a duration of 18 to 24 months and a billion-dollar infrastructure project could have a duration of 3 to 4 years. New starts within any given year could contribute spending spread out over several years. Cash flow totals of all jobs can vary considerably from month to month, are not only driven by new jobs starting but also by old jobs ending, and are heavily dependent on the type, size and duration of jobs.
Cash flow from all starts still in backlog supports a 2018 spending forecast of $1,321 billion, a spending increase of 6.0% over 2017. The forecast for 2019, based on a minimal increase in starts, is $1,341 billion, an increase of only 1.5% over 2018. Dodge initial November 2018 forecast for 2019 construction starts is for $808 billion, no gain over 2018. However, subsequent revisions may increase that a few percent.
The following table illustrates the difference between Starts and Cash flow. It shows Manufacturing Bldgs. projects in backlog as of October 2018 and predicted starts in 2018 through 2021. Note there are sometimes vast differences between amounts of Starts, whether already in Backlog at beginning of year or New Starts within the year, and Cash Flow from Backlog and New Starts.

Cash Flow modeling predicted a huge decline of -16% in manufacturing spending in 2017. This was in stark contrast to seven other economic analysts who predicted spending would be between -7% and +7%, for an average of +0.4% as reported in the January 2017 AIA Consensus. Manufacturing spending actually ended the year at -13.0%. Obviously, there is no correlation between a 25% increase in new starts within the year and a predicted -16% drop in spending. The actual -13% drop in 2017 spending reflects a return to normal after an unusually large volume of spending in 2015 and 2016 that was generated by a record volume of starts in 2014.
Note that new manufacturing starts were up 27% in 2017 and could be up 18% in 2018, yet 2018 spending is forecast to increase only 1.5%. This is due to projects that started several years ago but are now coming to an end. They are dropping out of the monthly cash flows and holding down 2018 spending even though starts have been up substantially for two years. This substantial volume of new starts in 2017 and 2018 will be providing a boost to spending in 2020 and 2021.
Spending
Total of All construction spending is forecast to increase 6.0% to $1.321 trillion in 2018 and 1.5% to $1.341 trillion in 2019 and 6.3% to $1.426 trillion in 2020.

Construction spending is strongly influenced by the pattern of continuing or ending cash flows from the previous two to three years of construction starts. Current month/month, year/year or year-to-date trends in starts often do not indicate the immediate trend in spending.
The following table clearly shows there is not a correlation between starts in any year with spending in either the current or the following year. The practice of using construction starts directly to predict spending can be very misleading in an industry that relies on data for predictive analysis to plan the future. Not only does it not predict the volume of spending in the following year, it does not even consistently predict the direction spending will take, up or down, in the following year. It’s a false indicator and it’s not a good use of data.
Residential Buildings Spending
Residential construction spending for 2018 was recently revised down and starts for 2019 are expected flat to down slightly. The forecast is now for an increase of 5.6% to $562 billion in 2018, 0.5% to $564 billion in 2019 and 2.3% to $577 billion in 2020.
Residential spending in 2018 slows after six years of growth all over 10%/year. Average spending growth the last seven years is 12%/year. Although Residential 2019 construction spending is still increasing slightly 0.5%, growth has slowed to less than inflation of 5%. Therefore real 2019 residential volume after inflation is forecast to decline by 4%+, the largest real volume decline since 2009. In 2018 residential spending increased 5.6%, but after inflation real volume increased only a fraction of a percent.
Residential spending in 2018 is 50% single family, 13% multi-family and 37% improvements. In 2011, improvements were 48% of residential spending.
Single Family Residential spending is more dependent on new starts within the most recent 12 months than on backlog from previous starts.
Total starts for the last 6 months are the highest since 2006, but % growth has slowed considerably. New starts in 2017 which initially posted only 2% growth have already been revised up to 4%. I expect that to be revised up to 5%. Growth of 7% is expected for 2018. Slower growth is now expected after 5 years (2012-2016) of starts increasing at an average 20%/year. Multi-Family Residential spending is more dependent on backlog.

Residential spending hits a 12-year high in 2018. Residential spending reached a current $ peak of $630 billion in 2005. 2018 pending is still 10% below that peak. In constant $, adjusted for inflation, all years from 1998 through 2007 were higher than 2018. In constant $, 2018 spending is still 27% below the 2005 peak.
Nonresidential Buildings Spending
Nonresidential Buildings construction spending is forecast to increase 5.8% to $444 billion in 2018, dip -0.2% to $443 billion in 2019 and climb 8.9% to $482 billion in 2020. Office (which includes data centers) and Amusement/Recreation support the 2019 but there is downward pressure from slowdowns or timing of cash flow in Manufacturing, Lodging, Healthcare and Educational. Educational, Healthcare, Recreation, Office and Manufacturing all support growth in 2020.

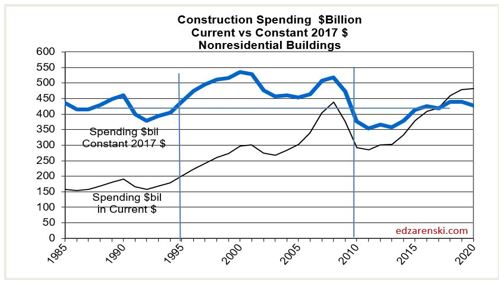
Nonresidential buildings construction spending in constant $ (inflation adjusted $) reached as high as $440 billion in 2017 but averaged only $419 billion in 2017. In 2018 it will reach a high of $430 billion but average only $424 billion. The yearly average recently peaked at $431 billion in 2016. Constant $ spending or real volume growth shows all years from 1996 through 2010 had higher volume than the 2018 forecast. Volume reached a peak $536 billion in 2000 and went over $500 billion again in 2008. In constant $ 2018 is still 20% below that 2000 peak.
Non-building Infrastructure Spending
Non-building Infrastructure construction spending is forecast to increase 7.2% to $316 billion in 2018, 5.5% to $334 billion in 2019 and 9.9% to $367 billion in 2020. The forecast growth for 2019 will be supported by Transportation and Public Works but will be held down somewhat by Highway. Transportation terminals and rail project starts both increased more than 100% in 2017 and both are long duration projects types that will contribute spending for several years. Environmental Public Works had strong 20% growth in 2018 starts and Highway starts hit a new high in 2018.

Non-building Infrastructure construction spending in constant $ (inflation adjusted $) reached $311 billion in 2016, an all-time high, but then dropped to $296 billion in 2017. In 2018 it will reach $302 billion. Constant $ spending or real volume growth has been within +/- 3% for the last 5 years.

Non-building Infrastructure spending, always the most volatile sector, in mid-2017 dropped to 2013 lows. However, this short dip was predicted. Cash flow models of Infrastructure starts from the last several years predicted that dips in monthly spending would be caused by uneven project closeouts from projects that started several years ago, particularly in Power and Highway markets.
Current backlog is at an all-time high, up 10%+ each of the last 3 years, and spending is expected to follow the increased cash flows from the elevated backlog. Transportation terminals new starts in 2017 jumped 120%. Rail project starts increased more than 100%. Starting backlog for all transportation work is the highest ever, up 100% in the last two years. Transportation spending is projected to increase 20-25%/year for the next two years.
No future growth is included from infrastructure stimulus and yet 2018 spending is projected to increase by 8%. 2019 and 2020 are forecast to increase 5% to 6%.
Public Infrastructure and Public Institutional
Less than 60% of all Non-building Infrastructure spending, about $170 billion, is publicly funded. That public subset of work averages growth of less than $10 billion/year.
About 25% of all Nonresidential Buildings spending, about $110 billion, is publicly funded, mostly Educational. Nonresidential buildings spending makes up almost 40% of Public spending.
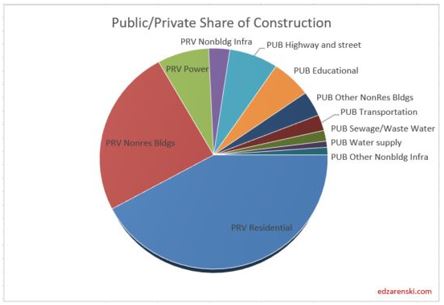
- Infrastructure = $300 billion, ~25% of all construction spending.
- Infrastructure is about 60% public, 40% private. In 2005 it was 70% public.
- Public Infrastructure = $170 billion. Private Infrastructure = $130 billion.
- Power and Communications are privately funded infrastructure.
- Nonresidential Buildings is 25% public (mostly institutional), 75% private.
- Educational, Healthcare and Public Safety are Public Nonres Institutional Bldgs
- Public Commercial construction is not included.
- Public Institutional = $100 billion, mostly Education ($70b).
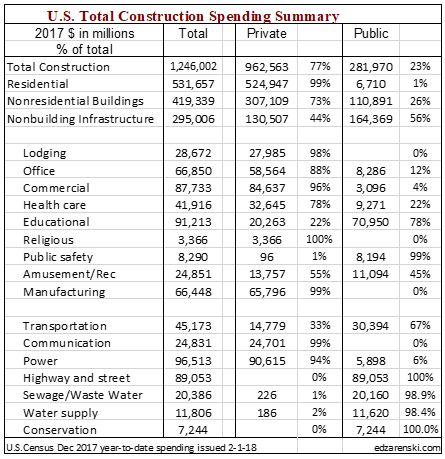
Public Infrastructure + Public Institutional = $280 billion, 23% of total construction spending.
Public Infrastructure + Institutional average growth is $12 billion/year. It has never exceeded $30 billion in growth in a single year.
See also Publicly Funded Construction
See also Down the Infrastructure Rabbit Hole
Public Spending
Total public spending for 2018 is projected to finished up 9.5% at $320 billion. Every major public market is projected to finish up for 2018. By far, the largest Public spending increases for 2018 are Highway, Transportation, Sewer and Waste Disposal and Water Supply.

The two largest markets contributing to public spending are Highway/Bridge (32% of total public spending) and Educational (25%), together accounting for nearly 60% of all public construction spending. At #3, Transportation is only about 10% of public spending. Environmental Public Works combined makes up almost 15% of public spending, but that consists of three markets, Sewage/Waste Water, Water Supply and Conservation. Office, Healthcare, Public Safety and Amusement/Recreation each account for about 3%.
Educational is 80% public, Transportation 70%, Amusement/Rec 50% and Healthcare 20% public. Power is about 6% public, along with few other smaller shares.
Public spending hit a 4-year low in mid-2017. It has been increasing since then and is now near an all-time high. I’m expecting to see strong growth through 2020.
Due to long duration job types, 2018 starting backlog is up 30% in the last 3 years. In 2018, 40% of all spending comes from jobs that started before 2017. Leading 2018 growth are Educational (+15%) and Transportation (+35%), with a combined total forecast 20% growth in public spending.
Current levels of backlog and predicted new starts gives a projection that Public Non-building Infrastructure spending will reach an all-time high in 2018 and again in 2019.

For a Full Formatted PDF of this Report click
2019 Construction Economic Forecast – Summary – Dec 2018
Link to the 2019 Nonresidential Forecast Report
2019 Construction Economic Forecast – Nonresidential – Nov 2018

Reliability of Predicted Construction Forecast Data
10-2-18
It’s not uncommon that clients ask for a forecast of construction spending for the next three years. It is less common that forecasters explain the reliability of the data in a forecast.
To predict the reliability of the data in a forecast, several assumptions must be stated.
Cash flow curves are generated to predict the spending pattern. These are assumed to be reliable. The cash flows are generated from monthly data releases for New Construction Starts. The Starts data is assumed reliable. However, major sector data is revised in the following month and again in the same month the following year. These revisions are incorporated when released, but nonresidential building markets revisions are not posted at the same frequency. That data becomes available in the 4th quarter report of the following year. It is updated at that time. The analytical methods are assumed to be reliable.
The primary driver of the spending forecast is New Construction Starts. Care must be taken to use Starts properly. Starts are sometimes misinterpreted in common industry forecasting articles. Starts dollar values represent a survey of about 50% to 70% of industry activity and that varies by market type, therefore Starts dollar values cannot ever be used directly to indicate the volume of spending. Also, Starts do not directly indicate changes in spending per month or per year. Projected starts data cannot be used to directly forecast expected construction volume. Only by including an expected duration for all Starts and producing a forecast Cash Flow from Starts data can the expected pattern of future backlog and spending be developed.
For short duration residential spending, single-family residential and renovations work, approximately 75% of the spending occurs in the current year and 20% in the following year.
For long duration residential spending, typical of multifamily residential, approximately 50%-55% of the spending occurs in the current year, 35%-40% in the next year and only 5%-10% occurs two years out.
For nonresidential buildings spending long duration jobs can sometimes have a 5 to 6-year schedule. On average most years have at least some projects start that will be under construction for 4 years. For an entire year’s worth of starts, approximately 20% of the spending occurs in the year started, 50% in the next year, 25% in the third year and only 5% in the fourth year or later year. This also means that nonresidential spending growth in 2019 is still being affected by starts from 2016.
Non-building Infrastructure spending has many of the longest duration jobs. Some job starts in the last two years have 6 to 8-year duration. Many years have at least some projects start that will be under construction for 5 years. For the entire year of starts, approximately 15% of the spending occurs in the year started, 40% in the next year, 33% in the third year and 12% in the fourth year or later year. This also means that non-building Infrastructure spending growth in 2019 is still being affected by jobs that started in 2015.
- 75%-80% of all Nonresidential Buildings spending within the year will be generated from projects in starting backlog.
- 80%-85% of all Non-Building Infrastructure spending within the year will be generated from projects in starting backlog.
- 70% of All Residential spending within the year is generated from new starts, but this is weighted because 85% of all residential work is short duration single family and renovation work.
- 65% on long duration Multifamily Residential spending within the year will be generated from projects in starting backlog.
Multifamily residential has a longer duration and a much greater percentage of spending comes from backlog. But, due to the shorter duration of projects, about 75% of single family and residential renovation spending within the year is generated from new starts. Unlike nonresidential, backlog does not contribute nearly as much short-term residential spending within the year. For that reason, the reliability of SF and Reno residential work drops more quickly than all other types.
For any future forecast month, the most information is in hand the month before. For example, in the month of October the forecast for November includes a projected cash flow which is based 96%-98% on actual projects. Only the small amount from new projects that start in November is predicted. Assessing the amount of actual data versus the amount of predicted data gives an indication of how much weight can be placed on the forecast. Obviously, the balance of actual versus predicted data changes the further out in time we view the forecast.

From the current date, the forecast for the next month includes 95%-98% actual data. Only the cash flow curve and the predicted duration affects the reliability of the forecasts and even that is minor.
Twelve months from the current date, the forecast is more dependent on predicted starts and therefore the percentage of actual data drops. The Non-building Infrastructure forecast includes 85% actual data. The Nonresidential Buildings forecast includes 80% actual data. The Residential forecast includes 30%-40% actual data.
Two years out from the current date, the forecast is far more dependent on predicted starts. The Non-building Infrastructure forecast includes 45% actual data. The Nonresidential Buildings forecast includes 30% actual data. The actual data in a residential forecast drops to near zero with very little remaining in backlog and that only from multifamily.
Three years out from the current date, the forecast is near entirely dependent on predicted starts. The Non-building Infrastructure forecast includes about 15% actual data. The Nonresidential Buildings forecast is approaching zero. The residential forecast has already be reliant on predicted data for the past year.
To put this in perspective, let’s assume a Jan 1, 2019 forecast which includes all actual construction starts through Dec 2018. We’ll look at the forecast for 2020 and 2021. Also, we’ll base the volume of actual data on each sector’s actual data and its share of total construction spending. Non-building Infrastructure has the most actual data long term, but it is the smallest share of total construction. Residential has the least long-term data but is the largest share of total construction.
In my Jan. 1, 2019 forecast, the forecast for the year 2020, the period only 12 to 24 months out, actual data drops from 60% at the start of the year to 20% at the end. So, the 2020 forecast includes only an average of 40% actual data. In the forecast for the year 2021, the period from 24 to 36 months out, the actual data drops from 20% to 4% over the course of the year. Very little actual data is influencing the forecast.
Three years out from the current date the reliability of the forecast is dependent on the economic outlook of the developer and the predictive methodology of the analytic tools.
It’s good to know, when you are looking at a forecast that projects three years out past the current year, there is nearly no actual data in that forecast. It’s all predicted.
