1-28-20 See the latest post Construction Inflation 2020
8-26-19 go to this article for Added links to sources for international construction inflation rates
1-14-20 added new index table covering 2015-2023 at Index Table Link – see link to Tables below
This table updates 2018 and 2019 data and 2020-2023 forecast. Nonresidential inflation, after hitting 5% in both 2018 and 2019, is forecast for the next three years to fall from 4.4% to 3.8%, lower than the 4.5% avg for the last 4yrs. Forecast residential inflation for the next three years is level at 3.8%. It was only 3.6% for 2019 but averaged 5.5%/yr since 2013.
When construction is very actively growing, total construction costs typically increase more rapidly than the net cost of labor and materials. In active markets overhead and profit margins increase in response to increased demand. These costs are captured only in Selling Price, or final cost indices.
General construction cost indices and Input price indices that don’t track whole building final cost do not capture the full cost of inflation on construction projects.
To properly adjust the cost of construction over time you must use actual final cost indices, otherwise known as selling price indices.
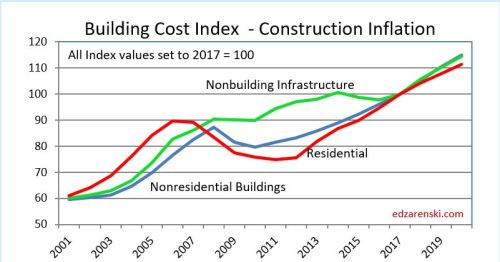
ENRBCI and RSMeans input indices are examples of commonly used indices that DO NOT represent whole building costs, yet are widely used to adjust project costs. An estimator can get into trouble adjusting project costs if not using appropriate indices. This plot of cost indices for nonresidential buildings shows how input indices did not drop during the 2008-2010 recession while all other final cost indices did drop.

CPI, the Consumer Price Index, tracks changes in the prices paid by urban consumers for a representative basket of goods and services, including food, transportation, medical care, apparel, recreation, housing. The CPI is not related at all to construction and should not be used to adjust construction pricing. Historically, Construction Inflation is about double the CPI, but for the last 5 years construction inflation averages 3x the CPI.
Producer Price Index (PPI) Material Inputs (which exclude labor) to new construction increased +4% in 2018 after a downward trend from +5% in 2011 led to decreased cost of -3% in 2015, the only negative cost for inputs in the past 20 years. Input costs to nonresidential structures in 2017+2018 average +4.3%, the highest in seven years. Infrastructure and industrial inputs were the highest, near 5%. But material inputs accounts for only a portion of the final cost of constructed buildings.
Materials price input costs in 2019 slowed to an annual rate of less than 1%.
Labor input is currently experiencing cost increases. When there is a shortage of labor, contractors may pay a premium to keep their workers. Unemployment in construction is the lowest on record. The JOLTS ( Job Openings and Labor Turnover Survey) is at or near all-time highs. A tight labor market will keep labor costs climbing at the fastest rate in years.
Click Here for Link to a 20-year Table of 25 Indices
Inflation can have a dramatic impact on the accuracy of a construction budget. Usually budgets are prepared from known current costs. If a budget is being developed for a project whose midpoint of construction costs is two years in the future, you must carry an appropriate inflation factor to represent the expected cost of the building at that time.
The level of construction activity has a direct influence on labor and material demand and margins and therefore on construction inflation. Nonresidential Buildings and Non-building Infrastructure backlog are both at all-time highs. 75% to 80% of all nonresidential spending within the year comes from starting backlog.
Although nonresidential buildings new starts are up only 5% the last three years, spending from backlog in 2020 is up 20% in three years and reaches an all-time high.
Most spending for residential comes from new starts. Residential new starts in Q1-2018 reached a 12 year high. Spending from new starts in 2019 fell 6% but is up 6% for 2020. Spending from new starts in 2020 is back to the level posted in 2017 and 2018.
2020 starting backlog is up 5.5% across all sectors. However, while a few markets will outperform in 2020 (transportation, public works, office), predicted cash flow (spending) from backlog is up only 1% to 2%.
Although many contractors report shortages due to labor demand, labor growth may slow due to a forecast 2019-2020 construction volume decline. But, we might see a labor decline lag spending/volume decline.
Expect 2019 escalation in almost all cases to finish at or lower than 2018.
Residential construction inflation in 2019 was only 3.6%. However, the average inflation for six years from 2013 to 2018 was 5.5%. It peaked at 8% in 2013, but dropped to 4.3% in 2018 and only 3.6% in 2019. Residential construction volume in 2019 dropped 8%, the largest volume decline in 10 years. Typically, large declines in volume are accompanied by declines in inflation. Forecast residential inflation for the next three years is level at 3.8%.
Note 8-2-19: Residential inflation for the 1st half of 2019 has come in at only 3.5%.
A word about Hi-Rise Residential. Probably all of the core and shell and a large percent of interiors cost of a hi-rise residential building would remain the same whether the building was for residential or nonresidential use. This type of construction is totally dis-similar to low-rise residential, which in large part is stick-built single family homes. Therefore, use the residential cost index for single family but a more appropriate index to use for hi-rise residential construction is the nonresidential buildings cost index.
Nonresidential inflation, after hitting 5% in both 2018 and 2019, is forecast for the next three years to fall from 4.4% to 3.8%, lower than the 4.5% average for the last 4 years. Spending needs to grow at a minimum of 4.4%/yr. just to stay ahead of construction inflation, otherwise volume is declining. Spending slowed dramatically in 2019. However, new starts in 2018 and 2019 boosted backlog and 2020 spending will post the strongest gains in four years.
Material tariffs in 2018 and 2019 are already incorporated into inflation. Adjust for any new tariffs impact.
In another article on this blog, (see steel cost increase), I calculated the 25% tariff on steel would cost nonresidential buildings 1%. Some Infrastructure could be much more, i.e., bridges 4-5%. Residential impact would be small. A 25% increase in mill steel could add 0.65% to final cost of building just for the structure. It adds 1.0% for all steel in a building. If your building is not a steel structure, steel still potentially adds 0.35%.
Note 8-2-19: Nonresidential Buildings inflation for the 1st half of 2019 as tracked by most national selling price indices has come in at just over 5%.
Reliable nonresidential buildings selling price indexes have been over 4% since 2015. Some have averaged over 5% for the last four years. Construction Analytics forecast (line) for 2019 is currently 5.1%. This may move higher due to the impact of September 2019 tariffs which are not yet reflected in any indices.

Non-building infrastructure indices are so unique to the type of work that individual specific infrastructure indices must be used to adjust cost of work. The FHWA highway index increased 17% from 2010 to 2014, stayed flat from 2015-2017, then increased 15% in 2018-2019. The IHS Pipeline and LNG indices increased 4% in 2019 but are still down 18% since 2014. Coal, gas, and wind power generation indices have gone up only 5% since 2014. Refineries and petrochemical facilities dropped 10% from 2014 to 2016 but regained all of that by 2019. BurRec inflation for pumping plants and pipelines has averaged 2.5%/yr since 2011 and 3%/yr the last 3 years.
Anticipate 3% to 4% inflation for 2019 with the potential to go higher in rapidly expanding Infrastructure markets, such as pipeline or highway.
This link refers to Infrastructure Indices.
Watch for unexpected impacts from tariffs. Steel tariff could potentially add 5% to bridges. Also impacted, power industry, pipeline, towers, transportation.
- Long term construction cost inflation is normally about double consumer price inflation (CPI).
- Since 1993 but taking out 2 worst years of recession (-8% to -10% total for 2009-2010), the 20-year average inflation is 4.2%.
- Average long term (30 years) construction cost inflation is 3.5% even with any/all recession years included.
- In times of rapid construction spending growth, construction inflation averages about 8%.
- Nonresidential buildings inflation has average 3.7% since the recession bottom in 2011. It has averaged 4.2% for the last 4 years.
- Residential buildings inflation reached a post recession high of 8.0% in 2013 but dropped to 3.4% in 2015. It has averaged 5.8% for the last 5 years.
- Although inflation is affected by labor and material costs, a large part of the change in inflation is due to change in contractors/suppliers margins.
- When construction volume increases rapidly, margins increase rapidly.
- Construction inflation can be very different from one major sector to the other and can vary from one market to another. It can even vary considerably from one material to another.
The two links below point to comprehensive coverage of the topic inflation and are recommended reading.
Click Here for Link to a 20-year Table of 25 Indices
Click Here for Cost Inflation Commentary – text on Current Inflation

Nice try!!! BUT escalation is what you reasonably negotiate. Turner being in construction stating escalation and people taking that as a datapoint is being foolish amongst fools!! In 25 years in construction I have NOT once given more than 3%. Then again I think UPS & FedEx still try and charge a fuel surcharge based on 20 year old fuel rates.
LikeLike
This is a woeful misrepresentation of inflation. I don’t disrespect you your right to negotiation on how much to grant the contractor, but that doesn’t take away the real costs of inflation, as witnessed by dozens of sources that track costs with 50+ years of historical records for an entire industry that show an average greater than 3%.
LikeLike
Have you come across any other sources that you could share to further support the third to last bullet that inflation in construction costs is mostly driven by changes in contractors/suppliers margins?
LikeLike
I bring that to the equation from decades of estimating experience. However, look for articles on contractor bid practices when bidding activity is plentiful vs when bidding activity is scarce. The phrase “sharpen your pencils” comes to mind. Also, examples from the last recession highlight this issue perfectly, when labor and material prices were still increasing but deflation registered a 10% drop due to contractors cutting margins. Just to clarify, I did not say the largest part of the change in inflation is due to change in contractors/suppliers margins, so “mostly driven by” might rather be “much of”.
LikeLike
Hi Ed,
Your analysis is very interesting. Is there a way to extrapolate Turner & RLB indices for the next 5 years?
LikeLike
None of the indices that I know of predict out 5 years. Most only venture to guess what will occur over the next year. If you need to predict inflation out over 5 years, I would recommend assessing
1) future market activity
2) general economic trend
3) based on 1 and 2 adjust the long term average for the sector.
LikeLike