UPDATES to Construction Outlook 10-16-20 based on
- Forecast includes US Census Aug 2020 year-to-date spending 10-1-20
- Forecast includes Dodge September construction starts 10-15-20
- Actual Jobs data includes BLS Jobs to Sept (12th) issued 10-2-20
This update accompanies pandemic-13-midyear-construction-outlook
Total construction starts year-to-date for 9 months through September are down 14%. Total starts have registered down -14% to -15% YTD for the last four months.
Residential new starts are down year-to-date only 1% from 2019. However, the last three months total residential starts posted the 2nd highest 3mo total in 15 years. The highest 3mo total since 2005 was for the period Dec’19-Jan-Feb’20. So two of the best 3mo periods of new residential construction starts in the last 15 years have occurred in 2020.
Nonresidential buildings starts are down 26% and non-building infrastructure starts are down 18%.
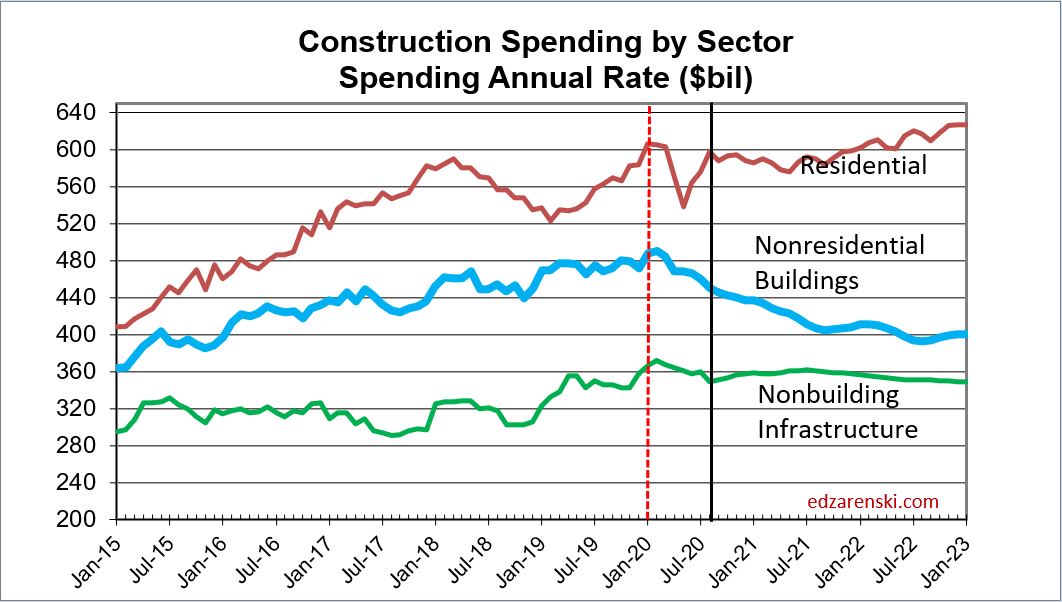
This chart shows a comparison of the cash flows predicted from new all construction starts vs the actual spending. Over time, the cash flows do a very good job of predicting where spending is headed. Note the divergence of residential in Jun-Jul-Aug 2020. Actual spending finished on avg 3%/mo higher than predicted. In 3 months the actual spending pushed 10% higher than predicted. This may be a reflection of forecasting too high an amount for delays and cancelations.

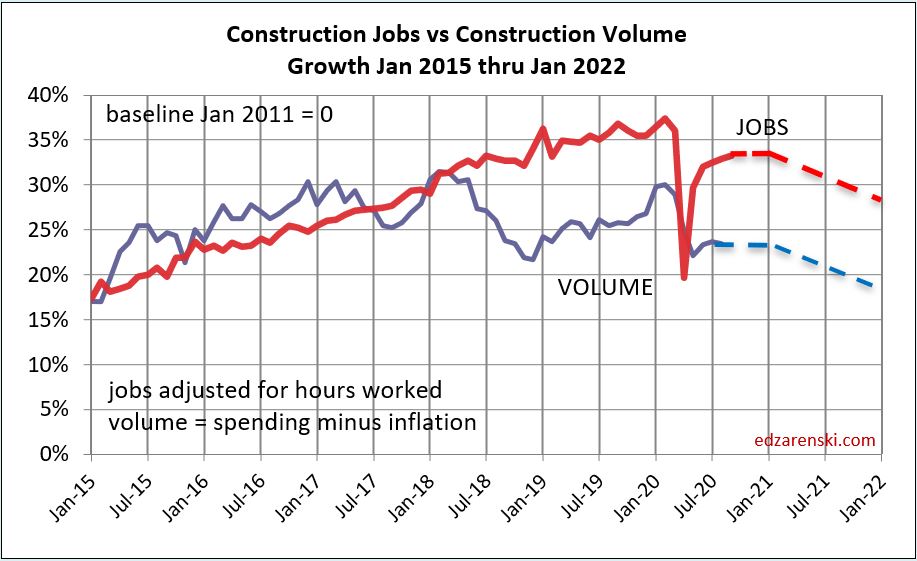
Construction Spending drives the headlines. Construction Volume drives jobs demand. Volume is spending minus inflation. Inflation $ do not support jobs. Current outlook shows (recent) peak volume was 2017-2018. Volume is forecast to decline every year out to 2023.
Construction jobs gained slightly in Sept, but are still down 5% (400,000) from Feb peak. Construction may experience only slight jobs improvement in 2020 (residential spending is increasing), but nonresidential buildings declines through 2021 will drive construction jobs lower over next 18 months.
Jobs are supported by growth in construction volume. We will not see construction volume return to Feb 2020 level in the next three years. This time next year, volume will be 5% lower than today, 14% below the Feb 2020 level.
This is why the construction industry will have a hard time justifying growth in jobs. After 12 years of fairly even growth in jobs vs volume, that relation broke in 2018. Volume is currently at a 5-year low, well below jobs. Declining work volume is indicating by this time next year we may be down 600,000 jobs below the Feb 2020 high.
The following table shows which markets have the largest (and smallest) changes in new construction starts. With the exception of residential, due to longer durations, spending in all other markets is most affected by a decline in new starts, not in this year, but in years following. Residential spending hit bottom in May, will post an increase in 2020. Nonres Bldgs spending won’t hit bottom until 2022.
A recent AGC survey of construction firms asked the question, How long do you think it will be before you recover back to pre-Covid? The survey offered “longer than 6 months” as an answer choice. My current forecast is longer than 6 years.
Some effects have not even begun to show up in the data. A 20% decline in new nonres bldgs starts in 2020 means a huge decline in spending and jobs in 2021-2022. How long before construction returns to the level it was at in Feb? 6 to 8 years.
Many nonresidential buildings have durations that last 24 to 36 months, with peak spending 12 to 18 months from now. With the drop in new starts this year, that peak spending 12 to 18 months from now will be impacted. Some nonbuilding markets have project durations that go out 5 or 6 years, so the impact of a decline in 2020 starts may be felt at least until 2025.

If construction starts in 2020 do not outperform 2020 construction spending, then starting backlog Jan. 1, 2021 will be lower. My current forecast (starts down 11%) is indicating 2021 starting backlog will be down by almost 10%. Spending declines into 2021 and remains depressed through 2023.
The last time starting backlog decreased was 2011. Starting backlog will fall 10% in 2021 and 2% in 2022. Except for residential, about 80% of annual spending comes from starting backlog.
The next table shows spending year-to-date through August (released 10-1-20) and the spending forecast for the year. 2nd quarter construction spending activity low-point is down only 5.5% from the Feb peak. Construction spending in August YTD is up 4.2%.
Residential ytd is up 7.2%. Single Family is +3.0%, multifamily is +2.7% and renovations is Reno +15.6%. Nonresidential buildings ytd is down -0.3% and Nonbuilding Infrastructure ytd is +5.8%.
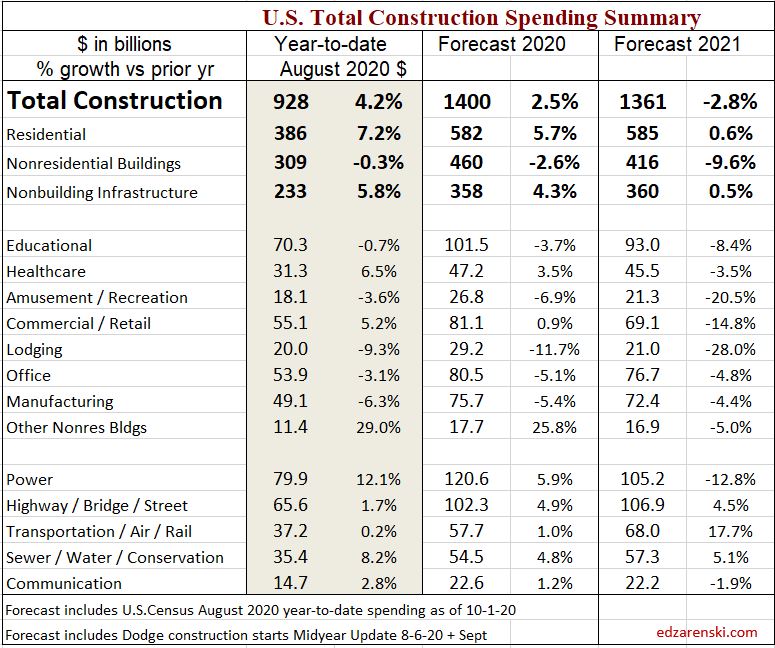
Take note here, the YTD spending for Nonresidential Buildings is currently -0.3% and my 2020 forecast shows Nonres Bldgs ending the year down -2.6%. Some forecasters are predicting spending for nonresidential buildings will end the year down much worse than -2.6% compared to 2019.
With only 4 months remaining, in order for Nonres Bldgs spending to finish down even -5%, the monthly rate of spending compared to 2019 would need to drop to -14%/mo for each of the remaining 4 months of 2020. (8mo x avg -0.3% + 4 mo x avg -14%) / 12mo = -5% total for the year. To end the year down -8%, nonres bldgs spending for the next 4 months would need to come in 25% lower than 2019. That’s “Great Recession” territory.
How unlikely is this to occur? The greatest monthly declines in 2020 so far are July and August in which the monthly rate of spending dropped -3% to -4% compared to same month 2019. Essentially, for nonresidential buildings spending to end the year down -5%, the bottom would need to drop out of the nonresidential markets, beginning back on Sept 1 and continuing for the final 4 months of the year.
Not sayin’ it can’t happen. This is 2020!
