Home » Articles posted by edzarenski (Page 6)
Author Archives: edzarenski

Construction Spending Outlook – Feb 2023
2-2-23
Total construction spending in 2023 will increase only 4.2% over 2022. Nonresidential Buildings will lead construction spending in 2023 with a forecast gain of 18%.
The last two years, 2021 and 2022, total spending increased 8.5% and 10%. However, inflation in 2021 was 11% and in 2022 was 15%, both higher than spending. Real construction volume for the year is spending without the inflation. The volume of work completed in 2021 is 11% less than 2021 spending and in 2022 is 15% less than the total of 2022 spending.
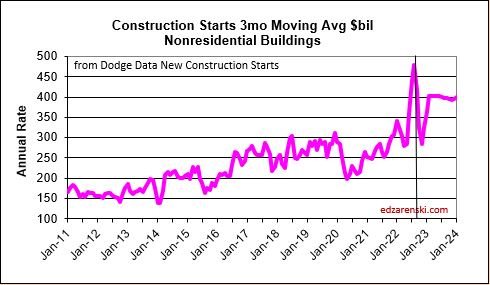
The rate of construction spending in 2023 will be influenced predominantly by a 38% increase in new nonresidential building starts in 2022. In fact, even more meaningful, Nonres Bldgs new starts, in 2nd half 2022, averaged 68% higher than any other 6mo period in history. In recent years, new starts averaged $300 billion/year. In the 2nd half of 2022, starts averaged over $500 billion/year. Many of the projects peak spending will occur in 2023. Some will occur in 2024. Total spending forecast for Nonres Bldgs in 2023 is $616bil, an increase of 18.5% over 2022.
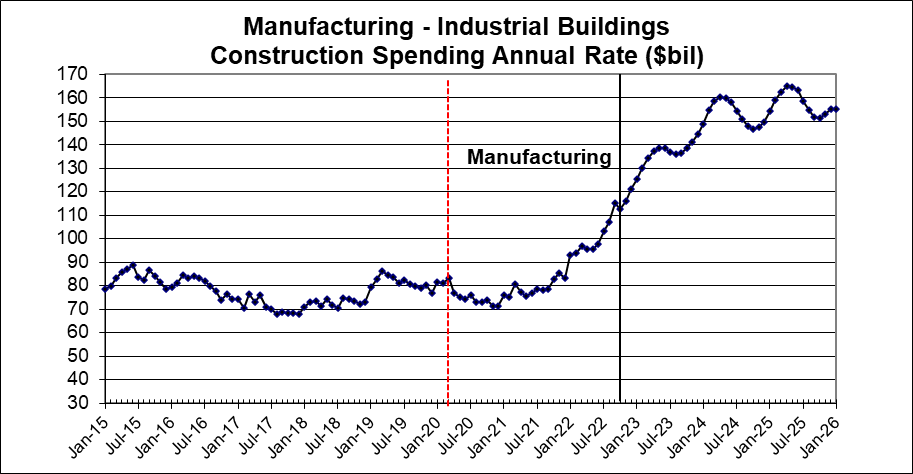
Growth in Manufacturing construction starts for 2022 far surpasses growth in any other market, up over 150%. Total new starts for the past 2 years is up over 400%. It will take at least a year to determine how much of that growth is an increase in total new construction and how much is an increase in capture of data in the starts survey.
Non-building starts for 2022-23 are forecast up 50%. Spending 2023-24 is forecast up 23%.
Non-building Infrastructure will post the 1st year of sizable gains since 2019, forecast at $400bil, up 9.6% in 2023. In 2022, Highway and Public Utilities posted strong gains of 9.0% and 16.5%, but those gains were offset by a 9.0% decline in Power. For 2023, Highway and Transportation recorded the strongest starts in five years. All markets post spending gains, with Highway up 12.0%, Transportation up 15.0% and Public Utilities up 11.5%.
See this discussion on Infrastructure and Jobs here
Infrastructure Constr Expansion – Not So Fast
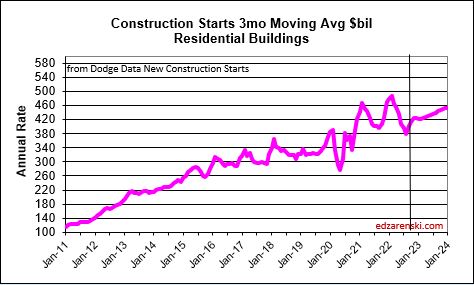
Residential starts in 2021 were up +21% to what was then a new high. Starts peaked in the 1st half 2022 then started a decline in 2nd half 2022. By Q4’22, the rate of new starts dropped by 20%. Starts are forecast down 2% in 2023.
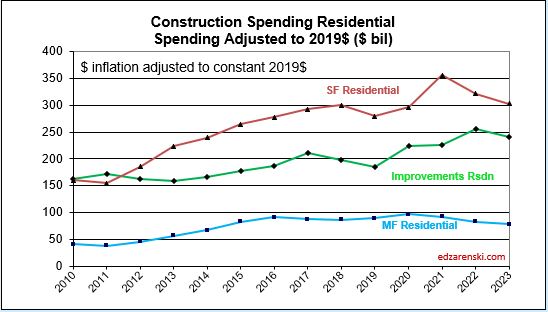
After three years of gains totaling 64%, expect residential spending to decline 6% in 2023. Single Family (47% of rsdn) spending peaked in April and since is down 20% in eight consecutive months. Multi-family (15% of rsdn) is up 11 consecutive months, now up 19% from January 2022. Reno/Rpr (38% of all rsdn) is up 25% for the year, but in the last five months, the rate of spending has fallen 15%. Only multi-family is currently trending up. 75% of all gains in multi-family occurred in the 4th quarter.
For the past 3 years, 2020-2022, Reno/Repair construction spending has gone up 1.26 x 1.16 x 1.25 = 1.8x, or 80%. Spending is currently down 17% from the peak in 4 of the last 5 mo. If the SAAR were to stall where it’s at now for the rest of 2023, spending will be down 10% for the year and will still be up 1.65x over last 4 years. Sure, it’s down, but it’s still high.
Residential spending grew 44% in the last 2yrs, but inflation was 30% of that 44%.
The annual rate of spending in all Nonresidential Buildings markets increased from Q1 to Q4 2022 and also Q4 spending in every market was higher than the average for 2022. Heading into 2023, nonresidential buildings markets start out the year with the annual rate of spending already 8% higher than the average 2022, and the trend has been up. The annual avg is usually much higher than Jan of the year, so I’d expect 2023 to come in higher. Although there are a few moderate dips in spending in some markets during the year, every market adds growth in 2023.

NOTE: The Census spending release on 2-1-23 is the 1st release to capture Dec data and therefore all months in 2022. The 3-1-23 release will revise both Dec and Nov. The 4-1-23 release will revise Dec. And the 7-1-23 release will revise any/all months needing further revision in both 2021 and 2022, sometimes with hefty changes. Historically, revisions are predominantly UP.
See Behind The Spending Forecasts
for a table showing the annual rate of spending for each market in the 4th qtr compared to the 2022 average. That’s the rate of spending starting out 2023.
Starting out the year with (Dec’22) an annual rate of spending already averaging 8% greater than 2022, coupled with 38% growth in new starts in 2022, much of which will be spent in 2023, produces the strongest year of growth in nonresidential buildings construction spending since 2007.
3-1-23 Surprises in the Census Construction Spending for Jan.
Nonres Bldgs January 2023 spending begins the year at a rate up 16% vs avg 2022 and up 23% YTD vs Jan 2022. Just one month ago the Dec. rate of nonres bldgs spending was only 8% higher than the average of 2022. This is Nonres Bldgs construction spending best start to the year since my records back to 2001. All indications are spending will increase throughout the year. I had forecast Mnfg in 2023 up 35% and total Nonres Bldgs up 18%. Now I have Mnfg up 40% and Total Nonres Bldgs up 20%.
If spending continues to increase at even a moderate pace, we could see the year end with Mnfg spending up 45% and total Nonres Bldgs spending up 25%.
- Mnfg starts Jan +54% ytd and +33% vs avg 2022.
- Comm/Rtl starts Jan +23% ytd and +18% vs avg 2022.
- Lodging starts Jan +42% ytd and +18% vs avg 2022.
- RSDN starts Jan -6% ytd and -5% vs avg 2022.
- Highway begins 2023 +16% ytd and +8% vs avg 2022.
- Power begins 2023 -5% ytd and +3% vs avg 2022.
- Transportation begins 2023 +10% ytd and +14% vs avg 2022.
Part of the Mnfg +54% can be explained due to the very low Jan’22. That evens out in Q4, when 2022 inflation jumped, so 2023 comparisons won’t be as high.
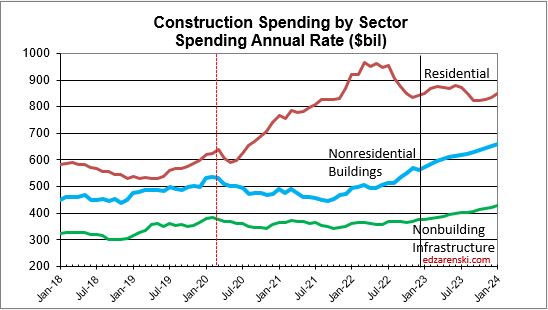
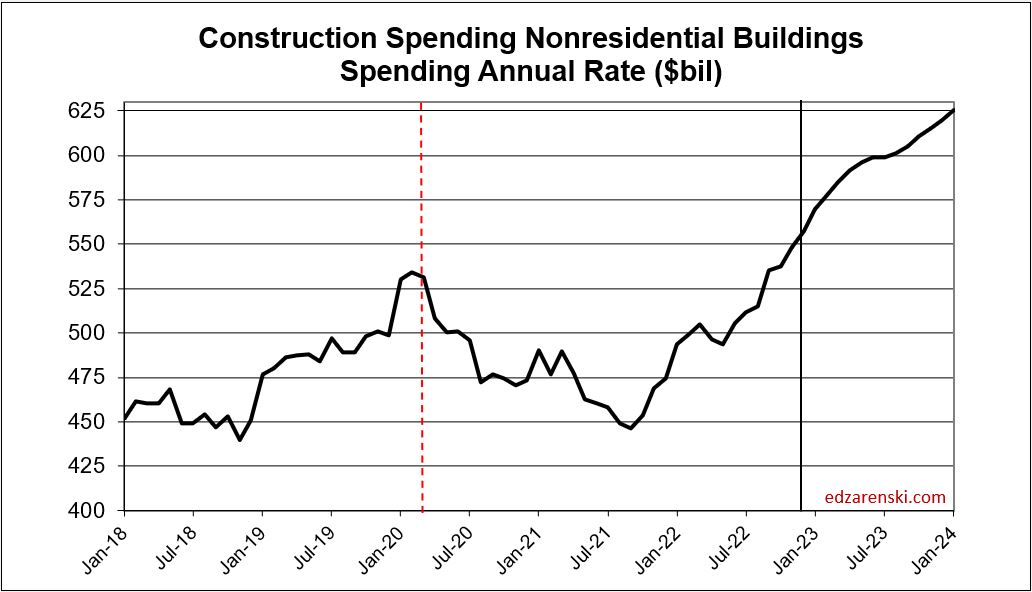
Below, the enlarged scale gives a better look at nonresidential Bldgs spending.

To fully understand the forecast it is necessary to discuss the impact of inflation. Construction spending includes inflation. Inflation adds nothing to business volume. Spending minus inflation gives volume. Growth, or decline, in business volume measures the actual activity growth in the construction industry. Spending measures the amount of revenue that exchanged hands to make it happen.
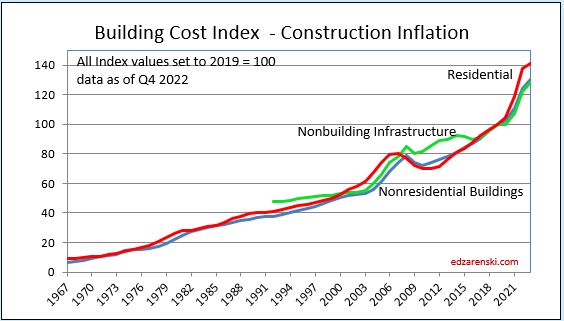
2-6-23 Current and predicted Inflation updated to Q4’22
- 2020 Rsdn Inflation 4.6%, Nonres Bldgs 2.4%, Nonbldg Infra -0.3%
- 2021 Rsdn Inflation 13.9%, Nonres Bldgs 7.6%, Nonbldg Infra 7.9%
- 2022 Rsdn Inflation 15.7%, Nonres Bldgs 12.3%, Nonbldg Infra 13.8%
- 2023 Rsdn Inflation 1.7%, Nonres Bldgs 4.2%, Nonbldg Infra 4.3%
Although input costs have been dropping and final demand (Nonres Bldgs) increases have been slowing, 2023 demand for nonresidential construction is going to post the largest annual spending increase ever recorded. This could reverse the trend in Nonres pricing and keep inflation higher for Nonres Bldgs.
Inflation adjusted volume is spending minus inflation. Volume of work (spending minus inflation) is what drives the need for jobs.
- Total volume for 2021 fell 1.9%, Rsdn +10%, Nonres Bldgs -13%, Nonbldg -8%.
- Total volume for 2022 fell 2.3%, Rsdn -1%, Nonres Bldgs +1%, Nonbldg -9%.
- Total volume forecast 2023 is flat at 0%, Rsdn -10%, Nonres Bldgs +13%, Nonbldg +4%.
Because 2022 inflation was so high (12% to 15%), the adjustment to 2022 spending resulted in much lower volume. In 2023, spending is forecast up 4.2% (compared to last year spending) and forecast inflation is 2% to 5%. 2023 inflation reduces spending far less than what occurred in 2022. Volume gets compared to volume the previous year. Therefore volume in 2023 shows an unusually large increase compared to volume in 2022.
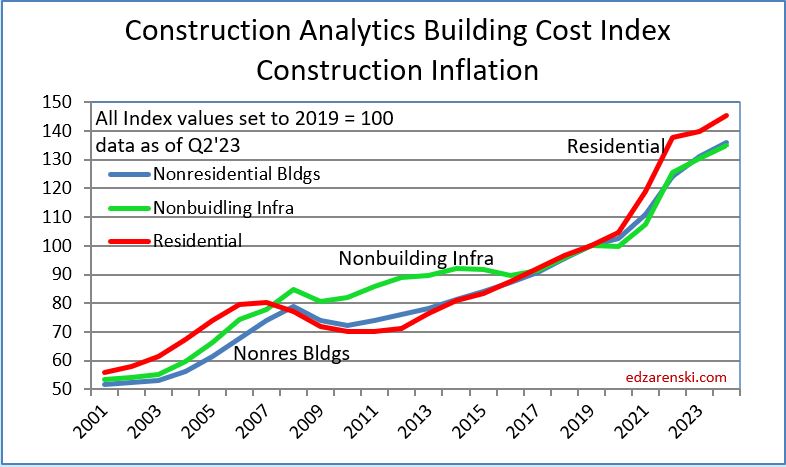
SEE Construction Inflation 2023
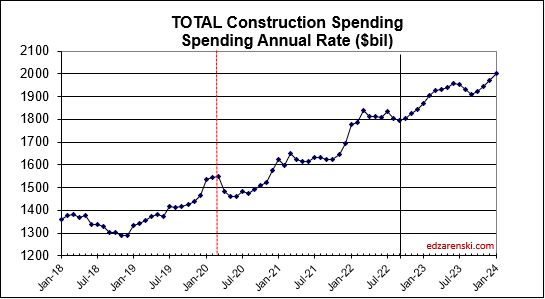
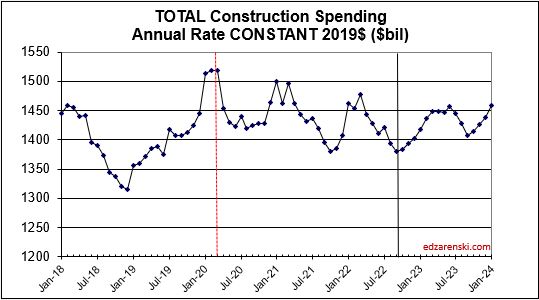
for the details of inflation costs, but here are plots of the same information as the two plots above, only difference being the plots above are Current$, dollars as reported in the current year as reported by Census, and the plots below are constant$, inflation $ has been removed. The plots below actually measure the real growth from year to year. For example, while the plot above shows residential growth in spending increased from $600 billion in Q1 2020, to $900 billion in 2022, the plot below shows most of that was inflation and after removing inflation, residential construction did increase in early 2022 but by Q1 2023 has dropped back to the same level it was at in Q1 2020.

Below, the enlarged scale gives a better look at nonresidential Bldgs volume.

Recent construction annual rate of spending is only 17% higher than March 2020, but overall total construction spending is up 30% for 2020-21-22. In that three year period there was 32% inflation, half of that in 2022. So, all of the 30% spending gain is inflation, there is no gain, (a slight drop of -2%) in volume for that three years. Residential spending increased more than 60% with rsdn inflation near 40%, so rsdn volume increased 20%. Rsdn jobs growth is near even on track with volume, but Nonres and Nonbldg jobs did not fall when volume dropped.Nonresidential had 10% volume decline in 2021. Nonres now has a volume deficit vs jobs, compared to at the end of 2019.
For a discussion of inflation effects on jobs growth visit this link where this chart will be discussed.
SEE Construction Spending – Volume – Jobs

Look Back at 2022 Construction Spending Forecasts
2-1-23
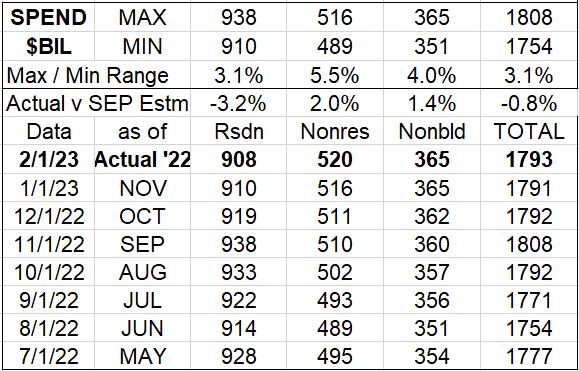
Initial Year end construction spending for 2022 is out today. This is when I compare my forecast for 2022 spending to all my prior monthly forecasts during the year AND I compare my midyear forecast prepared in May-June to the forecasts published at midyear in the AIA Consensus Construction Forecast. You can judge how I’ve measured up to forecasts thru the year.
This 1st table shows just the sum total in each sector for each monthly forecast I produced during the year. This year was quite unique in that new construction starts for nonresidential work increased by 60% in the 2nd half of the year, a magnitude of increase never before experienced. No one could have predicted that.
In this table I compare the actual for 2022 to the September forecast. My data analysis of 20 years of input shows that a particular set of months through and including September has forecast the end of year spending within 1.5% for nonresidential and within 2% for residential. You can see with the initial data for 2022 that the Sept forecast was within 3.2% for residential and within 2.0% for Nonres Buildings. Nonbuilding Infrastructure came in under the 1.5% threshold.
This next table is shows my midyear forecast for total 2022 spending compared to the forecasts published in the AIA Midyear 2022 Consensus. I’ve highlighted in green the closest estimate to the actual end-of-year spending report. In red is the worst forecast at midyear. This is the 3rd consecutive year that I’ve beat all the forecasts in the AIA Consensus. In fact, looking back at 2015-2019 there are several other years in which I beat out the AIA Consensus estimates.

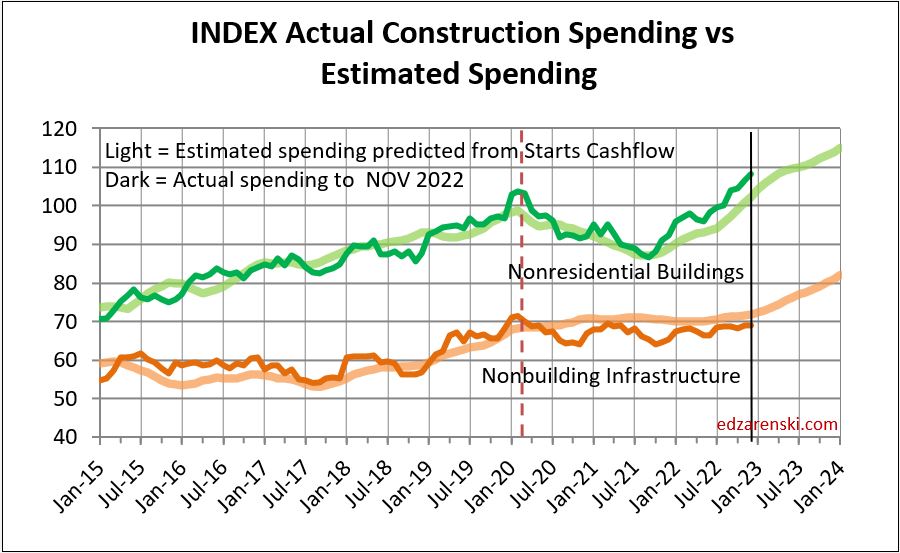
I’m including this next plot because it shows the accuracy of my nonresidential forecasts when comparing my cash flow forecast amount to the actual spending amount. It has proven to be pretty accurate over the years.
Behind The Spending Forecasts
2-1-23 Here’s a look at Nonresidential Buildings Construction Spending Forecasts for 2023. What’s Behind a Forecast?
Two things to look at when developing a forecast: What is the current rate of spending (SAAR), and what direction has it been moving?, and, What has been the recent activity in new starts (new contract awards)?
Most of the spending from new starts (all starts in total from Jan thru Dec) occurs in the year following the start. A reasonable spending estimate (across a large volume of work) is 20:50:30. So, for the sum total of all starts in the year, 20% gets spent in the 1st year (the year started), 50% the 2nd year and 30% the 3rd year. So approximately 50% of all new starts last year gets spent this year. The ratio can be much different from market to market. In other words, the most influential factor on the rate and trajectory of spending this year (barring something such as a pandemic or a recession) is starts from last year.
Here is my current baseline data:
- Construction spending for 2022 in the 2-1-23 release is $520 billion, up 11.6%
- Construction Starts (per Dodge) up ~38% in 2022, up 15% in 2021 and forecast down 10% in 2023.
- Current rate of spending (SAAR avg in Q4) is $560 bil, increasing $5bil-$10bil/month.
The increasing rate of spending makes sense, since starts were up so much in 2021 and 2022, and starts in the prior year is the greatest influence on rate of spending in the current year. Average nonres bldgs spending for 2022 is $520bil and the Q4 rate of spending is $562bil. The current rate of spending (SAAR in Dec) is 8% higher than the 2022 total spending and is increasing.
If something happened to stall spending right now at the current rate, it is at an annual rate of $562 billion, 8% higher than the average from 2022. So, as we begin 2023, with no forecast for a downturn, we could expect 2023 total spending would be at a minimum 8% higher than 2022. Since the current rate of spending is increasing, we could reasonably expect 2023 spending will add to the 8% starting advantage. This is a solid starting point for forecasting 2023 since this is already on record.
I prepared this following table to show the starting annual rate of spending for all of the markets, in particular the nonresidential buildings markets. As of Q4 2022, or the starting point for 2023, we see a few markets are only 3% to 5% above the 2022 average and a few are considerably higher. Also included in this table is the percent growth in new starts in 2022 for each market.
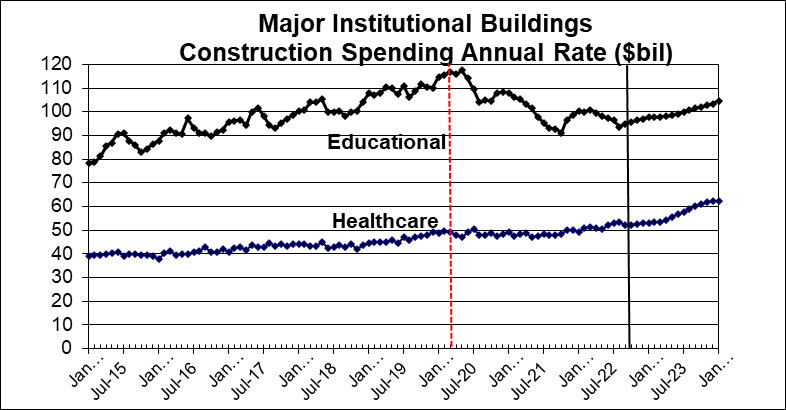
Let’s use an example: The Educational market, in Q4, or as we begin 2023, has monthly spending at a rate 4.9% greater than 2022. Starts increased 8% in 2022, so there will be a slight to moderate increase to spending in 2023. If spending growth stalls at the current rate, it will finish 2023 at 4.9% over 2022. The only way it should fall to less than that in 2023 is for some decline in some months in 2023 to less than the current rate of spending in Q4. Since all markets have substantial new starts to feed 2023 spending, all markets should post spending in 2023 higher than Q4 2022.

The rate of spending in 2023, being influenced predominantly by a 38% increase in starts in 2022, is projected to continue increasing throughout 2023. The monthly cashflow of the starts $ from all previous years that still generate spending in 2023 is what determines the rate of change in spending. My forecast has nonresidential buildings spending increasing steadily from a rate of $570 billion in January to $625 billion in December.
What data supports my forecast? Spending is already, in Oct-Nov-Dec, 8% higher than the average for 2022, so we begin 2023 at a rate of spending up a minimum 8% higher than the average for 2022. The average for 2023 could fall below the current 8% IF we were to experience some unforeseen negative occurrence in the coming months. I don’t foresee that happening. In 2022 we realized the largest ever one-year increase in new starts, up 38%. Starts were also up in 2021, up 15%. The monthly rate of spending is up 12 of the last 14 months, has increased for 6 consecutive months and is up 10% in the last 6 months. The rate of spending is predicted to increase 10 out of 12 months in 2023, a total increase of 11% over the year. Barring any unforeseen negative occurrence, the trajectory in the rate of spending is increasing and 2023 spending will finish well above the 8% advantage starting at the beginning of the year.
My total forecast for Nonresidential Buildings spending in 2023 is $616 billion, an increase of 18.5% over 2022.
The AIA Consensus Construction Forecast, December 2022 predicts only a 5.8% increase in spending for nonresidential buildings in 2023. Five of the nine forecasts provided in the Consensus Forecast are below the 5.8% consensus average. Only two forecasts are higher than 8% which is the projected minimum growth as we begin 2023, as explained above. As we begin the year with data, as of December, already at a rate 8% greater than the average for 2022, and with record new starts indicating an increasing spending rate, how is a forecast developed lower than that? What’s behind those spending forecasts?
This article was updated on 2-2-23 from November data to December data for clarity and to include the table showing Q4 data. Overall, the premise has not changed.

Self-Checking Forecast
Two plots track how construction forecast matches up to actual spending. The light line is the monthly growth predicted by my forecasting. The same color dark line is the actual spending. The changes in Residential dominate the 1st plot, so the 2nd plot is just Nonresidential to improve the scale.
One comment about the Residential plot: Starts, which are needed to create the forecast, may not have accounted for the extreme inflation, so spending could have easily grown to 5% to 10% higher than the starts would have forecast. Notice the similarity between the two residential plots. Although the forecast is not at the same magnitude as the actual spending, it is still predicting the slope, the change in spending. Jul20 to Jan21 is where the plots varied.
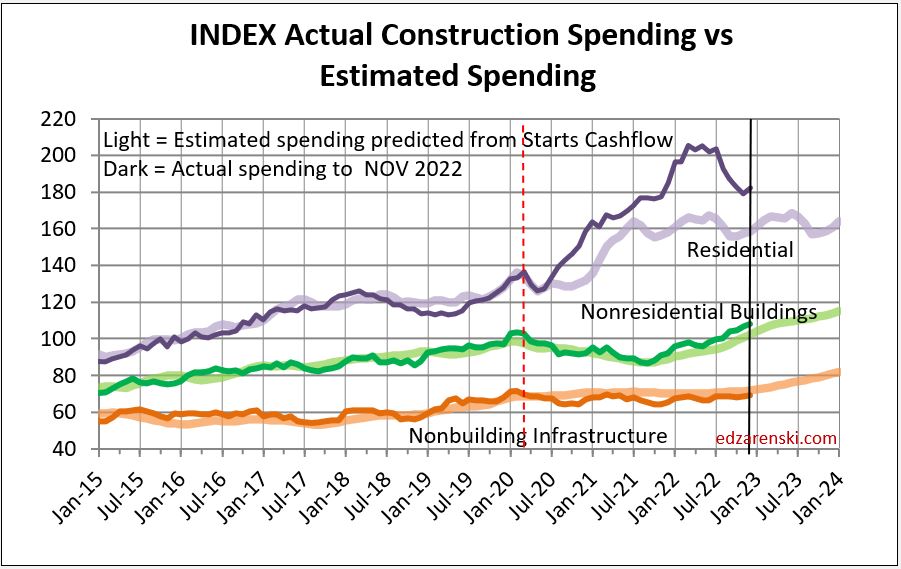
Nonresidential forecasts vs actuals compare really well. By the end of 2020, my model was predicting a low point in nonresidential buildings spending out in the 2nd half of 2021. Nobody else predicted that bottom. The Starts Cashflow model does a good job of predicting spending.


Infrastructure Construction Expansion – Not So Fast
Only once in 25 years have heavy engineering construction jobs increased more than 5% in one year (7.5% in 2018, 72,000 new jobs). Most of the time jobs growth is under 4% (40,000 jobs). Average growth the last 12 years (see notes below) is near 3% or 30,000 jobs per year.
U. S. Bureau of Labor Statistics (BLS) national data shows there are currently 1,078,000 Heavy Engineering jobs. In 2019 there were 1,084,000. There was a loss of nearly 100,000 heavy engineering jobs in early 2020 due to the onset of the pandemic. In 2022, heavy engineering jobs have been nearly constant, just above 1,070,000 the entire year.
Highway/Bridge comprises approximately 30% of all heavy engineering spending, so supports about 300,000 jobs per year.
The current forecast for new construction starts has increased the forecast for spending growth dramatically above previous years. Both starts and spending statistics give an indication of what to expect in the jobs situation. The spending forecast is indicating a need for a large increase in jobs to support the new work. Spending (also consider inflation) is the critical value that determines the need for jobs. Without sufficient jobs, the spending cannot take place. If jobs do not increase to support the forecast spending, the timeline for the spending very likely will get extended.
It takes 400 jobs per year to put in place $100 million of heavy engineering construction in the year. (Some types of work would take 500 jobs, but I’ll work with 400 here). A construction program that hypothetically adds $1 billion of new construction starts in a year would see that work put in place (for Highway work) approximately over the next few years at a ratio similar to a 15:30:35:20 schedule, $150 million the 1st year, $300 million the 2nd year, $350 million the 3rd year and $200 million in the 4th and 5th years. To support $150 million growth in the 1st year would require 600 new jobs. To support an increase of $1 billion in spending in one year would require 4,000 new jobs.
How will the average growth in jobs affect the growth in new starts and forecast spending?

Modeling the new starts forecast, based on the spending schedule outlined above, projects the spending forecast for Highway/Bridge work over the next few years will increase by $15 billion/year. This would indicate a need to add 15 x 4,000 = 60,000 new highway construction jobs each year in 2023, 2024 and 2025. But the entire heavy engineering jobs pool has increased by that amount only once in 25 years and average growth for all heavy engineering jobs is only 20,000 jobs/year. If we take out 2020, when jobs plummeted, the average growth from 2011 to 2022 was 30,000 heavy engineering jobs per year. Keep in mind, highway is only 30% (6,000 to 9,000) of those averages. This indicates it will be very difficult to support spending growth of this magnitude. While the starts projections and resulting spending forecast indicate rapid growth, this market sector has never experienced spending or jobs growth this fast and it is likely that growth will be slower than indicated.
Some of this added work will be absorbed into the existing workforce, backfilling a large deficit in business volume. See this short post Construction Spending – Volume – Jobs Since the Pandemic, nonbuilding construction volume (spending minus inflation) is down 20%, but nonbuilding jobs are down only 1.5%. Compared to 2019, nonresidential construction has an 18% business volume deficit. In other words, Nonres construction in 2022 now has 18% more jobs per volume of work put-in-place than it did in 2019. Total all construction business volume in that period is down 10% while jobs are up 1.5%.
Aside from backfilling volume of work, this shows a shortfall of workers that would likely be needed to support the increased workload. The labor force is insufficient to accommodate that large an annual increase in spending. This could result in one or more of these outcomes: either the workforce must somehow increase faster, or the project spending could slow and duration would get extended, which is more likely.
Jobs shortfall to support 2022-2026 spending identifies unsupported need. If jobs cannot be filled, annual spending will be lower and construction timeline would get extended.
Currently, national construction unemployment rate is near or under 4%. That is an extremely tight jobs market, not an easy growth situation. Typically, when unemployment is in the 6% to 8% range there are workers on the sidelines ready to go right back to work. Unemployment seldom falls below 5%. The current jobs situation and unemployment rate seems to indicate there are few workers ready and available to support an immediate increased workload. This adds to the difficulty of expanding the workforce at a rapid rate.
In this analysis, the potential rate of jobs growth and the current unemployment rate both suggest that the projected rate of spending growth would not be supported. A slower rate of spending leads back to reducing starts.
See Also Burning Questions – Recession, Labor, Infrastructure

Construction Inflation 2023
Construction Inflation
1-16-24 SEE Construction Inflation 2024
1-12-24 PPI Inputs table updated to Dec data, updated quarterly inputs, updated 2023 Firms Inflation plot
12-13-23 PPI ( Inputs Only) updated to Nov data
11-15-23 PPI Inputs and Final Demand updated to OCT data
10-13-23 PPI Inputs updated to SEP data
10-4-23 PPI Inputs and Final Demand tables updated to AUG data
8-11-23 PPI Inputs and Final Demand tables updated to July data
8-19-23 Inflation Table 2015-2025 updated to Q2 2023
Usually construction budgets are prepared from known “current” costs. If a budget is being developed for a project whose midpoint of construction costs is two years in the future, you must carry in your budget an appropriate inflation factor to represent the expected cost of the building at that time. Why the midpoint? Because half the project cost occurs prior to that point and half occurs later than that. The balance point for spending is 50-60% into the schedule. Construction inflation should always be calculated from current cost to midpoint of construction, or in the case of converting an older actual cost to a future budget, from midpoint to midpoint.
Any time a construction project is delayed or put on hold to start at some future date, construction cost inflation must be calculated and added to the previous budget to account for the unanticipated cost increase due to the delay. Of utmost importance is using appropriate cost indices and forecasting future cost growth to account for the difference in original budget and revised budget.
The level of construction activity has a direct influence on labor and material demand and margins and therefore on construction inflation.
- Long-term construction cost inflation is normally about double consumer price index (CPI).
- Although inflation is affected by labor and material costs, a large part of the change in inflation is due to change in contractors/supplier margins.
- When construction volume increases or decreases rapidly, margins change rapidly.
When construction is very actively growing, total construction costs typically increase more rapidly than the net cost of labor and materials. In active markets, overhead and profit margins increase in response to increased demand. These costs are captured only in Selling Price, or final cost indices.
General construction cost indices and Input price indices that don’t track whole building final cost do not capture the full cost of inflation on construction projects.
Consumer Price Index (CPI), tracks changes in the prices paid by consumers for a representative basket of goods and services, including food, transportation, medical care, apparel, recreation, housing. This index in not related at all to construction and should not be used to adjust construction pricing.
Producer Price Index (PPI) for Construction Inputs is an example of a commonly referenced construction cost index that does not represent whole building costs. The PPI tracks material cost inputs at the producer level, not prices or bids at the as-built level.
Engineering News Record Building Cost Index (ENRBCI) and RSMeans Cost Index are examples of commonly used indices that DO NOT represent whole building costs yet are widely used to adjust project costs. Neither includes contractor margins.
It should be noted, there are far fewer available resources for residential inflation than for nonresidential inflation.
One of the best predictors of construction inflation is the level of activity in an area. When the activity level is low, contractors are all competing for a smaller amount of work and therefore they may reduce bids. When activity is high, there is a greater opportunity to bid on more work and bids can be higher. The level of activity has a direct impact on inflation.
To properly adjust the cost of construction over time you must use actual final cost indices, otherwise known as selling price indices.
Selling Price is whole building actual final cost. Selling price indices track the final cost of construction, which includes, in addition to costs of labor and materials and sales/use taxes, general contractor and sub-contractor margins or overhead and profit.
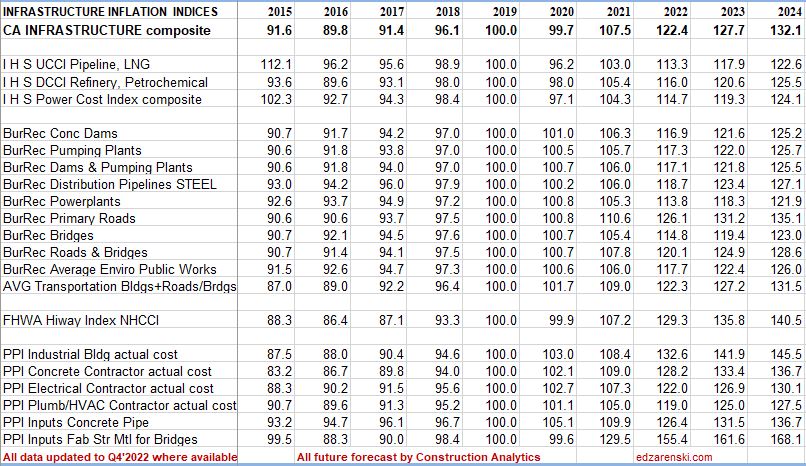
Refer to National Inflation Indices for comparison to several national selling price indices or various Input indices. National reference indices are useful for comparison. Few firms project index values out past the current year, therefore all future projections in these tables are by Construction Analytics.
1-18-23 Construction Analytics PPI Tables and Building Cost Index
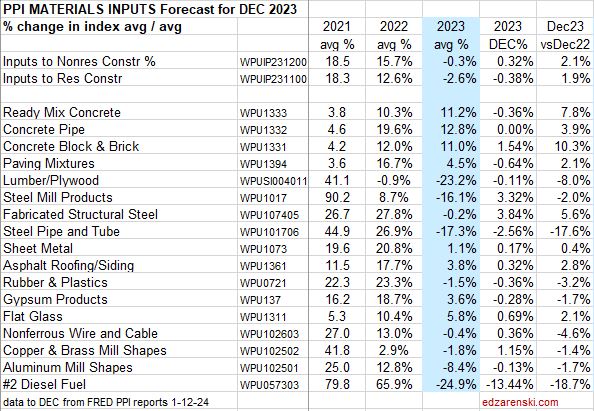
Construction Inputs to Nonresidential Buildings dropped for five of of last six months, now down 5.2% since June, but still up 7.2% since last December. However, the average index for 2022, when compared to the average for 2021, is up 15.7%.
The average growth for the year accounts for all the peaks and valleys within each year and is the value carried forward into the index tables and charts. A glaring example of the difference between Dec/Dec tracking, or year over year, and annual average tracking, is Steel Mill Products which is down 28.7% Dec22/Dec21, but the annual average for 2022 is still up 9.0% from the average 2021. In fact, the last three years show Dec/Dec combined inflation is +71%, but the annual averages for the last three years show total inflation growth of 87%. Annual averages should be used to report inflation.
Residential inputs are down seven of the last eight months, down 7.1% since April, but still up 7.1% since last December. The average for 2022, when compared to the average for 2021, is up 12.7%.
Several major cost components have been on decline the last few months: Lumber/Plywood, Steel Mill Products, Fabricated Steel, Steel Pipe and Tube, Aluminum and Diesel Fuel. Of the 15 items tracked here, 10 declined in the last quarter. Concrete is the only product that has not posted any monthly decline in 2022. Costs are still high, but are moving in the right direction after 1st quarter 2022 costs that averaged +7% (28%annual) to +8%. Historically, most cost increases are posted in the 1st quarter and the least in the 4th quarter.
If inputs costs remain where they are right now as we start the year, input costs for 2023 will finish the year at -2% Nonres and -4% Residential. If we were to post small but steady cost increases of 0.25%/mo for the rest of the year, we would end with both Res and Nonres input costs up 4% for the year.
4-14-23 PPI Inputs slowed considerably since last year.
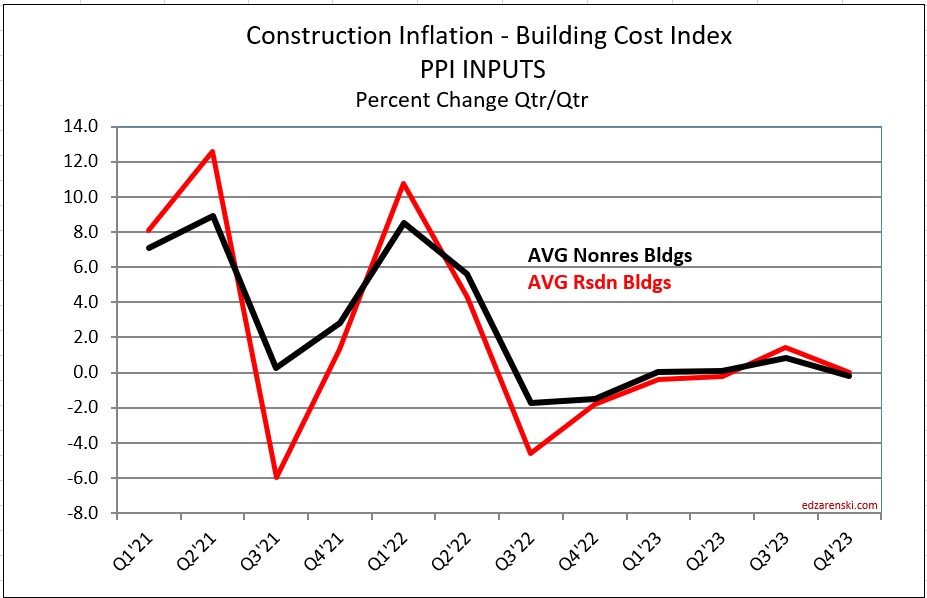
PPI Inputs to Construction March 2023—Nonres down 0.1% in Mar, down 6 of last 12mo, -1%over 12mo. Rsdn down 0.3% in Mar, down 9 of last 12mo, -7.5% over 12mo.
Qtrly change last 5 qtrs Nonres 9.7, 3.0, -3.2, -2.5, 1.6 Rsdn 15.2, -1.4, -5.0, -2.3, 1.0
Historically, the 1st or 2nd qtr would post the highest gains for the year. Here’s 1st and 2nd qtr for 2021, 2022, 2023
Nonres 7.1% & 8.9, 9.7 & 3.0, 1.6 & … Rsdn 8.1 & 12.6, 15.2 & -1.4, 1.0 & …
Last 12 months down -1.0% for Nonres and -7.5% for Rsdn. 1st qtr 2023 1.6 and 1.0, instead of (2022) 9.7 and 15.2% and (2021) 7.1 and 8.1%
Still early, but 12mo, 6mo and 3mo PPI signs are pointing down or at least low increases for construction inputs in 2023
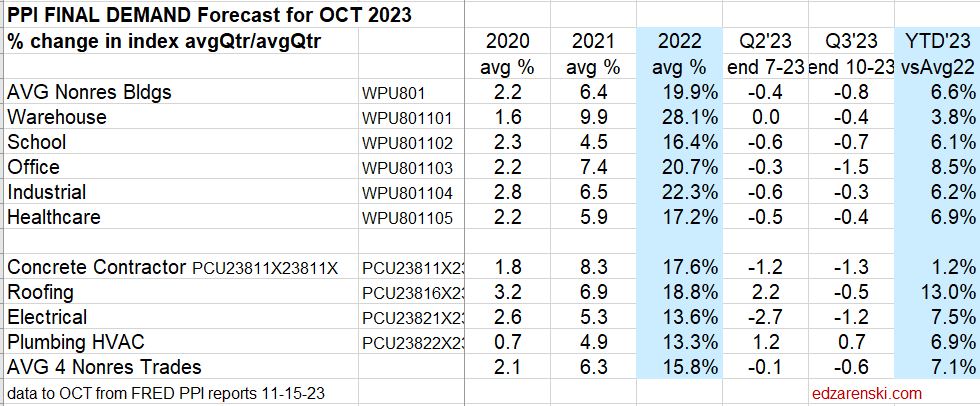
Be careful when referencing the 2023YTD. YTD is the growth so far this year. That is growth AFTER December. That does not represent the growth from the avg 2022. As an example, using Inputs to Nonres, the average growth in 2022 was 15.7%. That could be expressed as a starting Jan index of 100, a Jul 1 index of 115.7 and an ending Dec index of 131.4. The average of all 12 months in 2022 = 115.7, the average being at midyear. Well by averages the midyear index would be 115.7. The 2023YTD index is 2.6% since December (131.4) not 2.6% added to 115.7. This really highlights why it is much better to track the index than to report the percentage.
The last column, YTD vs 2022avg, gives an indication of 2023 avg if current YTD costs remain constant for the remainder of the year.
PPI INPUT TABLES and Inputs plot UPDATED 1-12-24
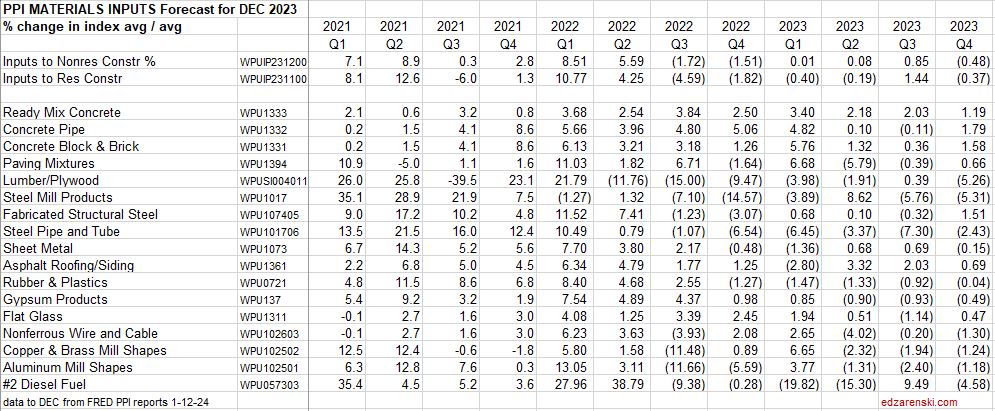
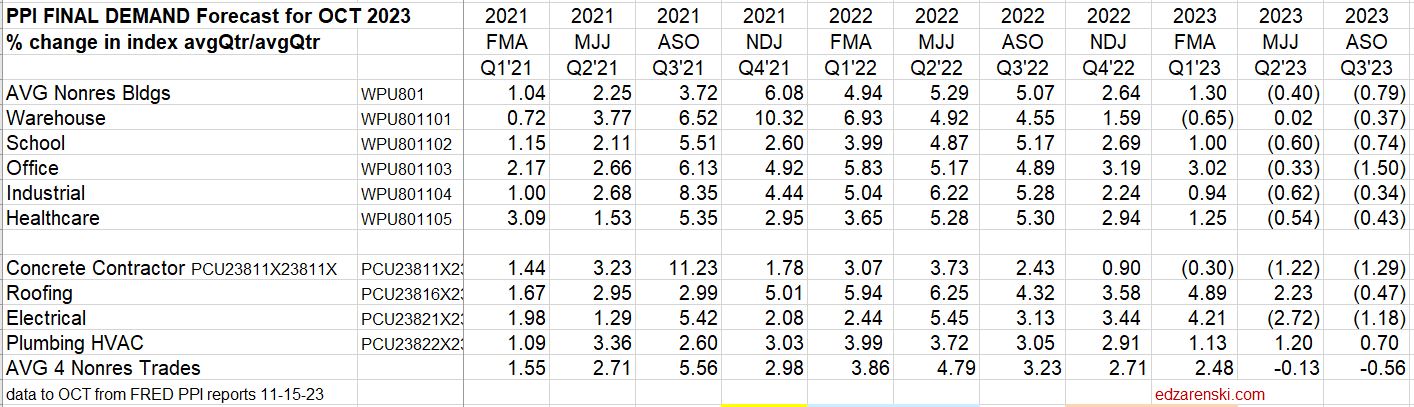
Final Demand PPI, or Selling Price, represents contractors bid price to client. Includes labor, material, equipment, overhead and profit. Labor includes change in wages and productivity. Every three months (Jan, Apr, Jul, Oct) BLS performs an update survey to correct these Final Demand indices. For the past six quarterly updates, about 80% to 90% of the change in the index was posted in the update month. Therefore, Final Demand indices should not be referenced monthly. These are quarterly indices. January is an update month. PPI Final Demand for Jan index is basically the correction for Nov and Dec. The index should NOT be compared mo/mo. Compare qtr/qtr, but make sure to use the correct update month with two other months, (Jan +Dec+Nov)/(Oct+Sep+Aug) The table shows the slowing progression from a 20% annual rate of gain for all of 2022 (avg nonres bldgs), to 2% the last two qtrs to only 0.1% the last qtr. Slowing is good. The last column, YTD vs 2022avg, gives an indication of 2023 avg if current YTD costs remain constant for the remainder of the year.
PPI FINAL DEMAND TABLE UPDATED 11-15-23
The Construction PPI Final Demand for Nonres Bldgs posted declines for the two most recent adjustment months, Apr and Jul. If distributed back to the months being corrected, Apr into Feb and Mar, Jul into May and Jun, it shows all bldgs, except Offc, have at least 6 months of declining cost. Office has been declining for only 3 months but Warehouse has been declining for 8 months.
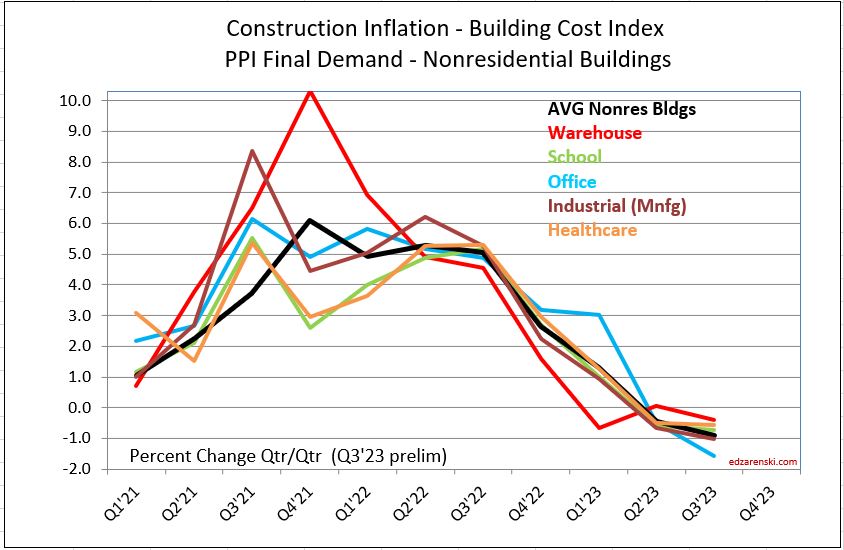
The final demand PPI index for 2022 nonresidential buildings is substantially higher than Construction Analytics nonresidential buildings cost index reported in the index tables. These PPI values are but one of the references used to develop construction analytics building cost index.
Current and predicted Inflation rates 1-18-23:
- 2020 Rsdn Inflation 4.5%, Nonres Bldgs 2.6%, Non-bldg Infra Avg -0.3%
- 2021 Rsdn Inflation 13.9%, Nonres Bldgs 7.4%, Non-bldg Infra Avg 7.9%
- 2022 Rsdn Inflation 16.1%,Nonres Bldgs 12.9%, Non-bldg Infra Avg 13.8%
- 2023 Rsdn Inflation 1.9%, Nonres Bldgs 4.0%, Non-bldg Infra Avg 4.3%
Current and predicted Inflation updated to Q4’22 3-3-23
- 2020 Rsdn Inflation 4.5%, Nonres Bldgs 2.4%, Nonbldg Infra -0.3%
- 2021 Rsdn Inflation 14.0%, Nonres Bldgs 8.0%, Nonbldg Infra 7.9%
- 2022 Rsdn Inflation 15.8%, Nonres Bldgs 12.2%, Nonbldg Infra 13.8%
- 2023 Rsdn Inflation 2.2%, Nonres Bldgs 4.8%, Nonbldg Infra 4.7%
Current and predicted Inflation updated to Q2’23 8-17-23
- 2021 Rsdn Inflation 13.9%, Nonres Bldgs 8.2%, Nonbldg Infra 7.8%
- 2022 Rsdn Inflation 15.7%, Nonres Bldgs 12.1%, Nonbldg Infra 16.9%
- 2023 Rsdn Inflation 1.2%, Nonres Bldgs 5.4%, Nonbldg Infra 3.9%
- 2024 Rsdn Inflation 4.0%, Nonres Bldgs 3.8%, Nonbldg Infra 3.5%
Current and predicted Inflation updated to Q3’23 10-2-23
- 2023 Rsdn Inflation 1.4%, Nonres Bldgs 6.0%, Nonbldg Infra 3.9%
- 2024 Rsdn Inflation 4.0%, Nonres Bldgs 3.8%, Nonbldg Infra 3.5%
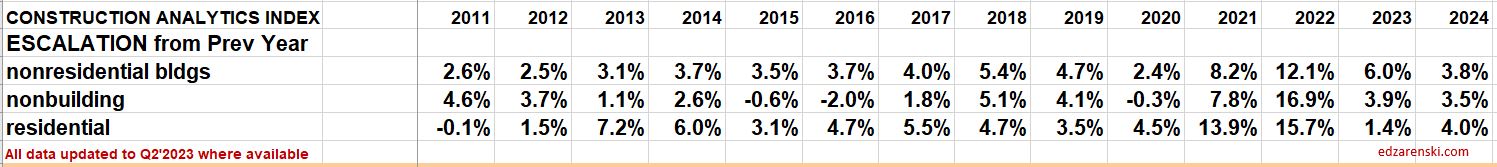
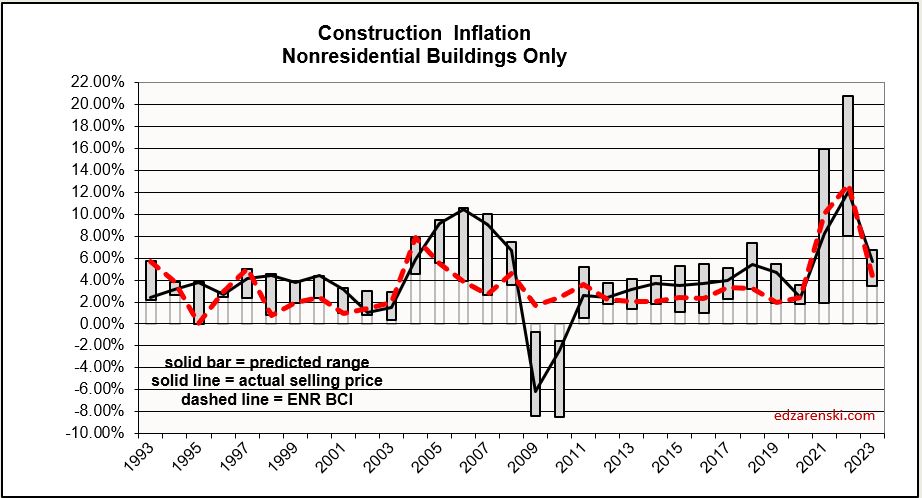
Most of the tables and plots here are cumulative indexes. Construction Inflation annual percent for Nonres Bldgs is plotted on this bar chart. The gray bar represents range of predicted inflation from 8 to 10 sources. The dark line is Construction Analytics (final cost) BCI. The red dash is ENR BCI (input index). The range in 2021 and 2022 was widest ever. The range for 2023 is small.
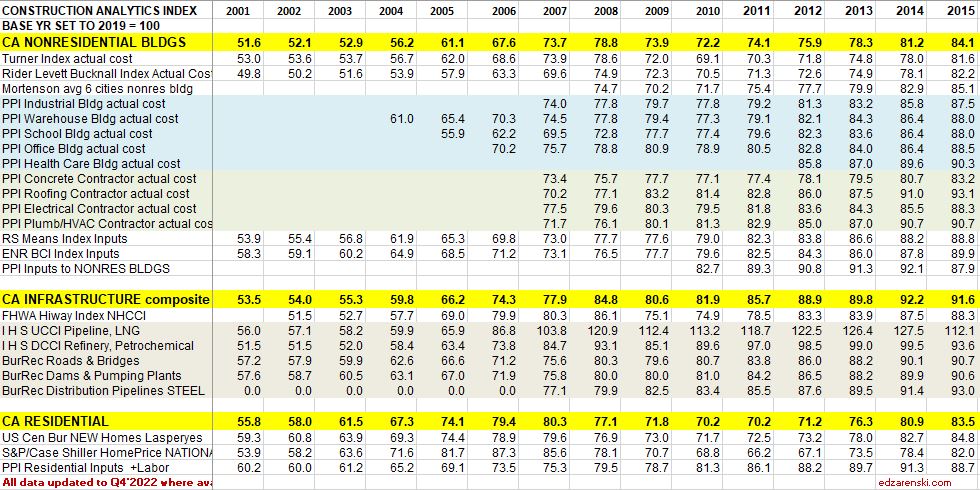
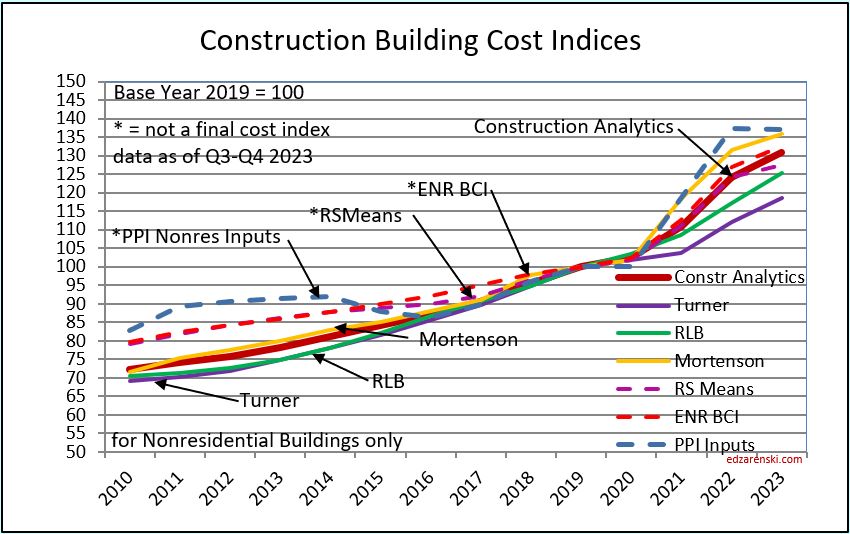
Construction Analytics Building Cost Index and other industry references
Tables and Plots 2001-2015 updated to Q4’22 2-6-23:
the following table 2015-2024 was updated to Q2 2023 on 10-2-23
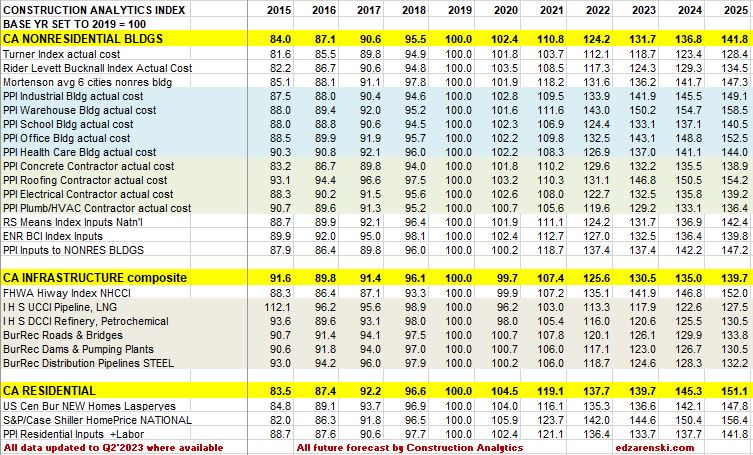
In the table above, dividing the current year by the previous year will give the current year inflation rate. All indices are the average rate for the year.
Also in the tables above, all reference indices data is gathered, then all are normalized to a common base, 2019 = 100. This allows to see how different indices compare.
How to use an index: Indexes are used to adjust costs over time for the effects of inflation. An index already compounds annual percent to prevent the error of adding annual percents. To move cost from some point in time to some other point in time, divide Index for year you want to move to by Index for year you want to move cost from, TO/FROM. Costs should be moved from/to midpoint of construction, the centroid of project cost. Indices posted here are at middle of year and can be interpolated between to get any other point in time.
Tables and Plots updated to Q4’22 2-6-23:
This Plot updated to Q3’23 11-15-23:
Plots below updated to Q4’23 1-12-24:
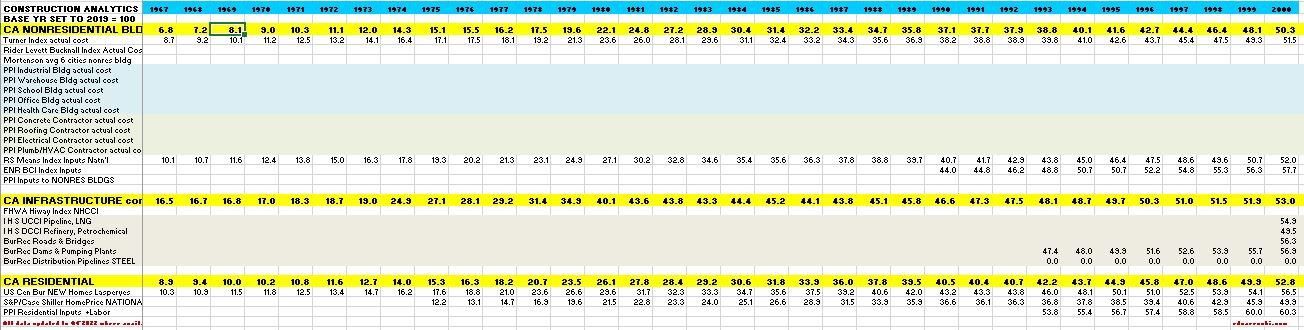
4-21-23 This table and plot is an extension of the tables and plots above. Data is as of Q4 2022, but the table covers from 1967 to 2000. Data is pretty sparse.
Previous year Construction Inflation 2022 – updated 12-10-22
Previous year PPI Tables 2022 Producer Price Index to NOV’22
Links to Data Sources Construction Inflation >>> Links
Construction Year-End Spending Forecast Dec’22
A few brief comments. More comments to follow
See also Construction Briefs Nov’22

With only one month to go and eleven months in the year-to-date spending, we should see very little variance from the Forecast for 2022, which is expected to finish up 10.1% at $1,791 billion. Residential spending will finish up 13.4% even though it’s posted declines in six of the last eight months and is down 13% since March. Nonresidential Buildings spending, expected to finish up 10.9%, is being driven by Commercial Retail (up 20%, in this case Warehouses) and Manufacturing, which will finish the year up over 35%. Non-building Infrastructure finishes the year up only 1.9% due to a large drop off in Power spending. Highway and Public Utilities helped offset some of the Power decline.
Total construction spending for 2023 is forecast to increase +5.1%. Residential -2%, Nonres Bldgs +15%, Nonbldg +8%.
Some high $ items: Comm/Rtl +16%, Manufacturing +35%, Highway +11%, Transportation +16%, Pub Utilities +12%.
Residential starts in 2021 were up +21% to a lofty new high. But starts are forecast flat in 2022 and 2023. Spending grew 44% in the last 2yrs, but inflation was 30% of that 44%. With zero growth in starts forecast for 22-23, residential spending struggles to keep up with inflation. Residential spending will post a decrease of 2% in 2023. If inflation is 5%, that’s an 7% loss of business volume. Midyear there is potential for 6 consecutive down months.
Nonres Bldgs new starts last 2yrs (2021-2022) are up 50%. Spending next 2yrs is forecast up 20%.
Nonresidential Bldgs starts in Sept dropped 23% from August and yet still that was the 3rd highest month ever. July and August were 2nd and 1st. October starts added another 9% over Sept., taking over the 3rd best spot. Even though November dropped 25% from Oct., Nov. starts are still higher than the 1st half 2022 average.
Construction starts for Nonresidential Bldgs posted each of the last 4 months thru October higher than any months ever before. The avg of last 4 months is 33% higher than the avg of the best previous 4 mo ever (even non-consecutive).
Growth in Manufacturing construction starts for 2022 far surpasses growth in any other market, up over 150% year-to-date. Spending for Manufacturing Bldgs is expected to increase more than 30% in 2023. This seems high after already increasing 35% in 2022, but when taking into consideration that the expected spending for 2023 is only 15% higher than where we stand already in Q4 2022, it seems much more reasonable.
Backlog as we begin 2023 is up 16% over 2022, all nonresidential.
Inability to expand staff fast enough to match spending growth may limit some spending to lower than forecast.


Nonbuilding Infrastructure starts for 2022-23 are forecast up 37%. Spending 2023-24 is forecast up 20%. Starts since July are up 50% over the 1st half 2022 average. Highway/Bridge/Street starts increased almost 25% in 2022 and are forecast to increase 20% in 2023. Highway spending is up 9% in 2022, then increases 11% in 2023. A bigger spending increase of 16% occurs in 2024. Transportation starts will drop more than 30% in 2023, but that comes after a 100% increase in 2022. Transportation spending will jump 16% in 2023. Public Utilities, Sewer-Water-Conservation, collectively will post 60% growth in starts for 2021-22-23. Spending for this group increases 45% for 2022-23-24.

Construction Spending – Volume – Jobs
12-3-22
This plot is not showing good performance. Volume and jobs should be moving directly in tandem. When inflation is very high, spending climbs rapidly. But most of the climb is just due to inflation. To find out what’s really going on we need to look at business volume. Take out the inflation $.
Business volume = Spending minus Inflation. Inflation adds nothing to business volume. Inflation adds only to the amount of revenue that changes hands.
In 2022, residential spending is up 16%. Sounds great, homebuilder’s revenues are up 16%. It’s great until you note that residential inflation for 2022 is 15%. Real residential business volume for 2022 increased only 1%.
Since Jan.2020 spending is up 20%. Revenues are up 20%. It’s pretty hard to not think you need additional staff to support 20% growth in revenues. But inflation is 30%. Take out the inflation dollars and we find that volume is DOWN 10%. Well, during that time, jobs increased 1 to 2%. And yet, business volume is down 10%. That’s a massive 11%-12% loss in productivity. With labor being about 35% of the total cost of a job, that’s added about 4% to total inflation.
I recently read an article that stated (attributed to Assoc. Bldrs. & Contractors) that the construction industry needs to add 1,000,000 jobs over the next two years. Here’s why that won’t happen:
1) The construction industry has never added more than 440,000 jobs in one year. It’s only gone over 400,000 four times in 50 years, the last time 2005, and never two years in a row. The most construction jobs added in a year since 2011 is 360,000 in 2014. The average growth rate from 2011 thru 2019, and now also in 2022, is 230,000 jobs per year. The most jobs added in any two consecutive years is just over 700,000 in 1998-99 and 2005-06. So, the construction industry may not have the capacity to grow 1,000,000 jobs even in two years.
2) Since the Pandemic, nonresidential construction volume is down 20%, but nonresidential jobs are down only 1.5%. Compared to 2019, nonresidential construction has an 18% business volume deficit. In other words, Nonres construction in 2022 now has 18% more jobs per volume of work put-in-place than it did in 2019. Total ALL construction business volume in that period is down 10% while jobs are up 1.5%.
3) Inflation is playing a key roll here. In 2022, construction spending is increasing $160 billion or 10%. But inflation is 13%. Real total construction business volume in 2022 is down 3%. Jobs are up. For 2023, spending is forecast to gain $80 billion, 4.6%, but after inflation volume will be down 1%. 2023 numbers are driven down by residential.
4) In 2023, nonresidential volume increases $35 to $40 billion. Residential volume drops $50 billion. It takes 4000 to 5000 jobs to put-in-place $1 billion of volume in one year. Nonbuilding and nonresidential buildings growth of $40 billion would need 160,000 to 200,000 new jobs. Some small amount of that will come from the drop in residential. But, go back and read #2 again.
Since Jan 2020, the construction industry as a whole has nearly +175,000 (+2%) more workers to put-in-place -$175 billion (-10%) LESS volume. That’s a huge loss to productivity that may take years to recover, if ever.

Midyear 2022 Spending Forecasts Compared – updated 2-1-23
How we doin?
In the AIA Midyear 2022 Consensus, eight firms provided forecasts for Nonresidential Bldgs markets construction spending for 2022. Their forecasts for 2022 are summarized here, percent +/- growth. Construction Analytics midyear forecast is included for comparison. Who is closest, who’s not? The year-to-date (YTD) value is through September 2022. I’ll update after final spending for 2022 is posted in Feb. 2023, and then revised in July. The Sept YTD data was released Nov.1st. I’ve included my current (Nov) forecast for 2022 final spending, the eventual target of all these forecasts, to the left of the table.
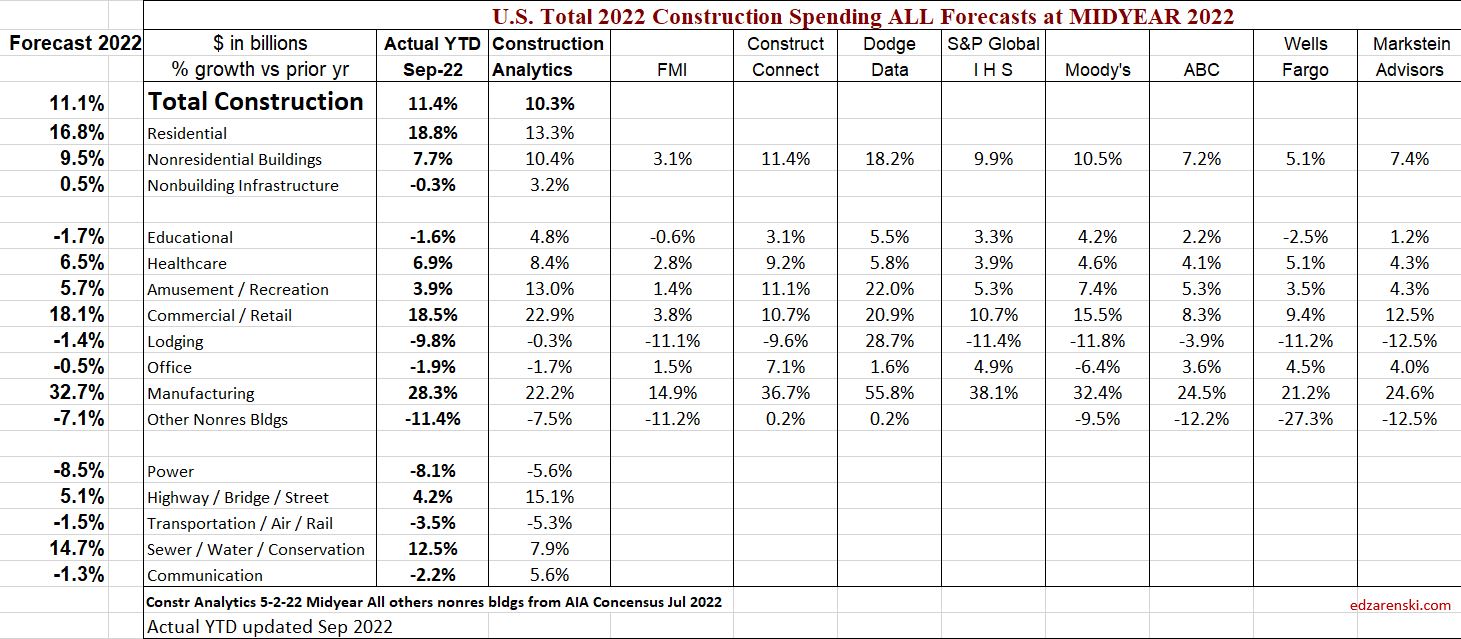
Here’s the initial 2022 total year spending released 2-1-23. This will get minor revisions in Mar, Apr and Jul. As in past years, I’ve highlighted in green for best estimate and red for worst estimate. This is the 3rd consecutive year I’ve produced collectively better forecasts than those published in the AIA Consensus. You can follow the links below this posts to prior year comparisons.

Construction Briefs Nov’22
Construction is Booming. Well, OK, construction is setting up to be booming in 2023-2024. New construction starts for Sept are down 19% from August and yet starts are still near the highest levels ever. Sept is 4th highest total starts ever, all four of the highest ever months of new starts are in 2022. July and Aug were the two highest months of new starts ever. Total growth in starts over 2021-2022 > Nonres Bldgs +50%, Nonbldg Infra +40%, Residential (all in ’21) +22%.
STARTS

Construction Spending will not be participating in a 2023 recession. Except, residential might. Residential starts in 2021 were up +21% to a really high new high. But starts are forecast flat in 2022 and 2023. Spending grew 44% in the last 2yrs, but inflation was 30% of that 44%. With zero growth in starts forecast for 22-23, spending struggles to keep up with inflation. Residential will post only an increase of 3% in 2023 spending, but midyear there is potential for 6 consecutive down months.
See also Construction Year-End Spending Forecast Dec’22
SPENDING BY SECTOR CURRENT $ AND INFLATION ADJUSTED CONSTANT $


Nonresidential Buildings new starts last 2yrs (2021-2022) are up 50%. Spending next 2yrs (23-24) is forecast up 21%.
Nonbldg starts 2022-23 are forecast up 38%. Spending 2023-24 forecast up 20%.
In 2023, it’s Nonresidential Buildings leading growth. In 2024, it will be Nonbuilding Infrastructure leading spending growth. Both are expected to grow more than the inflation index, so there will be real volume growth to report.
Residential construction (Dodge) starts since Jan 2021 have posted 17 out of 21 months of the highest residential starts ever posted. The 5 highest months ever are all in 2022.
Nonresidential Bldgs starts in Sept dropped 23% from August and yet still that was the 3rd highest month ever. July and August were 2nd and 1st.
Construction starts for Nonresidential Bldgs posted each of the last 4 (consecutive) months thru October higher than any months ever before. The avg of last 4 (consecutive) months is 33% higher than the avg of the best previous 4 mo ever (even non-consecutive). Growth in Manufacturing construction starts for 2022 far surpasses growth in any other market, up over 150% year-to-date.
Construction Spending Sept total up 0.2% from Aug. Aug & Jul were revised up 1.1% & 1.3%. Total spending YTD thru Sept’22 is up 11.4% from Sept’21. MAJOR movers; Mnfg up 16% since Jun. Jul & Aug were revised up 7.4% & 8.4%. Highway is up 9% since June. Jul & Aug were revised up by 4.0% & 4.4%.
SPENDING FORECAST

Total construction spending for 2022 is on track to increase +11.1%. Residential +16.8%, Nonres Bldgs +9.5%, Nonbldg +0.5%.
Comm/Rtl +18% Mnfg +32% Power -8% Pub Utilities +14%.
Current and predicted Inflation SEE Construction Inflation at Year-End 2022
Inflation adjusted volume is spending minus inflation.
Total volume for 2022 falls 1%. Rsdn +3%, Nonres Bldgs -1%, Nonbldg -9%.
Total volume for 2023 is up 1%. Rsdn -3%, Nonres Bldgs +8%, Nonbldg +2%.
SPENDING TOTAL ALL $ CURRENT $ AND INFLATION ADJUSTED CONSTANT $
Overall Construction Spending is up 15% since the onset of the pandemic, but, after adjusting for 25% inflation, volume is down 10%. Residential jobs are near even on track with volume, but Nonres and Nonbldg have volume deficits of approx 20-25% vs jobs.
- Feb 2020 to Aug 2022
- Resdn spend +42%, vol +6.5%, jobs +7%
- Nonres Bldgs spend -8%, vol -24%, jobs -3%
- NonBldg spend -7.5%, vol -24%, jobs +1%
JOBS VS CONSTRUCTION VOLUME VS SPENDING (VOL = SPENDING MINUS INFLATION

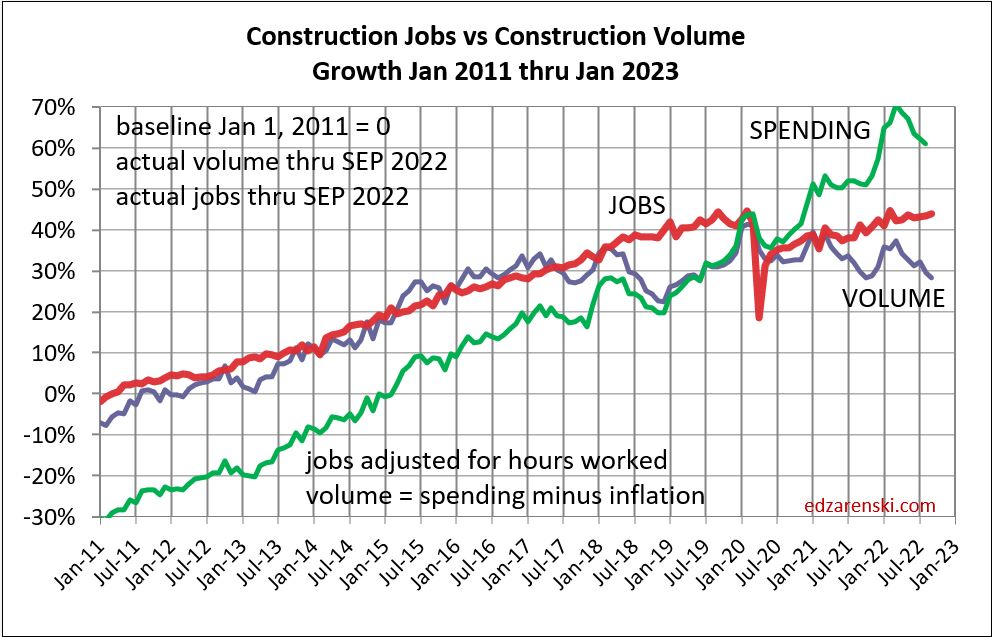
Labor Shortage? Jobs should track volume, not spending growth. Vol = spending minus inflation. Volume is down while jobs are up. If the same production levels ($ put-in-place per worker) as 2019 were to be regained, theoretically, nonresidential volume would need to increase 20% with no increase in nonresidential jobs. I don’t expect that to occur, therefore, productivity will remain well below that of 2019.
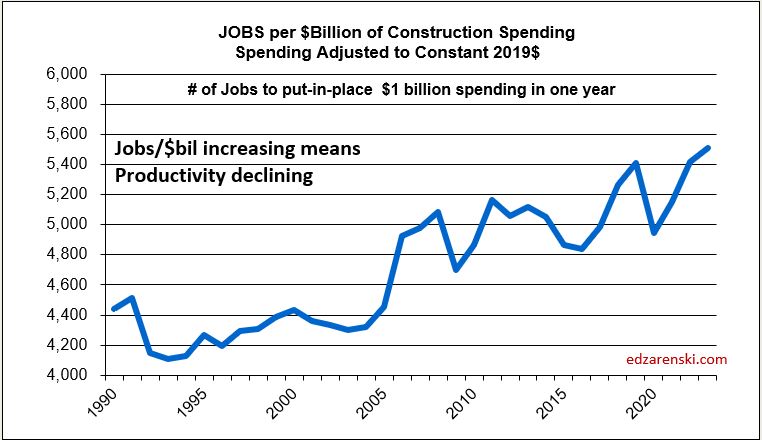
LABOR PRODUCTIVITY

Over the next year or two, there could be several billion$ of construction spending to repair hurricane damaged homes in Florida. That spending will NOT be reported in Census spending reports. Renovations to repair natural disaster damage are not recorded in construction spending. Construction spending to replace homes entirely lost to damage IS reported in Census spending, but is reported as renovations/repair, not new SF or MF construction.
RESIDENTIAL SPENDING SF-MF-RENO CURRENT $ AND CONSTANT $


