Home » Behind the Headlines (Page 7)
Category Archives: Behind the Headlines

Construction Spending 2021 update 6-1-21
Construction spending April 2021
Construction Spending is up 5.8% year-to-date (ytd), however that’s broken down into three parts, up 21.8% for residential, down -6.2% for nonresidential buildings and down -4.9% for nonbuilding infrastructure.
In the 1st 3 months of 2020, spending had reached an all-time high averaging a SAAR of $1,461 billion.
In the 1st 3 months of 2021, spending hit a new all-time high averaging a SAAR of $1,515 billion. In April, spending is now up to $1,524 billion.
But these new highs belie the situation in spending. Year-to-date, while residential is up 20%+, 14 of 16 nonresidential markets, 95% of total nonresidential market value, are down.
In Apr and May 2020, residential spending fell -6% and -5%, down a total of -11% in two months. Then residential spending increased every month for the remainder of 2020, By Dec 2020 residential spending was 24% higher than in Q1 2020. Residential spending for 2021 is forecast to end up 15.4% for the year, but (the annual rate in) Dec 2021 will be -8% lower than Dec 2020.
Nonresidential Bldgs did not follow the same magnitude of declines, down only -3.5% in April 2020 and only -0.5% in May. But Nonresidential Bldgs spending has been down 10 out of 13 months since March 2020, now down -7.5% from the avg in Q1 2020. Nonres Bldgs spending, forecast down -5.7% from current over the next eight months, is forecast to end at -6.0% for 2021.
Construction starts are leading the way to recovery, but construction spending this year, which is dependent mostly on starts from the previous year (down -22%), will remain depressed for nonresidential construction well into 2022. Recovery in backlog begins to build in a few markets in 2021. However, new nonresidential starts could double from the current rate of growth and it still wouldn’t be enough to turn 2021 nonresidential spending positive.
Aside from residential, recovery of revenue (spending) won’t begin in earnest until 2023.
The following table shows ytd through Apr $ and forecast for 2021/2022. Almost every nonresidential market is down ytd and down compared to the average in Q1 2020 before Pandemic Recession.

The impact of reduced starts in 2020 is starting to show up in the 2021 year-to-date results. Total Nonres Bldgs starts were down 22% in 2020, Nonbldg Infrastructure down 13%. Some of these markets will be affected by a downward trend in spending for two to three years.
2020 starts for select markets:
- Amusement -38%
- Commercial/Retail -14%
- Office -20%
- Lodging -50%
- Manufacturing -57%
- Power -38%
The greatest downward impact on spending will be felt in mid-2021. Over the next 9 months, every sector will post more down months than up months, although the declines will be most noticeable in nonresidential buildings.
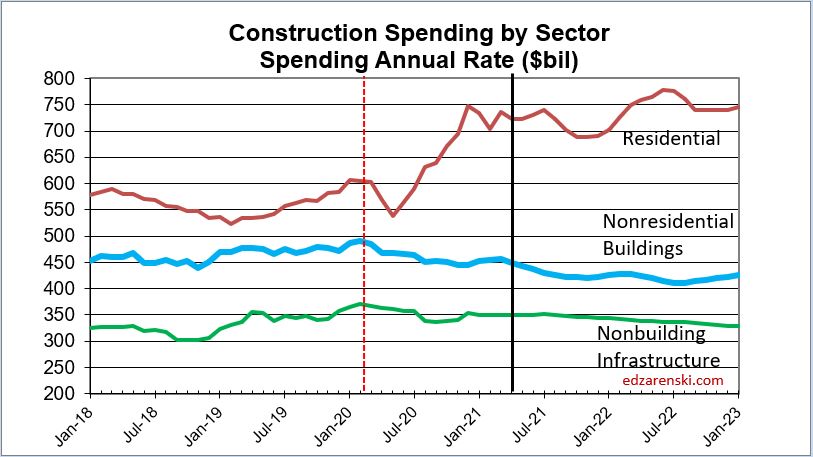
For the next few months the residential year-to-date comparison will be skewed. It is going to increase due to the steep fall-off in spending back in April and May 2020. Then months of strong growth, a total +38% in 7 months in residential from May 2020 onward, with no equivalent growth increase this year, will cause ytd comparisons to decrease. So, even though residential spending is not forecast to increase any more in 2021, residential spending will peak at +25% year-to-date in the May-June data (due to the steep decline in spending in 2020) before falling back to end at +15% ytd for year end.
YTD for nonresidential buildings, currently at -6.2%, will remain near this level for the rest of the year.
The following table shows two data sets: all markets spending compared to avg 1st qtr 2020 and forecast change for next 8 months. The forecast for the remainder of 2021 showing the trend, up or down, is down for almost every nonresidential market. So while most markets recovery to positive new starts growth in 2021, spending growth lags showing the downward trend in 2021 as a result of lost starts in 2020.

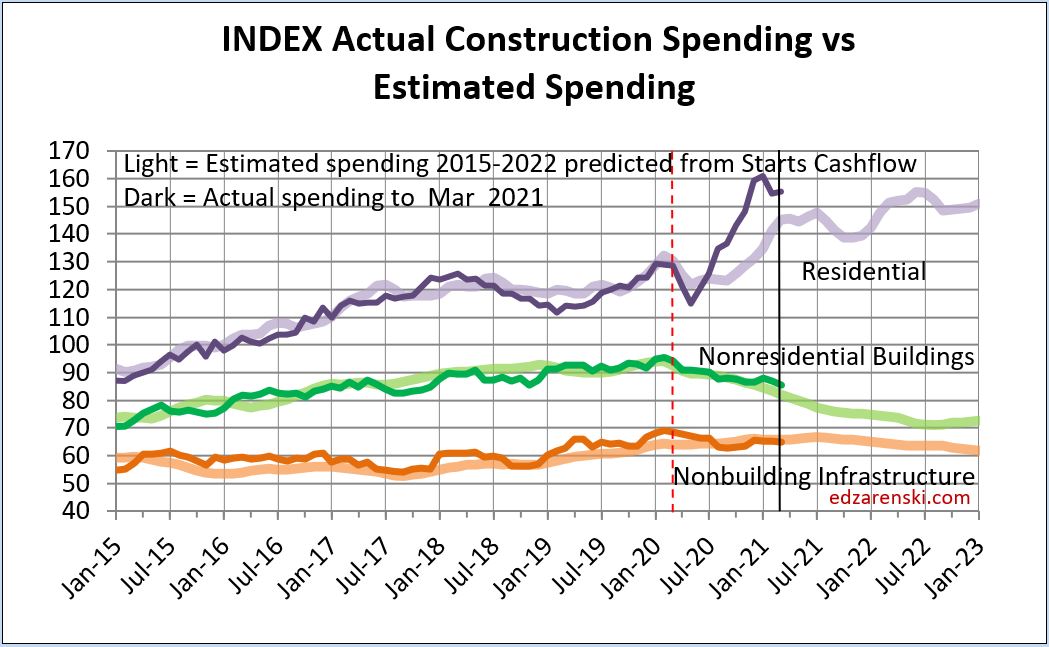
This next plot changes the scale of the spending plot so the nonresidential buildings data can be visualized much easier. This is the exact same data as in the Construction Spending by Sector plot above. The scale change helps immensely.
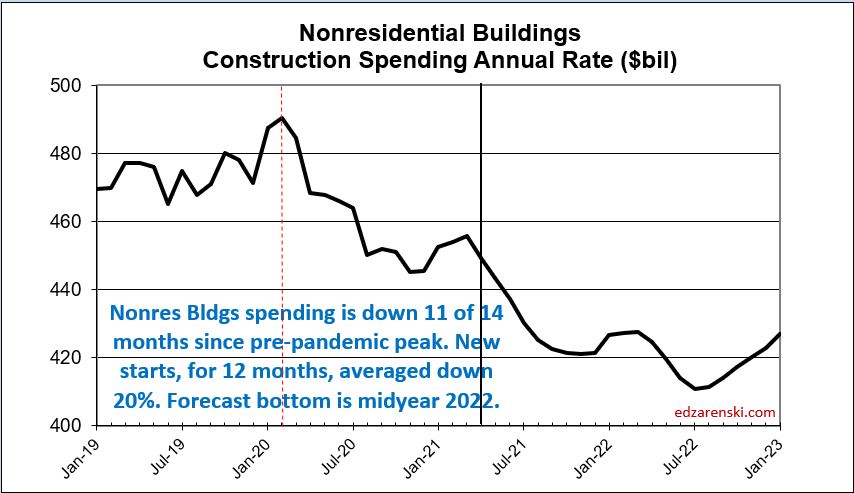
A typical batch of new construction starts within a year gets spent over a cash flow schedule similar to 20/50/30, that is, 20% of all starts in the year gets spent in the year started, 50% in the next year and 30% in years following. Total nonresidential buildings starts in 2020 were down 22% ($100bil in spending) and nonbuilding was down 13% ($50bil). Under normal conditions, we know how much of that $150 bil would have occurred in 2020, 2021 and 2022. That’s a loss of spending this year, and that loss remains a steeply downward slope as long as starts remain depressed. Nonresidential starts, down now for 12 months, posted some hint of recovery in April.
If infrastructure starts don’t begin until the 2nd half of the year, only 25% to 30% (of the 1st year 20/50/30 that is based on 12mo) gets spent in the 1st year. Therefore, even if $100 billion in new infrastructure starts begin in the 2nd half 2021, only 30% x 20% or only about 6% would get spent in 2021. That’s $6 billion, or less than 1% of annual construction spending.
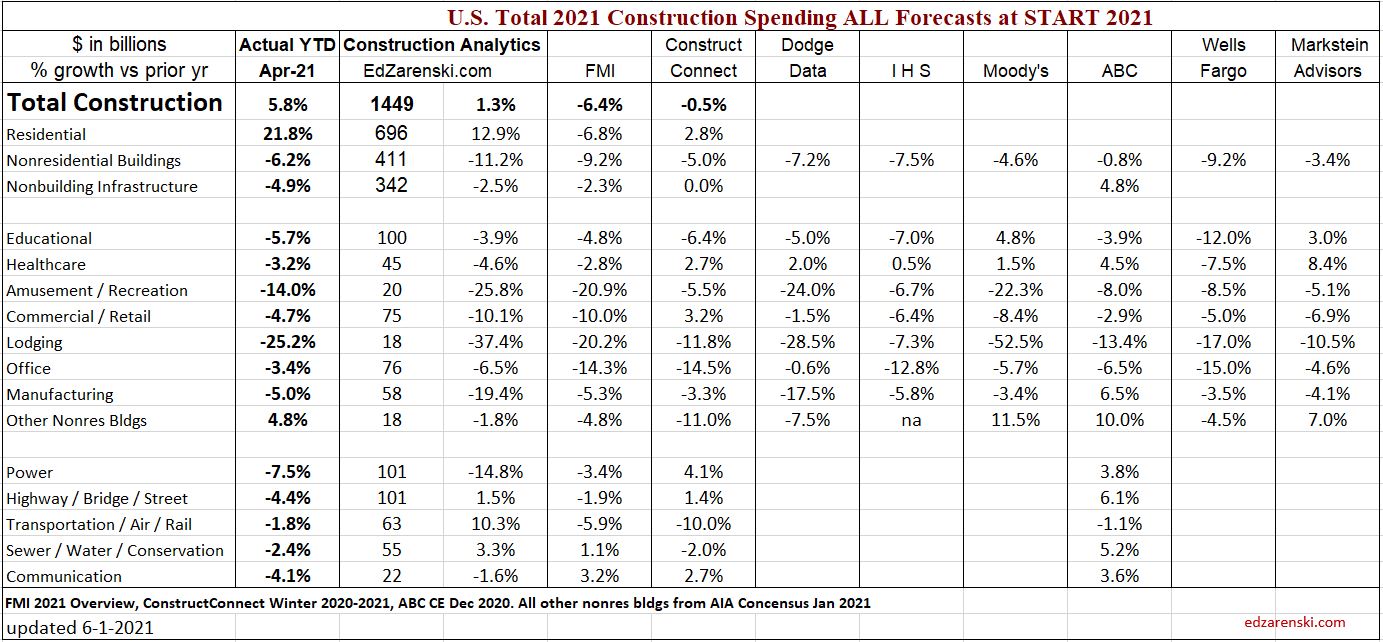
This table shows the ytd 2021 compared to the initial forecasts by Construction Analytics and eight other firms. The ytd and the forecast for the remainder of 2021 (table above) provide insight into expected final 2021 performance. Up above I’ve compared ytd to my current forecast. Here, ytd$ is compared to all the initial forecasts for 2021.
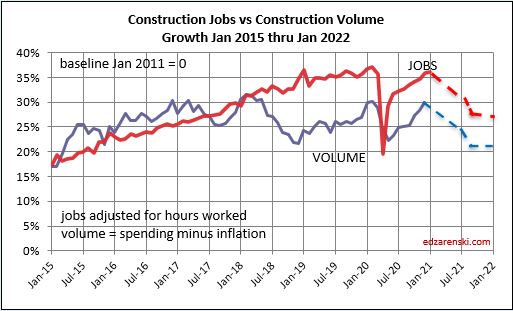
6-4-21 Construction jobs report released. Down 20,000 jobs for May. Both March and April revised down slightly. Jobs have increased only 23,000 for the 1st 5 months of 2021. Construction is still down 225,000 from Q1 2020.
I’ve been calling for a slowdown or slight decline in jobs growth. Construction spending adjusted for inflation (constant $) is down 2% since Dec-Jan. The trend is down for the rest of the year.
Construction volume growth is falling due to huge volume of nonresidential starts (-22%) that disappeared in 2020. The affect of those lost starts, which would have had peak spending in mid-2021, is such that volume of work is declining throughout 2021.

Construction Inflation May 2021
SEE Construction Inflation 2021 – Q3 Updated 10-15-21
update 6-15-21 PPI for May
Post Great Recession, 2011-2020, average nonresidential buildings CONSTRUCTION INFLATION is 3.7%. Residential cost inflation averaged over 5% for the last 8 years.
The 30-year avg inflation rate (including recession) for Nonres Bldgs is 3.5% and for Residential it’s 3.4%.
The 30-year avg inflation rate (EXCLUDING recession years) for Nonres Bldgs is 4% and for Residential it’s 4.75%.
I expect non-residential buildings construction inflation in 2021 to range between 3.2% to 3.5%, with potential to be held lower. Expect residential inflation of 7% to 8% with potential to push slightly higher.
As of March 2021, PPI for materials inputs to construction is up 12% to 14% yoy, measured to last March before the bottom dropped out. The PPI Buildings Cost Index for final cost to owner is up only 2%.
Almost every construction market has a weaker spending outlook in 2021 than in 2020. Approx. 50% of nonres spending in 2021 is generated from 2020 starts.
- Nonres Bldgs starts fell 22% in 2020.
- Nonbuilding starts were down 15%.
- Residential starts were up 6%.
While there are several reasons that construction inflation will increase, downward pressure on spending will temper construction inflation.
as of 6-15-21, May PPI report > Inputs to Nonres Constr YTD21 +13.3%. Final Demand Nonres Constr YTD21 +2.7%. Five solid months of 2021 data shows the Input costs of materials IS NOT being passed along to final cost to owner. This could change, but for now final costs of construction are holding well below input costs.

A look back at Res, Nonres and Nonbldg construction inflation over the last 30 years shows rarely has there been any substantial increase in inflation when construction spending is headed down.
- Nonres Bldgs spending 2020 -2.0%, 2021 -7.7%, 2022 -4.5%
- Nonbuilding spending 2020 +2.8%, 2021 -1.3%, 2022 -3.2%
- Residential spending 2020 +12.2%, 2021 +17%, 2022 +4.8%
Over 30 years, looking at the 3 major sectors, Res, Nonres Bldgs and Nonbldg = 90 pcs of data. 27 out of 90 times spending decreased or stayed flat for the year. Only 3 out of those 27 times when spending was down/flat did inflation come in over 3%. Avg inflation for the 27 down/flat yrs is less than 1%. For those 27 times, only 3 times were PPI Inputs less than 2%.
An estimator must differentiate between “added quality” and inflation. Added components or increased level of finish are not inflation, but are picked up in the estimators increased unit costs. Inflation captures higher labor, mtrl, margin costs for same level of build out.
Granite counters and Italian tile floors vs PLam counters and vinyl floor coverings is an increase in quality, not inflation. Increased SqFt is an increase in quantity, not inflation.
7-21-21 June PPI data will probably drive up inflation cost in this report. SEE PPI as of June-July 2021
The report attached below, written in May, suggests inflation that has been changing rapidly. Please read the most recent posts on inflation and the PPI for materials and final costs for updated information.
Follow this link for Construction Spending 2021 Update 8-2-21
Follow this link for Construction Spending 2021 update 5-3-21
Follow this link for 2021 Construction Economic Forecast 2-2-21
Download the full Inflation Report here

Nonres Bldgs Recovery to Pre-Pandemic? When?
5-10-21
Economists should be talking about this. While residential starts and spending are at all-time highs, nonresidential buildings starts have been down for months and spending is still declining.
Since Apr 2020 and now through March 2021, Nonresidential Bldgs construction starts, for 12 months, have averaged down 25%+ compared to Q1 2020. Recent Q1 2021 is still down 22% from Q1 2020.
A full year of nonres bldgs starts generates over $400 billion in spending. With starts down 25% for the past 12 months, that’s a loss of over $100 billion in spending that would have occurred over the next 1 to 3 years.
Spending follows as starts move, only later, so spending will fall.
Actual nonresidential buildings construction spending has been down 10 of the last 12 months. Now in Mar 2021 it is at its low point, 9% lower than Q1 2020. The forecast for the remainder of 2021 is down near 1%/month.
A simple model built to show when starts have maximum impact on spending indicates by Dec 2020 Nonres Bldgs construction spending put-in-place would be 10% lower than Q1 2020. Spending was actually 9% below Q1 2020. So the model seems to be on track.
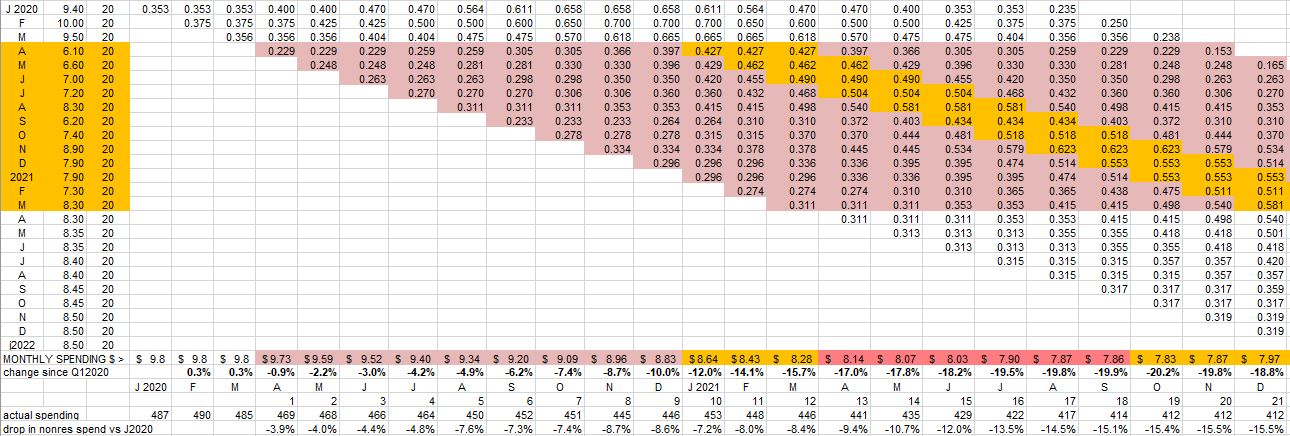
This table sets Feb 2020 starts to a baseline of 10.0. All other starts afterwards are entered at the percentage of actual $ starts that month compared to Feb 2020, so 8.30 in March of 2021 represents starts for Mar 2021 were 83% of Feb 2020. A lost start is negative spending. So, instead of thinking of the peak month of spending, that becomes the month of greatest loss. Those months near the middle of the schedule, are highlighted here.
Dodge is forecasting new construction starts for nonres bldgs will increase ~4% in 2021 and ~10% in 2022. That means starts in 2021 will still be 20% lower than Q1 2020 and starts in 2022 will still be 12% lower. This has major implications.
Even at 10%/yr growth in new starts in 2022, 2023 and 2024, Nonres Bldgs Starts would not return to pre-pandemic level until mid 2024. If starts remain lower than Feb 2020 through 2023, then spending will remain lower than Feb 2020 through 2024.
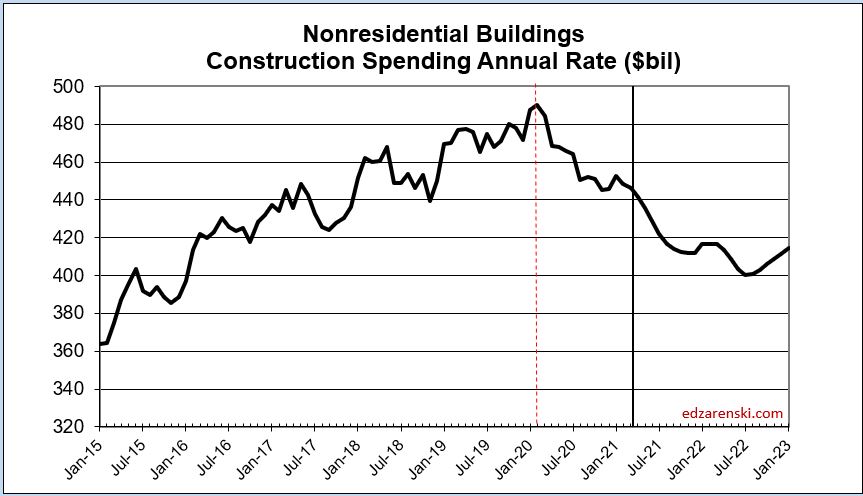
That model, that’s on track so far, shows maximum impact from reduced 2020 starts will occur in Q2-Q3 2021. But what about 2021 starts? Negative impact continues longer than the # of months starts remain lower than Q1 2020. We now have 12 months of starts still averaging 22% below Q1 2020, so even when we begin to improve, we are measuring from a new base 22% down. For each lower month the greatest negative impact in spending is 10-12 months later. That loss of spending is shown in the following chart for Nonres Bldgs Spending.
By the end of 2021, Nonres Bldgs construction spending put-in-place is forecast to be almost 20% lower than Q1 2020. If the Dodge forecast of 4% growth in starts for 2021 is correct, then, even though 2021 had growth, it’s off the bottom, and 21 months of starts will have averaged down 22% from Q1 2020.
Nonresidential Bldgs construction spending follows as starts go. If starts are down, future spending will be down.
Nonresidential Buildings spending $ put-in-place will not return to pre-pandemic levels before 2024 or 2025.
Construction Economics – An Eye on Forecasts
5-5-21
How can you tell if your preferred construction economic forecast is on track to finish the year as predicted?
For comparison, in the following link I’ve collected initial 2021 construction spending forecasts from nine different sources. Measuring Forecasting Methodology & Accuracy
As of 5-3-21, three months of actual data are in. The first step is to compare that current actual data to the predictions. The next step is to use a bit of math to answer the question, Can we get there from here?
Here’s examples:
First let’s look at Lodging. In the AIA initial 2021 Outlook, ABC forecast -13% and Moody’s forecast -52%. Current spending year to date through March is -25%. Are either of these forecasts achievable?
Lodging construction starts dropped 11% in 2019 and dropped another 50% in 2020. The seasonally adjusted annual rate (SAAR) of spending fell from $33bil in Q1 2020 to $24bil in Q1 2021, down 27%. The current rate of spending is coming in between 25%-30% below same month last year (yoy).
Now do the math.
Look at the ABC forecast for lodging. To finish the year down -13%, monthly spending needs to average -13% for all 12 months of 2021. 12 months x -13% = -157. But 3 months, down cumulatively 25%, are already known. 3 months x -25% = -75. What would need to occur for the last 9 months to reach a total 2021 spending down -13%?
12 x -13% = -157 minus 3 x -25% = -75, therefore -157 minus -75 = -82. In the remaining nine months, Lodging would need to fall a cumulative 82%, or 82/9 = an average of 9%/month.
Well, the current rate of spending is down 25% yoy and construction starts the previous two years are down 60%. Cash flows seem to indicate spending will not increase this year. There is little hope of seeing an increase in monthly spending in 2021. Since new starts are less than half of only two years ago, spending is unlikely to increase from a monthly rate down 25% to a monthly rate down only 9% for the next nine consecutive months. Therefore this forecast is unlikely to play out. The ABC forecast is too optimistic.
*********************************
Now let’s look at the Moody’s forecast for lodging. To finish the year down -52%, monthly spending needs to average -52% for all 12 months of 2021. 12 months x -52% = -624. But 3 months, down cumulatively 25%, are already known. 3 months x -25% = -75. What would need to occur for the last 9 months to reach a total 2021 spending down -52%?
12 x -52% = -624 minus 3 x -25% = -75, therefore -624 minus -75 = -549. In the remaining nine months, Lodging would need to fall a cumulative 549%, or 549/9 = an average of 61%/month.
Well, the current rate of spending is down 25% yoy and construction starts the previous two years are down 60%. Cash flows are indicating monthly spending will drop 3% to 4% per month this year. Spending would need to decline 61-25=36% in one month and stay at that rate for the remainder of the year, OR, spending would need to start falling at a rate of 12%/month and continue 12% lower every month for the remainder of the year. By December, spending would be down over 100%, so this is not even feasible. Therefore this forecast cannot play out. The Moody’s forecast is far too pesimistic.
*********************************
Second, let’s look at Manufacturing. In the AIA initial 2021 Outlook, ABC forecast +6.5% and Moody’s forecast -3.4%. Current spending year to date through March is -9%. Are either of these forecasts achievable?
Manufacturing construction starts dropped 10% in 2019 and dropped another 57% in 2020. The seasonally adjusted annual rate (SAAR) of spending fell from $78bil in Q1 2020 to $71bil in Q1 2021, down 10%. The current rate of spending is coming in between 7%-11% below same month last year (yoy).
*********************************
Look at the ABC forecast for manufacturing. To finish the year up +6.5%, monthly spending needs to average +6.5% for all 12 months of 2021. 12 months x +6.5% = +78. But 3 months, down cumulatively 9%, are already known. 3 months x -9% = -27. What would need to occur for the last 9 months to reach a total 2021 spending up+6.5%?
12 x +6.5% = +78 minus 3 x -9% = -27, therefore +78 minus -27 = +105. In the remaining nine months, Manufacturing would need to gain a cumulative 105%, or 105/9 = an average of +12%/month.
Well, the current rate of spending is down 9% yoy and construction starts the previous two years are down 67%. Cash flows seem to indicate spending will continue to drop at a rate of 2% to 3% per month this year. There is little hope of seeing an increase in monthly spending in 2021. Since new starts are down 67% from two years ago, spending is unlikely to increase from a monthly rate down 9% to a monthly rate up 12%, a swing of 21%, for the next nine consecutive months. Therefore this forecast is highly unlikely to play out. The ABC forecast is far to optimistic.
*********************************
Now let’s look at the Moody’s forecast for manufacturing. To finish the year down -3.4%, monthly spending needs to average -3.4% for all 12 months of 2021. 12 months x -3.4% = -41. But 3 months, down cumulatively 9%, are already known. 3 months x -9% = -27. What would need to occur for the last 9 months to reach a total 2021 spending down +3.4%?
12 x -3.4% = -41 minus 3 x -9% = -27, therefore -41 minus -27 = -14. In the remaining nine months, Manufacturing would need to fall a cumulative -14%, or -14/9 = an average of -1.5%/month.
Well, the current rate of spending is down 9% yoy and construction starts the previous two years are down 67%. Cash flows are indicating monthly spending will drop 2% to 3% per month, every month this year. Spending would need to begin falling at a rate of only -1.5%/month and continue -1.5% lower every month for the remainder of the year. A decline of 67% in starts over the previous two years solidifies a rate of decline beyond that at near 3%/month. This scenario would depend on cutting the rate of decline in half for the remainder of the year, but the lack of starts in previous years provides no help to achieve that goal. The Moody’s forecast is too optimistic.
*********************************
It’s in your best interest to know how to assess the plausibility of forecast components before you question an analysis that varies widely from your preferred forecast. It may be your preferred forecast that is way off.
ABI – DMI – CBI Leading Indicators
The American Institute of Architects Architectural Billings Index
The Dodge Momentum Index
The Associated Builders and Contractors Construction Backlog Indicator
These three construction leading indicators are often referenced. Do you reference any of these indices? Do you know what the index represents?
The American Institute of Architects Architectural Billings Index, ABI, is a diffusion index, measuring work on architectural firms’ drawing boards, measured as above 50 if increasing and below 50 if decreasing. The index is comprised of survey responses from firms representing 45% institutional work, 40% commercial work and 15% residential work. The index is said to lead commercial construction spending by 11 months and institutional construction spending by 7 months. BUT, the correlation is this, the ABI is compared to “the percent change in year over year construction spending”.
https://content.aia.org/sites/default/files/2016-04/Designing-Construction-Future_3-14.pdf
Year over year percent change can provide skewed results. If last year construction spending was on a slow decline every month, and this year spending is level from month to month, that would show up as a continually increasing year over year percent growth. Because year over year spending percent is increasing, it could be misinterpreted that current year spending is growing, but it is flat. In another example, if last year construction spending was slowly increasing every month, and this year spending is slowly increasing every month at the same rate of growth, that would show up as no growth in year over year spending, but actual month to month spending is slowly increasing. Year over year spending can be influenced by last year activity as much as current activity and may not show the current trajectory in spending.
The Dodge Momentum Index, DMI, measures the earliest known indication of projects in planning. This includes only projects that are actually in design. The index is comprised of gathered results for nonresidential projects, excluding megaprojects and excluding manufacturing. The index is said to lead nonresidential construction spending by 12 months. However, it’s individual components could lead Institutional spending by 15 months and Commercial spending by 7 months. We see that the ABI refers to the point in time when the project is already under design and that leads spending by 7 to 11 months. It would be expected that the Dodge index has a longer lead time. As an indicator of early planning Dodge excludes projects that are about to go out to bid, preserving the intent of a leading indicator.
https://www.construction.com/download/Dodge_Momentum_Index_WhitePaper.pdf
The Associated Builders and Contractors Construction Backlog Indicator, CBI, attempts to measure the work in backlog, or growth in the value of work on contractor’s books. It measures the current month of total remaining value of projects in backlog (nonresidential only) divided by the previous fiscal 12 months total revenues, times 12. The resulting output purports to measure months of remaining backlog or remaining revenues. Of course, projects have varied schedules to completion that may take many more months if not years to complete, so contractors may not run out of work in the few months indicated by the CBI. Therefore, this index does not measure months to backlog extinction, it simply sets the result to base 12. It could just as well be times 100 and set to base 100. This index also may be influenced by something that occurred a year ago that may not reflect the current activity. What this index really measures is the current backlog as a percentage of previous fiscal year revenues, just skip the part that multiplies that percent times 12. It provides no indication of expected annual revenues. The ABC CBI has always produced a result around 8 to 9 months, that would indicate backlog is about 65% to 75% of previous year revenues.
Construction Analytics collected starts and spending data back to 2005, which is sufficient in turn to provide an analysis of backlog since 2010. With exception of residential, which has short durations and for which backlog is always only about 30%-35% of previous year revenues, for all other work, never was backlog shown to be less than the previous year spending.
https://abc.org/Portals/1/CEU/ABC%20CBI%20and%20CCI%20Methodology.pdf
Construction Starts – A Leading Indicator to Spending
Construction starts, although a general indicator that construction spending may be poised to grow (or fall), can also be misinterpreted. Construction starts refers to a total project value at a point in time, the contract award or the start date. For nonresidential construction, all projects that started prior to the beginning of a year will account for at least 80% of all spending within that upcoming year. Construction spending is that total project value spread out over the project scheduled duration from start to finish. Building construction spending peaks at 50% to 60% into the schedule.
Construction starts may be increasing, but rather than resulting in increased monthly spending, those starts may represent longer duration contracts. Increases in new starts does not always indicate an increase of monthly spending, but may instead represent lower monthly spending for a longer duration into the future.
All of these indices do not correlate directly to construction spending. To forecast construction spending, a cash flow schedule of all construction starts must be prepared. In any given month, spending on construction includes some monthly portion of spending from all projects that started in all previous months but that have not yet reached completion. A cash flow schedule of all monthly construction starts is the best indicator that directly forecasts construction spending.
Construction Analytics prepares estimated cash flow schedules from monthly reports of new construction starts and exclusively uses cash flow to forecast future construction spending. The cash flow schedule also allows to directly calculate the estimate to complete backlog in current $.
Know what an index represents before you put all your faith in following that index to develop your forecast.
Projects On Hold vs Lost New Project Starts
Since the beginning of the Pandemic we’ve known there will be declines in construction spending due to #1: Projects halted and temporarily on hold, and #2: a huge reduction in the amount of new construction starts. That’s the easy part. The difficult part is calculating how much within the spending decline due to each cause is being counted in the most recent actual spending and the current forecast.
Although we may never know precisely, this is an attempt to identify how much of the declines in spending are due to #1 and #2. We can set up a model to calculate declines from lost new construction starts (#2), but no source is tracking the amount of projects put on hold (#1), for how long and how many of those projects become permanently shut down.
By comparing the amount of spending declines caused by lost starts to actual spending declines, we get a difference that could be identified in part as being caused by spending declines due to projects temporarily shut down. But that will have a distinct pattern to it. Initially we should see actual spending declines were greater than would have been caused by just the loss of starts, so the difference would be negative. Eventually, projects that were on hold start back up and we should see actual spending declines are not as great as the losses from new starts would indicate. This is caused by a revenue from a few months of previously on-hold projects extending the delayed spending to a later (current) point in time.
Finally, after all on-hold projects have restarted and been reabsorbed into monthly spending, the impact of delayed projects diminishes and the percent spending declines calculated by the loss of new construction starts should more closely reflect the actual declines in spending.
The following cash flow model may not be precise, but it is accurate in its representation of impact caused by lost new starts, and therefore allows to make the comparison noted above. This is strictly for nonresidential buildings.
HINT: Large view, Right Click on table – Open in a New Tab. Thank me later.

This cash flow schedule tracks reduced starts from 2019 through 2020. All other previous months are considered at 100% of the pre-pandemic high in Feb 2020. This sample uses $10bil/mo of new starts as 100%, the high in the 1st quarter, carried out over a 20mo schedule. If the rate of starts were to remain constant at $10bil/mo, then the spending would also remain constant at $10bil/mo. The amounts carried for all months 2019 and 2020 represent the percentage of actual starts recorded, measured as a percent of previous high, the 1st quarter 2020, so $6.6 bil in May is 66% of the pre-pandemic highpoint, February, which here is $10bil.
Notice although starts are forecast to increase about 5% each in 2021 and 2022, that percent growth is measured from the very low starts in 2020. Nonresidential Buildings starts in 2020 dropped 24%. We need 31% growth to get back to the Feb 2020 high. That will take several years.
With the onset of reduced starts in April 2020, spending began to fall, but only a few percent. The cumulative impact to spending of all reduced starts will be months later than the initial impact. Cash flow shows maximum impact is ~50% to 60% out in time of each individual schedule. The spending in any given month includes input from starts in 20 different months. It’s when a month lines up with all the inputs from reduced starts months that spending reaches its lowest.
In April 2020, we had loses from only one month of new starts which were down 39%. The cash flow schedule declines in the 1st month indicated that spending would drop 0.9% that month. The spending decreases from the next six months of losses in new construction starts indicated spending would drop approximately an additional 1% per month for six months; so down 1% after one month, down 2% after two months, 3% after 3 months, etc.
As expected, actual spending did not follow the pattern set forth by loss of new starts only. In the 1st month, spending actually dropped 3.9%, the difference that month being 3% between what was predicted from lost starts vs actual spending. Nonresidential Buildings Spending actually declined by approx. 4%/month for the 1st four months of the Pandemic, while the losses expected and identified from lost starts increased from 1% to 2%, 3% and 4%. With spending declining at a rate greater than loss of starts would indicate, we have some information to associate with the other cause of decline, delayed projects.
This greater negative performance eventually reached a balance point when actual losses equaled that predicted by lost starts. That would be expected if projects that were temporarily halted were restarted. And just beyond the balance point actual spending, in this case forecast spending, declines are not as great as would be predicted by lost starts. This would occur as the remaining schedule to finish halted projects added some spending to future months that was not in the expected cash flow schedule.
So, to recap, it’s easy to show the cash flow schedule predicting spending reductions caused by loss of starts in the schedule. Also, projects put on hold would show excess spending declines, not otherwise predictable, in the early months and would show unexpected spending increases later.
That’s exactly what the above model shows.
The subtotal line titled MONTHLY SPENDING of $ is construction spending per month, the sum of the contributions from the cash flow of all the still ongoing projects. That shows when greatest impact from lost starts occurs. The low point in spending can be measured in months from the initial event, April 2020. But the combined effect extends well beyond the initial event (reduced starts) which started in April but so far have lasted 10 months. This is why maximum impact of reduced spending for nonresidential buildings stretches over a long period in 2021-2022.
The bottom row shows the difference between Actual spending and predicted spending from starts. That difference behaves exactly as would be expected from projects that stopped spending and then resumed spending later.
The percent spending losses from on-hold projects amounted to no more than a 3%/month loss falling to a 1% loss in spending after six months. From month 10 through month 15, Jan 2021 to June 2021, spending increases 3%/month to 5%/month due to delayed projects resuming spending and completion later than originally scheduled.
So, why don’t we see spending increases from the completion of any delayed/resumed projects?
The spending increases due to resuming delayed projects is far less than the reduction in spending from loss of starts in 2020. By the 10 month, Jan 2021, spending declines attributed to lost starts in 2020 measured 11% decline compared to Feb 2020. By the 15th month, Jun 2021, spending will be down 17% due to lost starts. Delays were never down/up more than 3%/5% in a month.
The magnitude of spending declines from loss of starts in 2020 is three to four times the magnitude of losses, then gains, due to shifting of spending due to delays. The maximum (diminishing) negative impact of delays lasted six or seven months and fell from 3% to 0%. The positive (resumed spending) impact also last for six or seven months. The impact from lost starts reaches a maximum at a point approximately 10 to 12 months (to project scheduled midpoint) after the start. As long as starts are down from Feb 2020, the deepest impact will be 10 to 12 months beyond the last month of reduced starts. Starts in Dec and Jan are still down 20% from Feb 2020. Lower new starts in 2020 cause severe negative impact to spending in 2021 that may reach a maximum impact from May to Dec 2021. For each month that starts continue to come in substantially lower than Feb 2020, that will extend the end of maximum negative impact a month beyond Dec 2021.

Declining spending does not support jobs growth.
See Also Behind the Headlines – Construction Jobs in 2021

Behind the Headlines – Construction Jobs in 2021
3-6-21
Don’t be fooled by the upturn in January nonresidential buildings construction spending.
The greatest negative impact created by the loss of nonresidential buildings new starts from Apr 2020 to Oct 2020 has not yet hit spending and jobs in this sector. Expect both spending and jobs to decline steadily throughout 2021. My current forecast shows monthly spending down on average 1%/month for 9 out of the remaining 11 months in 2021. Dec 2021 SAAR (seasonally adjusted annual rate) will be 10% below Dec 2020, 18% below Q1 2020.
Do not expect any jobs growth in construction in 2021.
We all know a project takes time to build. It starts out slow, ramps up to peak spending and staffing just after the midpoint of the schedule and tapers off to completion. Peak monthly spending on a project with a 20-month schedule occurs 10 to 12 months into the schedule.
If we record a month of new starts 20% above normal, then 10 to 12 months from now spending and jobs from projects that started in that month will be 20% higher than normal. Then it stands to reason, if we record a month of new starts that is 20% BELOW normal, then 10 to 12 months from now spending and jobs from that month will be 20% lower than normal.
The greatest impact on spending, either up or down, from changes in new construction starts, occurs at the point in time when those projects would have reached peak spending, near the project midpoint.
In April 2020, new starts for nonresidential buildings fell 40% and then averaged 30% below normal for the next 6 months. If average duration of nonresidential buildings projects is about 20 months, then the loss of new starts will result in a maximum decline in spending and jobs 10 to 12 months later. (If average duration is about 24 months, then the loss of new starts will result in a maximum decline in spending and jobs 12 to 14 months later. This analysis uses 20 months).
Declines in new starts after April 2020 were large through the entire year, but during the months April through October 2020, starts averaged down 30%. Therefore, the maximum declines in spending and jobs from this period of reduced starts will occur 10 to 12 months later, from the beginning of the period to the end, from February through August 2021. Nonresidential buildings new starts in November, December 2020 and January 2021 are still down 20% from the pre-pandemic 6mo avg. high. This means spending declines will continue past August 2021, but at a slower rate of decline.
In Q1 2020, nonresidential buildings construction spending SAAR (seasonally adjusted annual rate) was $485 billion/yr. In April and May it had only dropped 3.5%. In Dec 2020 nonresidential buildings spending was $440 bil., down 10% from Q1. By May 2021, nonresidential buildings spending will only be $420 bil. By September 2021, the rate will be down to $400 billion.
Nonresidential buildings construction spending forecast in 2021 is down 11% from 2020. Spending continues to decline 6% in 2022. Inflation makes all these numbers slightly worse. If spending is down 11% at a time when inflation is up 3%, then real volume of work is down 14%. Jobs should follow in step with volume.
Nonresidential buildings spending especially will remain below the previous high at least for the next three years, probably longer. New starts in 2021 would need to ramp up by more than 40% to push 2021 spending back up to previous levels. New starts are forecast to gain only 3% to 5% for the next two years.
Nonresidential buildings (and to a lesser extent Nonbuilding Heavy Engineering) spending and jobs losses for the next year will be much greater than the gains expected due to increases in residential spending. New construction starts in 2020 for all types of nonresidential work declined by what is adjusted to a $150 billion decrease in spending. Residential increased by $35 billion. But again, the spending from those starts is spread out over time.
Nonresidential buildings volume declines of 14% project to a loss of over 400,000 jobs in 2021 and Non-building Infrastructure is projected to drop 60,000 jobs, but Residential could experience growth next year of 250,000 jobs. That could result in net annual jobs losses of 200,000. Job losses continue into 2022 with net volume declines of 4%.
Here is a sample cash flow schedule that shows when spending is impacted by changes in new starts in 2020.
Click on chart to see larger. Use back arrow to return to this article.
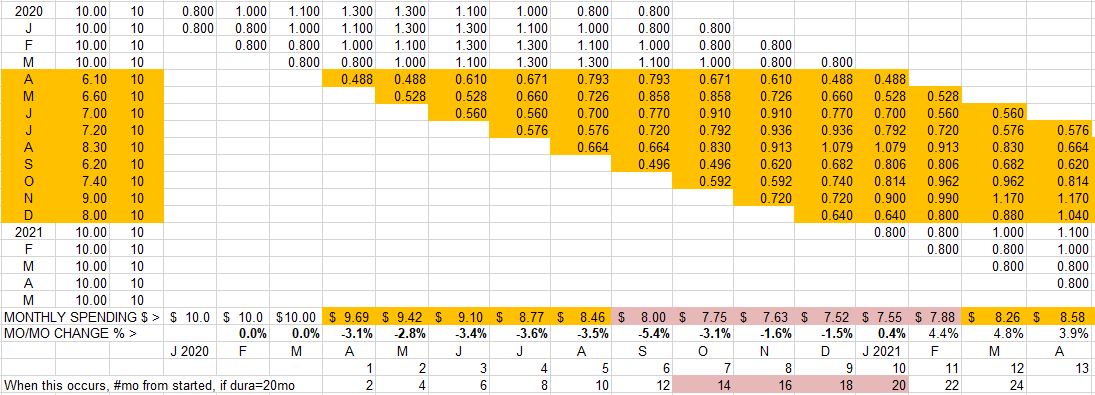
This cash flow schedule is based on reduced starts in Apr-Dec 2020. All other months are considered at 100% of the pre-pandemic rate. This sample uses $10bil/mo of new starts as 100%, the high in the 1st quarter, carried out over a 10mo schedule. If the rate of starts were to remain constant at $10bil/mo, then the spending would also remain constant at $10bil/mo. The amounts carried for April to Dec represent the actual starts recorded, measured as a percent of previous high, the 1st quarter 2020, so $6.6 bil in May is 66% of the pre-pandemic highpoint average, which here is $10bil.
With the onset of reduced starts in April 2020, spending began to fall, but only a few percent. The cumulative impact to spending of all reduced starts will be months later than the initial impact. Cash flow shows maximum impact is ~50% to 60% out in time of each individual schedule. The spending in any given month includes input from starts in 10 different months. It’s when a month lines up with all the inputs from reduced starts months that spending reaches its lowest.
The bottom line of $ is construction spending per month, the sum of the contributions from the cash flow of all the still ongoing projects. That shows when greatest impact occurs. The low point in spending can be measured in months from the initial event, April 2020. But the combined effect extends well beyond the initial event (reduced starts) which started in April but lasted until December. This is why maximum impact of reduced spending for nonresidential buildings stretches over a long period in 2021-2022.
Assuming an average duration for a particular nonresidential buildings market sector is 20 months to build, deepest losses will occur 60%x20mo or 12 months later, Apr2021, and continue to Dec2021. This duration certainly varies by building type and could vary from as short as 12 months to as long as several years. Maximum impact is always 50%-60% into the duration.
Declining spending does not support jobs growth.
Measuring Forecasting Methodology & Accuracy
7-1-21 Updated to 2020 actual spending revisions issued 7-1-21. Also updated initial 2021 forecasts to include May 2021 year-to-date actual spending.
1-30-21 How can we tell if the adjusted starts forecasting method produces reliable results?
This plot of predicted spending from the starts cash flow model compared to actual spending is a check on this analytical modeling method. It shows a comparison of the cash flows predicted from all construction starts vs actual spending. If the forecast plot is accurate, then actual spending should move in the same direction, at the same slope. While we sometimes see lag in the plots movement, over time, the cash flow model of new starts does a good job of predicting where spending is headed.
The Dec 2020 chart below incorporates changes to residential (only residential has been modified) from earlier 2020 forecasts: no delayed projects canceled; all delayed spending restarted by August; new construction starts beginning in August, for the final 5 months of 2020, fastest growth in 15 years. This shows the latest starts data as adding to the recovery forecast between May and December and moving the future forecast residential spending line up on the index.

Settings in the pandemic forecast model resulted in the residential divergence. First, projects delayed were predicted to take six to eight months to come fully back up to production. But residential project spending was fully back to prior levels by August, within 3 months from the May bottom. About 60% of the return to prior spending was supported by growth in residential renovations. The rapid growth in spending is represented by the steep recovery in the spending curve between May and August. Second, a small portion of jobs delayed were predicted to be canceled permanently. Based on the spending data, this likely did not occur at all, or the impact was very small. Finally, Dodge at that time was forecasting that residential new starts in 2020 would finish the year down slightly. With December starts data now in, residential starts for 2020 finished up 4%. In fact, over the final 5 months of 2020, new residential construction starts posted 4 of the 5 highest monthly totals since 2004-2006. Residential new starts finished 2020 at a 15-year high, with almost 50% of new activity for the year posting in the final 5 months, which will put a lot of that spending into 2021.
Here’s the most recent forecast with 2020 revisions updated 7-1-21

The nonresidential buildings plots (and the residential plot prior to 2020) are remarkably close, providing an indication the method of analysis employed, cash flow of all construction starts to get spending forecast, is reasonably accurate. Below is the nonresidential plot to a larger scale.

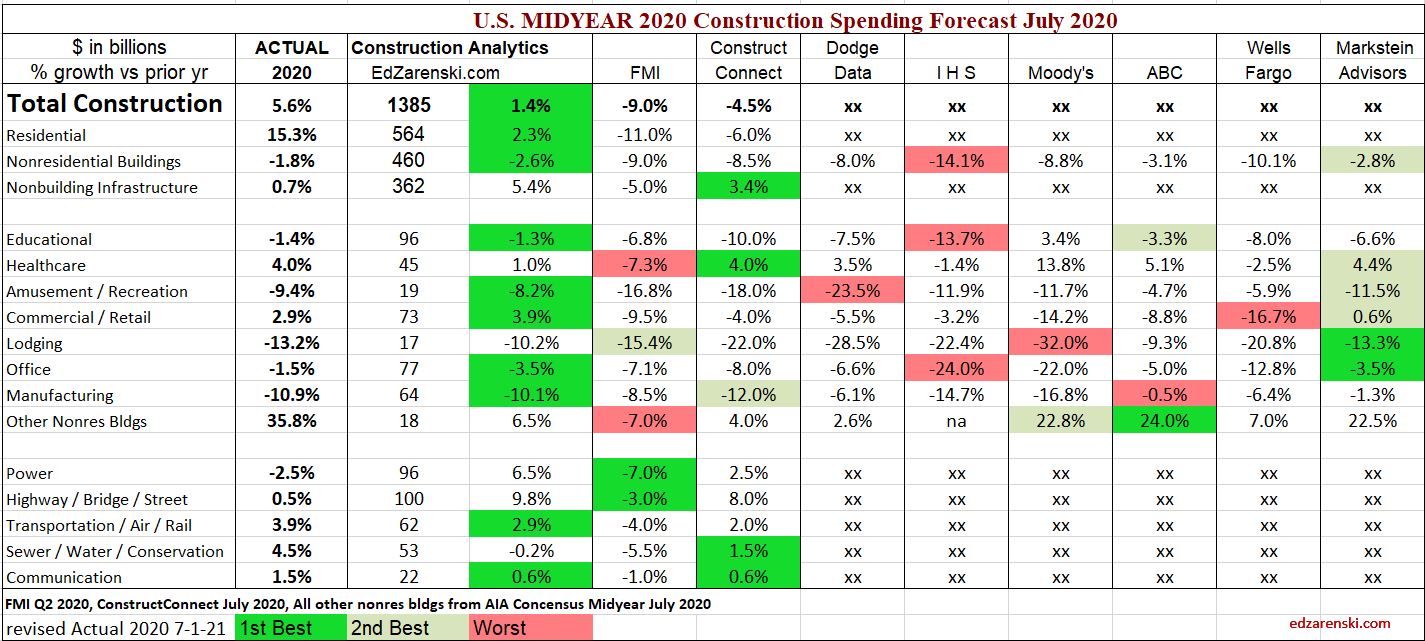
The table below shows the 2020 forecasts published at midyear by numerous analysts, the first opportunity to incorporate impacts from the pandemic recession. This table compares Construction Analytics Midyear July 2020 forecast to eight firms that reported nonresidential forecasts in the AIA Midyear July Outlook. Two of those firms, FMI and ConstructConnect, also published full forecast reports at midyear. The Actual totals for 2020 based on data through December (2020 data revised 7-1-21), are shown in the first column. Forecasts, all compared to Actual 2020, are marked best, 2nd best, worst. Where there’s limited comparison (Total, Residential and Non-building), only the closest is marked.
Construction Analytics midyear 2020 forecast garnered more best estimates than any other firm when comparing Midyear estimates to actual totals for the year. No one got residential correct, some reasons cited above, but Construction Analytics was the closest. I think it’s fair to say, Construction Analytics Midyear 2020 forecast was closest to 2020 Total Actual overall. Though, I do remember some other times with red in my column. Markstein Advisors had a close 2nd best nonres bldgs midyear 2020 forecast.
7-1-21 Actual YTD 2020 updated to include 2020 revisions for final comparison.
This next table shows the current forecast for full year 2021 forecast published as of January 2021. Of the eight nonresidential markets in the AIA Outlook report, the spread between hi and low forecast is 14%-17% for 4 markets, but 24%-25% for 3 markets and a spread of 45% for lodging. Spreads that wide are indicating some forecasts are all over the place. This will get compared next January when we know the Actual amounts for 2021. Watch closely nonresidential buildings.
Also, in July, along comes the Midyear Outlook, when usually forecasts improve a bit. That also will get compared next January.
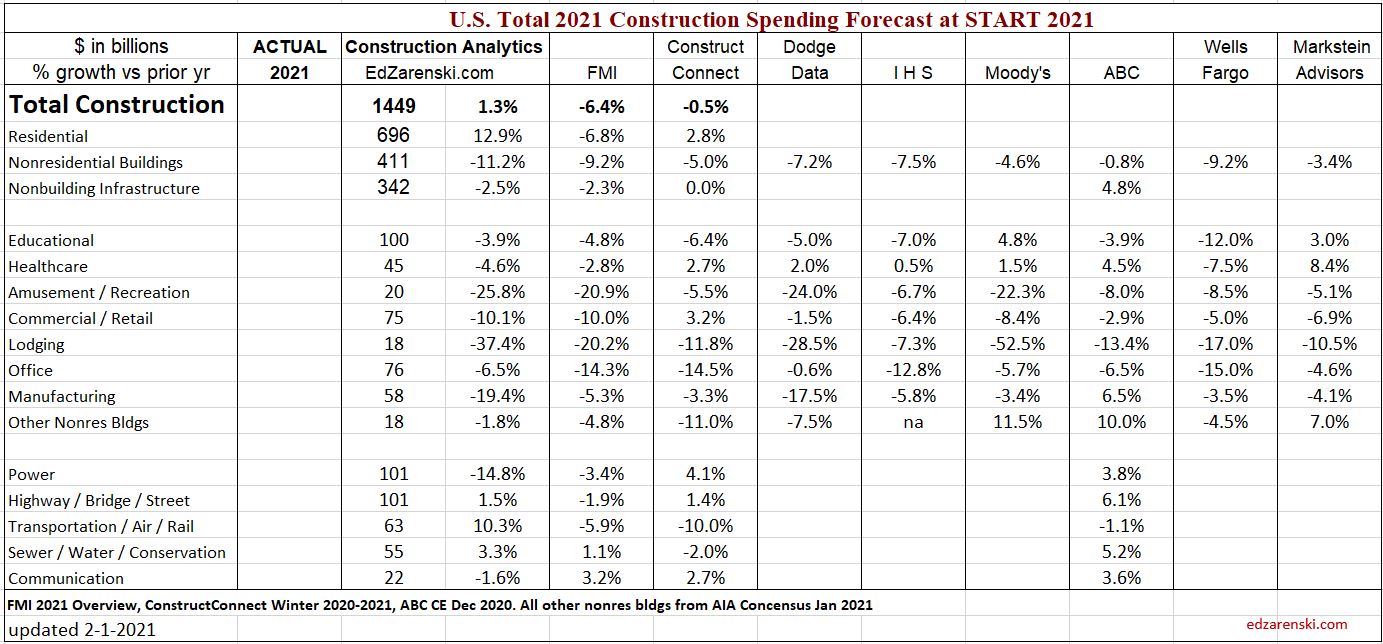
7-1-21 table below includes May ytd actual spending for latest comparison. Forecasts are all at start of 2021.

Construction Inflation 2021
This post, originally written in Jan 2021, and updated several times, is viewed over 1,000 times a week.
>>> 2-1-23 SEE Construction Inflation 2023
2-11-22 SEE Construction Inflation 2022
See Feb 2022 note below and updated table at bottom of file.
10-15-21 update – Link to PPI data from Jul to Sep. Table PPI Inputs Sep21. Updated BCI plot.
As of Sept 2021, PPI for materials inputs to construction is up ytd 15% to 18%. For the 18 months since March 2020, the onset of Pandemic, the PPI for materials inputs to construction is up ytd 23%, but the PPI Buildings Cost Index for final cost to owner is up only 5% to 6%. (Part of this can be attributed to periodic PPI forecast updates).
As of 10-15-21, nonres bldgs inflation for 2021 is estimated at 4.6% and residential at 12.9%. Those increases are reflected in the tables and plots below. Both have been trending up.
11-10-21 From Sept to Oct materials price changes were normal, but Final Demand prices jumped what could be considered an entire year’s worth of increase in just one month. We’ve been watching the price pass thru increase slowly, until now. This is the single largest monthly increase in Final Demand pricing since the indices were started in 2006.
As of 11-10-21, nonres bldgs inflation for 2021 is estimated at 6.8% and residential at 15%. The 2022 forecast is estimated at 4.5% for nonres bldgs inflation and 7% for residential.
As of Jan 2022, not all nonresidential sources have updated their Q4 inflation index. A few are still reporting only 4% inflation for 2021, but several have moved up dramatically, now reflecting between +10% to +14%. My estimate for 2021 inflation has been changing, moving up again. Nonres bldgs inflation for 2021 is currently estimated at 8.7% and residential at 15%. Graphs in this post are not yet updated. The 2015-2023 table of indices has been updated 1-20-22.
2-10-22 Here’s a list of 2021 indices average annual change and date updated.
- +8.4% Construction Analytics Nonres Bldgs Dec
- +14.1% PPI Average Final Demand 5 Nonres Bldgs Dec 2021
- +11.4% PPI average Final Demand 4 Nonres Trades Dec
- +1.9% Turner Index Nonres Bldgs annual avg 2021 Q4 2021
- +4.84% Rider Levett Bucknall Nonres Bldgs annual avg 2021 Q4
- +12.6% Mortenson Nonres Bldgs annual avg thru Q3 2021
- +11.7% U S Census New SF Home annual avg 2021 Dec
- +7.4% I H S Power Plants and Pipelines Index annual avg 2021 Dec
- +7.1% BurRec Roads and Bridges annual avg 2021 Q4
- +6.0% FHWA Fed Hiway annual avg 2021 Q4
- +9.11% R S Means Nonres Bldgs Inputs annual avg 2021 Q4 2021
- +10.0% ENR Nonres Bldgs Inputs annual avg 2021 Dec
- +7.2% Ready Mix Concrete Inputs Dec
- +16.4% Lumber/Plywood Inputs Dec
- +46% Fabricated Steel Inputs Dec
- +39% Sheet Metal Inputs Dec
- +21% Gypsum Products Inputs Dec
- +9.6% Flat Glass Inputs Dec
- +23% Copper Products Inputs Dec
- +55% Aluminum Products Inputs Dec
The 2022 forecast is estimated at 4.5% for nonres bldgs inflation and 7% for residential.
Construction Spending Update 10-1-21
Construction Jobs Outlook 10-11-21 read the section on impact of inflation
Inflation – PPI data June-Sept 2021 some materials up 20%-40% but final cost up only 5%-6%
8-15-21 update – These links at top here point to most recent inflation data, to supplement this post. The latest construction spending forecast reflects inflation of 4-6% for nonresidential and 12-13% for residential. The latest tables and BCI plot, as of 8-15-21, are at the very bottom in this file. All 2021 indices have increased since my May 2021 Inflation Report. These tables have the latest.
Also See Construction Inflation Report May 2021 for downloadable report
1-25-21 What impacts should we expect on Construction Inflation in 2021?
In April 2020, and again in June 2020, I recommended adding a minimum 1% to normal long-term construction inflation (nonres longterm inflation = 3.75%), to use 4% to 5% for 2020 nonresidential buildings construction inflation. Some analysts were suggesting we would experience deflation. Deflation is not likely. Only twice in 50 years have we experienced construction cost deflation, 2009 and 2010. That was at a time when business volume was down 33% and jobs were down 30%. In 2020, volume dropped 8% from Feb to May and we’ve gained half that back by Dec. Jobs dropped 14%, 1,000,000+ jobs, in two months! Now volume is still down 4% and jobs are down 2% from Feb peak. We’ve gained back 850,000 jobs. But also, we’ve gained back more jobs then volume. That adds to inflation.
Volume drops another 5% in 2021, all nonresidential, and then another 3% in 2022. Jobs could drop overall 8%-10% for all of 2021-2022, 500,000 to 700,000 jobs.
Even though material input costs are up for 2020, nonresidential inflation in 2020 remained low, probably influenced by a reduction in margins due to the decline in new construction starts (-24%), which is a decline in new work to bid on.
Volume = spending minus inflation.
Residential business volume dropped 12% from the January 2020 peak to the May bottom, but has since recovered 22% and now stands at a post Great Recession high, 10% above one year ago. Although residential spending remains near this high level for the next year, volume after inflation begins to drop by midyear. For the year 2020, Residential Building Materials Inputs are up 6.2%. See PPI charts. Sharply higher lumber prices have added more than $17,000 to the price of an average new single-family home since mid-April ($24,000 as of 3-30-21). Residential inflation averaged 5.1% for 2020. (UPDATE 3-30-21 – Single Family home prices increased 11% since March 2020. Lumber cost is now 3x what it was in March 2020. These will both impact cost to build SFH).
10-15-21 – The U.S. Census Single-Family house Construction Index increased 6.7% from Feb 2020 to Feb 2021. Since February 2021 through August it is up another 8.5% for the last 6 months. https://www.census.gov/construction/nrs/pdf/price_uc.pdf
Nonresidential volume has been slowly declining and is now down 8.5% from one year ago. I had forecast by 3rd quarter 2021, nonresidential buildings volume would be down 15% lower than December 2020, or 25% below the Feb 2020 peak. It’s down 5.5% from Dec’20 and down 23% from the Feb’20 peak. This tracks right in line with the 24% decline in new construction starts in 2020. Most of the spending from those lost starts would have taken place in 2021, now showing up as a major decline in spending and work volume. Nonresidential inflation for 2020 dropped to 2.5%, the first time in 7 years below 4%. It’s expected to increase in 2021.
The Producer Price Index tables published by AGC for year-end 2020 https://www.agc.org/sites/default/files/PPI%20Tables%20202012.pdf shows input costs to nonresidential buildings up about 3.5% to 4.5% for 2020, but final costs of contractors and buildings up only 1% to 2%. This could be an indication that, although input costs are up, final costs are depressed due to lower margins, a result of fewer projects to bid on creating a tighter new work available environment which generally leads to a more competitive bidding environment. This could reverse in 2021 as the volume of work to bid on in most markets begins to increase.
As of Sept 2021, PPI for materials inputs to construction is up ytd 15% to 18%. For the 18 months since March 2020, the onset of Pandemic, the PPI for materials inputs to construction is up ytd 23%, but the PPI Buildings Cost Index for final cost to owner is up only 5% to 6%. Construction inflation is very different right now for subcontractors vs general contractor/CM.
11-10-21 From Sept to Oct materials price changes were normal, but Final Demand prices jumped in just one month what could be considered an entire year’s worth of increase. We’ve been watching the price pass thru increase slowly, until now. This is the single largest monthly increase in Final Demand pricing that I can remember. In part, the disparity between these two indices is a data collection issue in how Census gets this information. The Oct increase in the Final Demand index represents several months of growth, all reported at once. Final demand indices are just catching up.
This October 2021 increase is not yet reflected in any other building cost inflation index.

PPI data for Jun – Oct Updated 11-10-21
The Turner Construction 2020 Cost Index for nonresidential buildings averaged 1.8% higher than the avg for all of 2019. The Turner index appears to show the lowest gains in forecasts for 2021, up only 1.4% ytd though Q2. http://turnerconstruction.com/cost-index
The Rider Levitt Bucknall nonresidential buildings average index for 2020 increased 3.5%. Q3 2021 compared to Q3 2020 is up 5.5%. https://www.rlb.com/americas/
R.S.Means quarterly cost index of some materials for the 4th quarter 2020 compared to Q1: Ready-Mix Concrete -1.8%, Brick +10%, Steel Items -1% to -5%, Framing Lumber +32%, Plywood +8%, Roof Membrane +5%, Insulating Glass +12%, Drywall +3%, Metal Studs +23%, Plumbing Pipe and Fixtures +1%, Sheet Metal +20%. https://www.rsmeans.com/landing-pages/2020-rsmeans-cost-index

U.S. manufacturing output posts largest drop since 1946. Think of all the manufactured products that go into construction of a new building: Cement, steel, doors, frames, windows, roofing, siding, wallboard, lighting, heating systems, wire, plumbing fixtures, pipe, valves, cabinets, appliances, etc. We have yet to see if any of these will be in short supply leading to delays in completing new or restarted work.
There have been reports that scrap steel shortages may result in a steel cost increase. Scrap steel prices are up 27% in the last quarter and up 40% for the year 2020. Scrap is the #1 ingredient for new structural steel. The U.S. steel industry experienced the most severe downturn since 2008, as steelmakers cut back production to match a sharp collapse in demand and shed workers. Capacity Utilization dropped from 82% in January 2020 to 56% in April. In mid-August, CapU was up to 61%, still very low. As of January 23, 2021 CapU is up to 76%, well above April’s 56% but still below desired level. Steel manufacturing output is still down compared to pre-covid levels. Until production ramps back up to previous levels there may be shortages or longer lead times for delivery of steel products. In August 2021, CapU is back to 85%.
Steel Prices at mill in the U.S. are up 60% to 100% in the last 6 months. All prices are 50% to 75% higher than Feb 2020. http://steelbenchmarker.com/files/history.pdf . This is mill price of steel which is about 25% of the price of steel installed. What affect might a steel cost increase have on a building project? It will affect the cost of structural shapes, steel joists, reinforcing steel, metal deck, stairs and rails, metal panels, metal ceilings, wall studs, door frames, canopies, steel duct, steel pipe and conduit, pumps, cabinets and furniture, and I’m sure more. Assuming a typical structural steel building with some metal panel exterior, steel pan stairs, metal deck floors, steel doors and frames and steel studs in walls, then all steel material installed represents about 14% to 16% of total building cost. Structural Steel only, installed, is about 9% to 10% of total building cost, but applies to only 60% market share being steel buildings. The other 6% of total steel cost applies to all buildings. https://www.thefabricator.com/thefabricator/blog/metalsmaterials/steel-prices-reach-levels-not-seen-since-2008 At these prices, if fully passed down to the owner, this adds about 1.5%-2% to building cost inflation. With demand in decline for nonresidential buildings, I would expect to see all these steel price increases recede. Also, take note, as of January 2021, none of this steel price movement appears captured in the PPI data or RSMeans data.
Contractors have been saying they have difficulty acquiring the skilled labor they need. This has led to increased labor cost to secure needed skills. I expect the decline in nonresidential work volume in 2021 to result in as much as a decline of 250,000 nonresidential jobs in 2021. This results in labor available to fill other positions.
This SMACNA report quantifies that labor productivity has decreased 18% to meet COVID-19 protocols. https://www.constructiondive.com/news/study-finds-covid-19-protocols-led-to-a-7-loss-on-construction-projects/583143/ Labor is about 35% of project cost. Therefore, just this productivity loss would equate to -18% x 35% = 6.3% inflation. Even if, for all trades, the average lost time due to COVID-19 protocols is only half that, the added inflationary cost to projects is 3% above normal. But that may not remain constant over the entire duration of the project, so the net effect on project cost would be less.
Post Great Recession, 2011-2020, average nonresidential buildings inflation is 3.7%. In 2020 it dropped to 2.5%, but for the six years 2014-2019 it averaged 4.4%. Residential cost inflation for 2020 reached 5.1%. It has averaged over 5% for the last 8 years. The 30-year average inflation rate for nonresidential buildings is 3.75% and for residential it’s over 4%.
This survey of members by AGC https://www.agc.org/sites/default/files/2021_Outlook_National_1221_.pdf just published provides some insight into construction firms outlook for 2021.
Almost every construction market has a weaker spending outlook in 2021 than in 2020, because approximately 50% of spending in 2021 is generated from 2020 starts, and 2020 nonresidential starts are down 10% to 25%, several markets down 40%. Nonbuilding starts are down 15%, but will increase 10% in 2021.
Typically, when work volume decreases, the bidding environment gets more competitive. We can always expect some margin decline when there are fewer nonresidential projects to bid on, which typically results in sharper pencils. However, if materials shortages develop or productivity declines, that could cause inflation to increase. We can also expect cost increases due to material prices, labor cost, lost productivity, project time extensions or potential overtime to meet a fixed end-date.
Constant $ plot updated 10-14-21
Constant $ = Spending minus inflation = Volume

Many projects under construction had been halted for some period of time and many experienced at least short-term disruption. The delays may add either several weeks to perhaps a month or two to the overall schedule, in which case, not only does labor cost go up but also management cost goes up, or it could add overtime costs to meet a fixed end-date. Some of these project costs have yet to occur as most would be expected to add onto the end of the project.
Some projects that were put on hold (nonresidential buildings starts in 2020 dropped 24%) just prior to bidding in 2020 may now re-enter the bidding environment. The rate at which these projects come back on-line could impact the bidding environment. If several months worth of projects that delayed bidding last year all come onto the market at once, or at least all in a more compressed time span than they would have, the market could be flooded with work and bidding contractors now have more choice, can bid more projects than normal and could potentially raise margins in some bids. This would have an inflationary effect. Also, there can be difficulty in starting many projects at the same time, rather than more staggered starts. It burdens subcontractors and suppliers with too much of the same type of work all going on at the same time. This could exacerbate labor issues and could lead to project time extensions.
The hidden inflationary costs of bidding environment, project time extensions, potential overtime and lost productivity haven’t all yet appeared in the data. Some of these could still add to 2020 inflation. Also, the huge loss of new starts in 2020, which meant fewer projects to bid on in 2020, probably reduced margins in 2020. Nonresidential starts are projected to increase 4% in 2021, so that could lead to some recovery of margins, however, even with 4% growth in new starts, that comes after a 24% drop in 2020, so remains still 20% below 2019. Total volume of work is declining and new projects available out to bid is still depressed, so pressure on margins still exists.
update 4-15-21 Although materials cost inflation will be higher, I expect non-residential buildings inflation final cost in 2021 to range between 3.5% to 4.0%, with potential to be held lower. Subcontractor costs, such as for steel or lumber, could range much higher due to huge material cost increases. All the downward pressure on nonresidential inflation is on margins. There is currently 20% less nonres bldgs work to bid on than in Q1 2020.
updated 3-30-21 Expect 2021 residential inflation of 6% to 8% with potential to push slightly higher.
See Construction Inflation Index Tables for indices related to Nonbuilding Infrastructure work and for more links to sources.
(10-15-21 The tables and plot below include updated residential costs and updated nonresidential inputs).

The tables below, from 2011 to 2020 and from 2015 thru 2023, updates 2020 data and includes Q3 PPI data thru Sept and provides 2021-2023 forecast. The three sectors, highlighted, are plotted above.
NOTE, these tables are based on 2019=100.

The following table shows 2021 updated as of 10-15-21 reflecting 4.6% inflation for nonresidential buildings and 13% for residential.
As of 10-14-21, nonres bldgs inflation is estimated at 4.6% and residential at 12.9%. Those increases since August are reflected in these tables.
11-10-21 From Sept to Oct materials price changes were normal, but Final Demand prices jumped what could be considered an entire year’s worth of increase in just one month. We’ve been watching the price pass thru increase slowly, until now. This is the single largest monthly increase in Final Demand pricing that I can remember. Prior to this I expected future cost increases to add on slowly. This changes the entire outlook.
11-10-21 Construction Analytics and PPI Data have been updated for 2021, 2022 and 2023. Other firms forecasts will be updated when they post, so there may be differences. For example CA 2021 index for nonres bldgs now reflects a +6.5% annual increase. Turner Q3 2021 is still indicating just +3%.
11-10-21 Nonres bldgs inflation for 2021 is estimated at 6.8% and residential at 15%. The 2022 forecast is estimated at 4.5% for nonres bldgs inflation and 7% for residential. Increases to CA and PPI since Sept are reflected in this table.
As of Jan 2022, not all nonresidential sources have updated their Q4 inflation index. A few are still reporting only 4% inflation for 2021, but several have moved up dramatically, now reflecting between +10% to +14%. My estimate for 2021 inflation has been changing, moving up again. Nonres bldgs inflation for 2021 is currently estimated at 8.7% and residential at 15%. Graphs in this post are not yet updated. The 2022 forecast is estimated at 4.5% for nonres bldgs inflation and 7% for residential.
The 2015-2023 table of indices has been updated 2-10-22. However, there is still some potential for 2021 data to move higher.

How to use an index: Indexes are used to adjust costs over time for the affects of inflation. To move cost from some point in time to some other point in time, divide Index for year you want to move to by Index for year you want to move cost from. Example : What is cost inflation for a building with a midpoint in 2021, for a similar nonresidential building whose midpoint of construction was 2016? Divide Index for 2021 by index for 2016 = 108.2/87.0 = 1.24. Cost of building with midpoint in 2016 x 1.24 = cost of same building with midpoint in 2021. Costs should be moved from/to midpoint of construction. Indices posted here are at middle of year and can be interpolated between to get any other point in time.
All forward forecast values, whenever not available, are estimated by Construction Analytics.
Also See Construction Inflation Report May 2021
Also See Construction Inflation Index Tables the post for links to dozens of other indices
Construction Jobs in 2020 down 220,000
edited 3-5-21 to include 2020 revised jobs and 2021 revised outlook.
Construction closes 2020 down 157,000 jobs comparing Dec 2020 to Dec 2019. Average jobs lost over the year is down 220,000, down 2.9%. Also, average hours worked in 2020 is down. The equivalent jobs lost over the year (jobs x hours worked) is down 3.8% or a loss of 281,000 jobs equivalent.
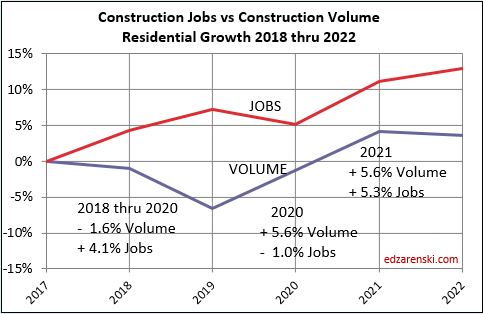
While construction spending in 2021 is forecast up 1.3%, after inflation construction volume is expected to decline 2.5%. Residential construction spending is forecast up 13%, volume up almost 9%, but 2021 nonresidential buildings spending is forecast down -11% leading to a decline in volume after inflation of -14%. Nonbuilding Infrastructure spending in 2021 declines -2.5%, volume drops -6%.
Nonresidential buildings volume declines of 14% project to a loss of over 400,000 jobs next year and non-building infrastructure is projected to drop 60,000 jobs, but Residential could experience growth next year of 250,000 jobs. That could net annual average jobs losses to -200,000. Job losses continue into 2022 with net volume declines of 4%.
It is notable though, even with residential spending and volume increasing, due to large losses in nonresidential buildings, total construction volume declines every month for the next 9 months. Nonresidential buildings volume declines for the next 18 consecutive months.
There is an unusual occurrence in the data for 2021. Annual average jobs in 2021 may decline in total by only 100,000, but from Dec. 2020 to Dec. 2021, jobs decline may be nearer to 400,000. The annual average change is much less due to the massive decline in jobs in April 2020, which by itself caused the 2020 average to drop by almost 100,000. Most months in 2021 will show jobs about 3% to 4% or more below the same month in 2020, except for April, which will show 2021 jobs 10% higher than 2020.
Some who read this post will question how I forecast such a drop in nonresidential work, when some other analysts predict far less declines and even some who predict nonresidential work increases in 2021. It will be very difficult for anyone to support a forecast for increased spending in 2021 given a 22% drop in new construction starts in 2020 for nonresidential buildings work, most of which would have occurred in 2021.
https://www.bls.gov/web/empsit/ceseeb1a.htm