Initial Construction Outlook 2021, 2-5-21, based on data from:
- Actual Jobs data includes BLS Jobs to Jan 16th, issued 2-5-21
- Forecast includes US Census Dec 2020 year-to-date total spending as of 2-1-21
- Forecast includes Dodge Outlook 2021 and Dec construction starts 1-19-21
This analysis utilizes Dodge Data & Analytics construction starts data to generate spending cash flow to then determine how spending may affect future construction activity.
When spending increases less than the rate of inflation, real work volume is declining. In 2020, nonresidential buildings spending is down -2%, but with 3% inflation, volume declined 5%. The extent of volume declines negatively impacts the jobs situation. A 5% decline in Nonresidential Buildings volume impacts $22 billion worth of work and more than 100,000 jobs. In 2021, spending is forecast down 11%, volume down 14%.
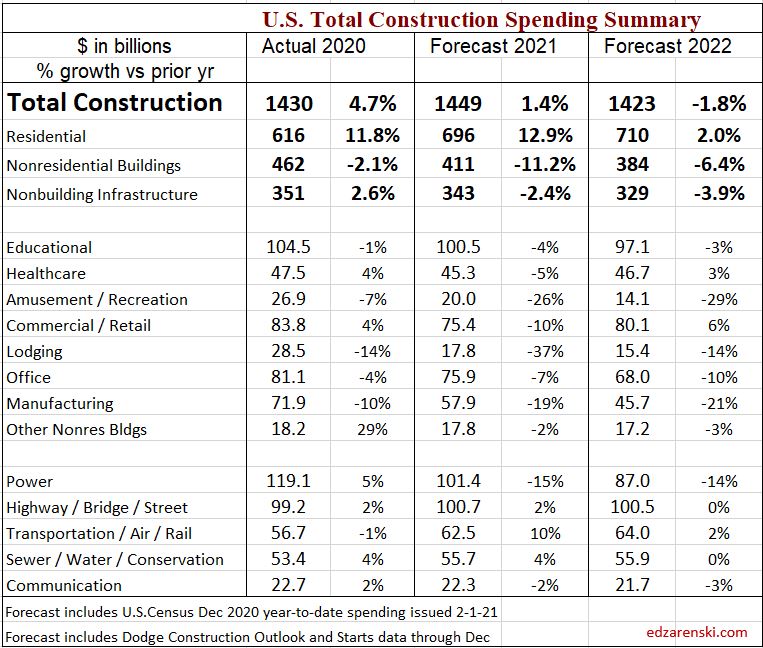
2021 Residential spending will climb about 13%, up $80 billion to $695 billion. Nonresidential Buildings spending is forecast to drop -11% to $410 billion, a decline of $50 billion. Non-building spending drops -2% to $343 billion, a decline of only $8 billion.
By far the greatest impact of the pandemic on construction is the massive reduction in new nonresidential construction starts in 2020 that will reduce construction spending and jobs for at least the next two years. Although nonresidential buildings spending is down only -2% for 2020, the 15% to 25% drop in 2020 new construction starts will mostly be noticed in lower 2021 spending.
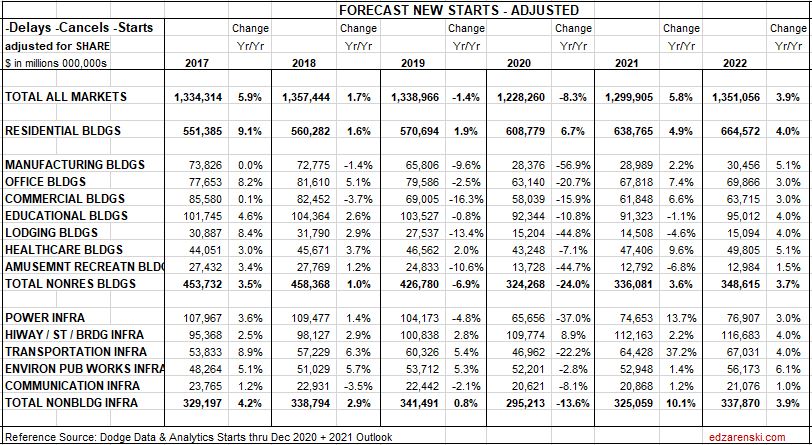
New Construction Starts
Total construction starts for 2020 ended down -8%, but Nonresidential Buildings starts finished down -24% and Non-building Infrastructure starts are down -14%.
Residential starts finished the year up +7% from 2019.
Most nonresidential buildings markets and residential new starts are forecast to increase 5% in 2021. Nonbuilding starts will increase 10% in 2021.
In the Great Recession, beginning in Q4 2008, nonresidential buildings new construction starts fell 5%, then fell 31% in 2009 and 4% in 2010. Spending began to drop by Dec 2008, then dropped steadily for the next 24 months. Spending dropped 40% over that next two years. During that period, residential starts and spending fell 70%.
In 2020, nonresidential buildings starts fell 24%, but the six months from Apr-Sep, starts fell 33%. Starts are forecast to fall 4% in 2021. Nonres Bldgs spending began to decline in Aug, is now down 10% from Feb high and is forecast to drop steadily the next 20 months, for a total decline of 25%. This time around residential starts and spending are increasing.
Over the final 5 months of 2020, new Residential construction starts posted 4 of the 5 highest monthly totals since 2004-2006. Residential new starts finished 2020 at a 15-year high, with almost 50% of new activity for the year posting in the final 5 months, which will put a lot of that spending into 2021. Total 2020 residential starts are up 7%, but the average for the last 5 months is up 10% from the same period 2019. There is a large portion of 2021 spending from that last 5 months of starts, that will be up 10%.
Nonresidential Buildings new construction starts in 2020 averaged down 24%: Manufacturing -57%, Lodging -46%, Amusement/Recreation -45%, Education -12%, Healthcare -7%. Most of the spending from those lost starts would have taken place in 2021, now showing up as a major decline in spending and work volume.
Manufacturing starts in 2020 fell 57%. Manufacturing projects can have a moderately long average duration, because some projects are 4-5 years. So, projects that fell out of the business plan starting gate in 2020 caused a drop in starting backlog of -32% for 2021 and -33% for 2022. It should not be hard to see how that leads to a huge decline in construction spending the next two years. The same thing happened with Amusement/Recreation and Lodging, although lodging tends to have shorter duration, so affects mostly 2021.
Commercial/Retail starts in 2020 dropped 16%. But this group includes warehouses which finished the year up +1% and warehouses is 60% of the total market. All other Commercial/Retail ended 2020 down 35%.
Non-building Infrastructure new construction starts in 2020 averaged down -13%. Power -37%, Transportation -22%. Highway (along with residential) was the only market to gain new starts in 2020, +8%.
Power new starts fell 37% in 2020, but Power backlog has not increased since 2018. Even though Power new starts in 2021 are forecast to increase 13%, that’s not enough to push spending to positive.
Transportation starts declined -22% in 2020. But Transportation backlog increased 50% over the last three years. There is a large volume of Transportation projects currently in backlog, and although backlog does drop slightly for 2021, spending is supported by the large volume of starting backlog and a forecast for increased new starts in 2021.
The following NEW STARTS table shows, for each market, the current forecast for new construction starts. With exception of residential, spending in all other markets, due to longer schedules, is most affected by a decline in new starts, not in the year of the start, but in years following. As we begin 2021, some effects of reduced starts have not even begun to show up in the data. A 24% decline in new nonresidential starts in 2020 results in a huge decline in spending and jobs in 2021-2022.
Almost every nonresidential construction market has a weaker spending outlook in 2021 than in 2020, because approximately 50% of spending in 2021 is generated from 2020 starts, and 2020 nonresidential starts are down 24%, with several markets down 40%. Starts lead to spending, but that spending is spread out over time. An average spending curve for nonresidential buildings is 20:50:30 over three years. Only about 20% of new starts gets spent in the year they started. 50% gets spent in the next year. The effect of new starts does not show up immediately. If new nonresidential buildings starts in 2020 are down 24%, the affect that has in 2020 is to reduce spending by -24% x 20% = – 4.8%. The affect it has in 2021 is -24% x 50% = -12%. In 2022-2023 the affect is -24% x 30% = -7.2%.

Starting Backlog
Starting backlog is the estimate to complete (in this analysis taken at Jan 1) for all projects currently under contract. The last time starting backlog decreased was 2011.
Backlog leading into 2020 was at all-time high, up 30% in the last 4 years. Prior to the pandemic, 2020 starting backlog was forecast UP +5.5%. Due to delays and cancelations, that has been reduced to +1.8%, still an all-time high. Starting Backlog, from 2011-2019, increased at an avg. rate of 7%/year.
If new construction starts are greater than construction spending in the year, then for the following year starting backlog increases. It’s when new starts don’t replenish the amount of spending in the year that backlog declines. And that is the case this year.
Total starting backlog is down -10% for 2021 and -5% for 2022. 2021 Starting Backlog is back to the level in 2018. In 2022, backlog drops to the level of 2017.
Nonresidential Buildings new starts declined by -24% in 2020 resulting in starting backlog drops -19% for 2021 and drops -9% for 2022.
For Non-building Infrastructure, a drop of -14% in 2020 starts results in a drop of 9% in 2021 starting backlog and -5% for 2022.
Residential starting backlog for 2021 is up +12%. New starts are up 6%.
2021 backlog declines in every nonresidential market, except Highway.
80% of all nonresidential spending in any given year is from backlog and could be supported by projects that started last year or 3 to 4 years ago. Residential spending is far more dependent on new starts than backlog. Only about 30% of residential spending comes from backlog and 70% from new starts.
Projects in starting backlog could have started last month or last year or several years ago. Many projects in backlog extend out several years in the schedule to support future spending. Current backlog could still contribute some spending for the next 6 years until all the projects in backlog are completed.
Reductions in starts and starting backlog lead to lower spending. Residential construction is going counter to the trend and will post positive results for new starts, backlog and spending for the next two years. Nonresidential buildings will experience the greatest reductions in new starts, backlog and spending through 2022.
Spending Forecast 2021
2021 Residential spending will climb about 13%, up $80 billion to $695 billion. Nonresidential Buildings spending is forecast to drop -11% to $410 billion, a decline of $50 billion. Non-building spending drops -2% to $343 billion, a decline of only $8 billion.
Most all the change in this forecast from previous is an increase to residential spending. Both recent starts and spending increased substantially since previous forecasts. When looking at Total Construction Spending for 2021, residential growth obscures the huge declines in nonresidential.
The monthly rate of spending for residential increased 33% in the 7 months from May to December. The last time we had growth like that was 1983. The last time we had rapid growth in residential work, 2013-2014 and 2004-2005, it took 2 years to increase 33%. Residential spending in Dec 2020 is 21% higher than Dec 2019.
Nonresidential Buildings spending drops -2% to -3% each quarter in 2021. Nonresidential Buildings spending as of Dec. 2020 is down 10% From Feb. 2020 and 8% from Q4 2019. By 3rd quarter 2021, nonresidential buildings spending is forecast down another 12% lower than Dec. 2020, or 20% below the Feb. 2020 peak. This tracks closely with the 24% decline in new construction starts in 2020.

Nonresidential Buildings construction will take several years to return to pre-pandemic levels. Although nonresidential buildings spending is down only -2% for 2020, the 15%-25% drop in 2020 construction starts will mostly be noticed in lower 2021 spending. Project starts that were canceled, dropping out of new backlog between April and September 2020, would have had midpoints, or peak spending, March to October 2021. Nonbuilding project midpoints could be even later. The impact of reduced new starts in 2020 is reduced spending and jobs in 2021 and 2022.
Almost every market has a weaker spending outlook in 2021 than in 2020, because of lower starts in 2020. Starts lead to spending, but on a curve. A good average for nonresidential buildings is 20:50:30 over three years. 20% of the total of all starts in 2020 gets spent in 2020 (yr1) and that represents also about 20% of all spending. 50% of the total value of 2020 starts gets spent in the following year, 2021. So, 50% of spending in 2021 is generated from 2020 starts. If starts are down 20% and 50% of spending comes from those starts, spending will be down 20% x 50% of the work.
For 2020, the biggest declines are Lodging (-14%), Manufacturing (-10%) and Amuse/Recreation (-7%). Commercial/Retail finishes up +4.2%, but this is entirely due to Warehouse, 60% of the total Commercial/Retail market. Office and Educational are down -4% and -1%. Nonresidential buildings takes the brunt of declines in both 2020 and 2021.
In 2021, every nonresidential building market is down from 2020, some markets down -10% to -20%. Educational, Healthcare and Office are all down -3% to -6%. Non-building infrastructure Power market is down -15%, but Transportation spending is up +10% due to strength in backlog from several multi-billion$ starts over the past few years.
Manufacturing projects have a moderately long duration. So, projects that fell out of the business plan caused a drop in starting backlog of -32% for 2021 and -33% for 2021. It should not be hard to see how that leads to a huge decline in construction spending the next two years. The same thing happened with Amusement/Recreation and Lodging, although lodging tends to have shorter duration, so affects mostly 2021.
A recent AGC survey of construction firms asked, how long do you think it will be before you recover back to pre-COVID-19 (levels of work)? The survey offered “longer than 6 months” as an answer choice. Less than 6 months was the right answer for residential, but my current forecast for full recovery of nonresidential buildings work is longer than 6 years.
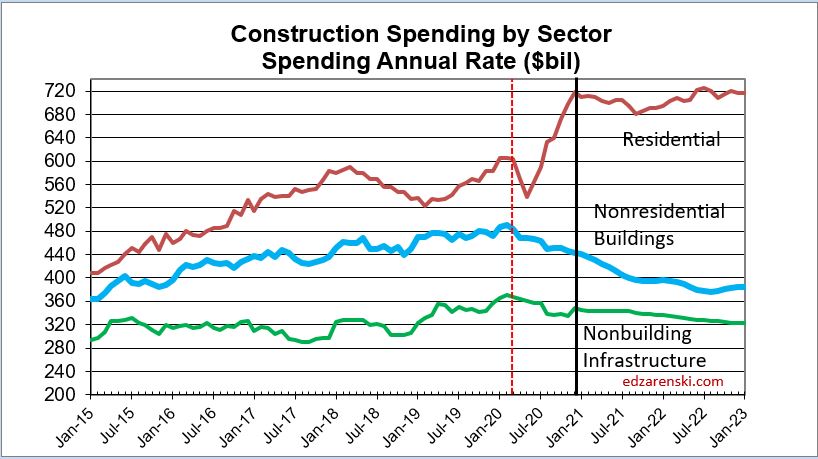
Construction Spending drives the headlines. Construction Volume drives jobs demand. Volume is spending minus inflation. Inflation $ do not support jobs. Current outlook shows (recent) peak volume was 2017-2018. Volume is forecast to decline every year out to 2023.
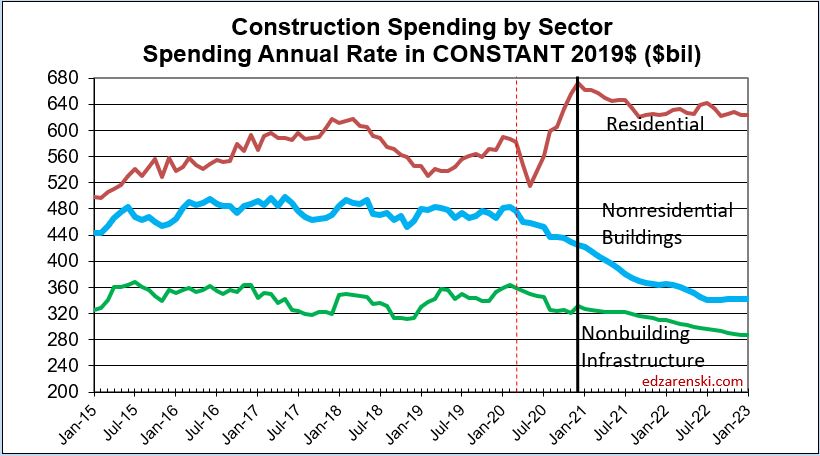
Before we can look at the effect on jobs, we need to adjust spending for inflation. The plot above “Spending by Sector” is current dollars. Below that plot is adjusted for inflation and is presented in constant $. Constant $ show volume. Notice future residential remains in a narrow range after adjusting for inflation. No sector shows improvement in volume through Jan. 2023.
When we see spending increasing at less than the rate of inflation, the real work volume is declining. For example, with construction inflation at 3% annually, a nonresidential buildings spending decline of -2.1% in 2020 would reflect a work volume decline of 5.1%. The extent of volume declines would impact the jobs situation.
While 2021 Residential spending will climb about 13%, Nonresidential building spending is forecast to drop -11% and Non-building spending drops -2%.
But with 4% inflation, after inflation Residential Volume is up only 9%, Nonresidential Building is down 15% and Non-building is down 6%.
By far the greatest decline in volume is in the nonresidential buildings sector. The greatest losses in 2020 are Lodging, Manufacturing, Amusement/Recreation and Commercial/Retail (without warehouse). In 2021, every major nonresidential building market drops in volume, with staggering 30% declines in Lodging and Amusement/Recreation. Commercial/Retail and Manufacturing will drop -13% to -15%.
Here’s the same graphic as above, but in Constant $, so it’s inflation adjusted. That provides the change in volume of work.
Volume of Work
Residential construction volume dropped 12% from the January 2020 peak to the May bottom, but has since recovered 22% and now stands at a post Great Recession high, 10% above one year ago. Although residential spending remains near this high level for the next year, volume after inflation begins to drop by midyear.
Nonresidential volume has been slowly declining and is now down 10% from one year ago. By 3rd quarter 2021, nonresidential buildings volume is forecast down another 15% lower than December, or 25% below the Feb 2020 peak. This tracks right in line with the 24% decline in new construction starts in 2020. Most of the spending from those lost starts would have taken place in 2021, now showing up as a major decline in spending and work volume.

While construction spending in 2021 is forecast up 1.3%, after inflation construction volume is expected to decline 2.5%. Residential construction spending is forecast up 13%, volume up almost 9%, but 2021 nonresidential buildings spending is forecast down -11% leading to a decline in volume after inflation of -14%. Nonbuilding Infrastructure spending in 2021 declines -2.5%, volume drops -6%.
Nonresidential buildings volume declines of 14% project to a loss of over 400,000 jobs next year and non-building infrastructure is projected to drop 60,000 jobs, but Residential could experience growth next year of 250,000 jobs. That could net annual average jobs losses to -200,000. Job losses continue into 2022 with net volume declines of 4%.
Jobs are supported by growth in construction volume, spending minus inflation. We will not see construction volume return to Feb 2020 level at any time in the next three years. This time next year, volume will be 5% lower than today, 10% below the Feb 2020 level.
Download the complete 2021 Initial Forecast here
Along with this forecast document, See these related articles
2021 Construction Economic Forecast – Summary
Measuring Forecasting Methodology & Accuracy
Public/Private Construction Spending Forecast 2020-2021

I believe that when Ed speaks of volume he means construction price inflation-adjusted spending. Speaking of which – are all of the tables and charts unadjusted spending, and – if so – do you plan to publish some tables of projections of “real” volume trends & forecasts?
Thank you
LikeLike
Right, Scott. Inflation adjusted spending is volume. Inflation in the dollars adds nothing to any quantity or units, so inflation can’t be added in spending if you want to measure volume growth.
Some of the recent posts have numerous plots of volume vs jobs. And there’s plenty of recent inflation data.
LikeLike
Scott, see new plot added – Constant 2019$ plot for same data as in the spending plot. So comparable charts, to see the difference.
LikeLike
question about ‘spending’ vs. ‘volume’ … spending is obviously the dollar spend. Is volume the number projects?
LikeLike
Volume is simply spending minus inflation.
LikeLike