3-6-21
Don’t be fooled by the upturn in January nonresidential buildings construction spending.
The greatest negative impact created by the loss of nonresidential buildings new starts from Apr 2020 to Oct 2020 has not yet hit spending and jobs in this sector. Expect both spending and jobs to decline steadily throughout 2021. My current forecast shows monthly spending down on average 1%/month for 9 out of the remaining 11 months in 2021. Dec 2021 SAAR (seasonally adjusted annual rate) will be 10% below Dec 2020, 18% below Q1 2020.
Do not expect any jobs growth in construction in 2021.
We all know a project takes time to build. It starts out slow, ramps up to peak spending and staffing just after the midpoint of the schedule and tapers off to completion. Peak monthly spending on a project with a 20-month schedule occurs 10 to 12 months into the schedule.
If we record a month of new starts 20% above normal, then 10 to 12 months from now spending and jobs from projects that started in that month will be 20% higher than normal. Then it stands to reason, if we record a month of new starts that is 20% BELOW normal, then 10 to 12 months from now spending and jobs from that month will be 20% lower than normal.
The greatest impact on spending, either up or down, from changes in new construction starts, occurs at the point in time when those projects would have reached peak spending, near the project midpoint.
In April 2020, new starts for nonresidential buildings fell 40% and then averaged 30% below normal for the next 6 months. If average duration of nonresidential buildings projects is about 20 months, then the loss of new starts will result in a maximum decline in spending and jobs 10 to 12 months later. (If average duration is about 24 months, then the loss of new starts will result in a maximum decline in spending and jobs 12 to 14 months later. This analysis uses 20 months).
Declines in new starts after April 2020 were large through the entire year, but during the months April through October 2020, starts averaged down 30%. Therefore, the maximum declines in spending and jobs from this period of reduced starts will occur 10 to 12 months later, from the beginning of the period to the end, from February through August 2021. Nonresidential buildings new starts in November, December 2020 and January 2021 are still down 20% from the pre-pandemic 6mo avg. high. This means spending declines will continue past August 2021, but at a slower rate of decline.
In Q1 2020, nonresidential buildings construction spending SAAR (seasonally adjusted annual rate) was $485 billion/yr. In April and May it had only dropped 3.5%. In Dec 2020 nonresidential buildings spending was $440 bil., down 10% from Q1. By May 2021, nonresidential buildings spending will only be $420 bil. By September 2021, the rate will be down to $400 billion.
Nonresidential buildings construction spending forecast in 2021 is down 11% from 2020. Spending continues to decline 6% in 2022. Inflation makes all these numbers slightly worse. If spending is down 11% at a time when inflation is up 3%, then real volume of work is down 14%. Jobs should follow in step with volume.
Nonresidential buildings spending especially will remain below the previous high at least for the next three years, probably longer. New starts in 2021 would need to ramp up by more than 40% to push 2021 spending back up to previous levels. New starts are forecast to gain only 3% to 5% for the next two years.
Nonresidential buildings (and to a lesser extent Nonbuilding Heavy Engineering) spending and jobs losses for the next year will be much greater than the gains expected due to increases in residential spending. New construction starts in 2020 for all types of nonresidential work declined by what is adjusted to a $150 billion decrease in spending. Residential increased by $35 billion. But again, the spending from those starts is spread out over time.
Nonresidential buildings volume declines of 14% project to a loss of over 400,000 jobs in 2021 and Non-building Infrastructure is projected to drop 60,000 jobs, but Residential could experience growth next year of 250,000 jobs. That could result in net annual jobs losses of 200,000. Job losses continue into 2022 with net volume declines of 4%.
Here is a sample cash flow schedule that shows when spending is impacted by changes in new starts in 2020.
Click on chart to see larger. Use back arrow to return to this article.
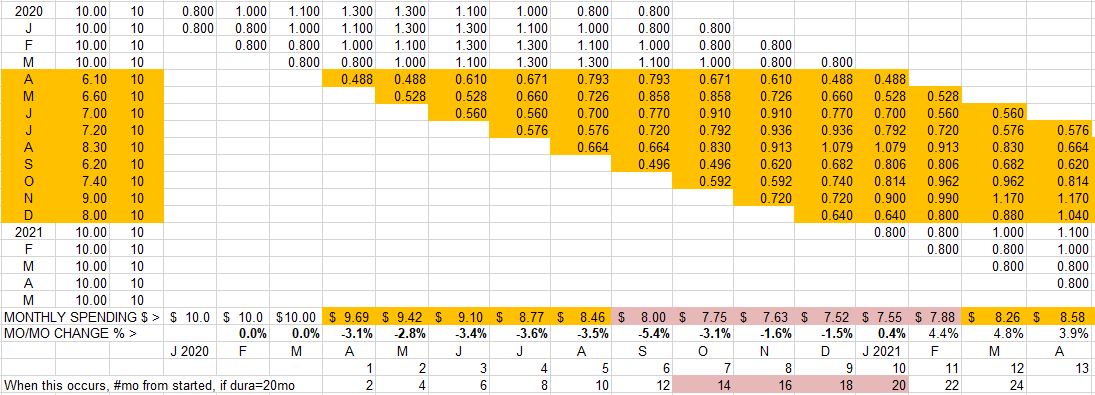
This cash flow schedule is based on reduced starts in Apr-Dec 2020. All other months are considered at 100% of the pre-pandemic rate. This sample uses $10bil/mo of new starts as 100%, the high in the 1st quarter, carried out over a 10mo schedule. If the rate of starts were to remain constant at $10bil/mo, then the spending would also remain constant at $10bil/mo. The amounts carried for April to Dec represent the actual starts recorded, measured as a percent of previous high, the 1st quarter 2020, so $6.6 bil in May is 66% of the pre-pandemic highpoint average, which here is $10bil.
With the onset of reduced starts in April 2020, spending began to fall, but only a few percent. The cumulative impact to spending of all reduced starts will be months later than the initial impact. Cash flow shows maximum impact is ~50% to 60% out in time of each individual schedule. The spending in any given month includes input from starts in 10 different months. It’s when a month lines up with all the inputs from reduced starts months that spending reaches its lowest.
The bottom line of $ is construction spending per month, the sum of the contributions from the cash flow of all the still ongoing projects. That shows when greatest impact occurs. The low point in spending can be measured in months from the initial event, April 2020. But the combined effect extends well beyond the initial event (reduced starts) which started in April but lasted until December. This is why maximum impact of reduced spending for nonresidential buildings stretches over a long period in 2021-2022.
Assuming an average duration for a particular nonresidential buildings market sector is 20 months to build, deepest losses will occur 60%x20mo or 12 months later, Apr2021, and continue to Dec2021. This duration certainly varies by building type and could vary from as short as 12 months to as long as several years. Maximum impact is always 50%-60% into the duration.
Declining spending does not support jobs growth.
