Construction spending April 2021
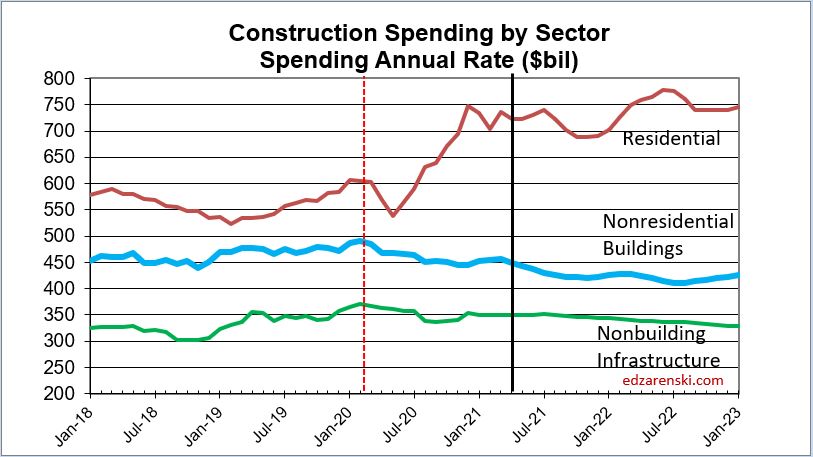
Construction Spending is up 5.8% year-to-date (ytd), however that’s broken down into three parts, up 21.8% for residential, down -6.2% for nonresidential buildings and down -4.9% for nonbuilding infrastructure.
In the 1st 3 months of 2020, spending had reached an all-time high averaging a SAAR of $1,461 billion.
In the 1st 3 months of 2021, spending hit a new all-time high averaging a SAAR of $1,515 billion. In April, spending is now up to $1,524 billion.
But these new highs belie the situation in spending. Year-to-date, while residential is up 20%+, 14 of 16 nonresidential markets, 95% of total nonresidential market value, are down.
In Apr and May 2020, residential spending fell -6% and -5%, down a total of -11% in two months. Then residential spending increased every month for the remainder of 2020, By Dec 2020 residential spending was 24% higher than in Q1 2020. Residential spending for 2021 is forecast to end up 15.4% for the year, but (the annual rate in) Dec 2021 will be -8% lower than Dec 2020.
Nonresidential Bldgs did not follow the same magnitude of declines, down only -3.5% in April 2020 and only -0.5% in May. But Nonresidential Bldgs spending has been down 10 out of 13 months since March 2020, now down -7.5% from the avg in Q1 2020. Nonres Bldgs spending, forecast down -5.7% from current over the next eight months, is forecast to end at -6.0% for 2021.
Construction starts are leading the way to recovery, but construction spending this year, which is dependent mostly on starts from the previous year (down -22%), will remain depressed for nonresidential construction well into 2022. Recovery in backlog begins to build in a few markets in 2021. However, new nonresidential starts could double from the current rate of growth and it still wouldn’t be enough to turn 2021 nonresidential spending positive.
Aside from residential, recovery of revenue (spending) won’t begin in earnest until 2023.
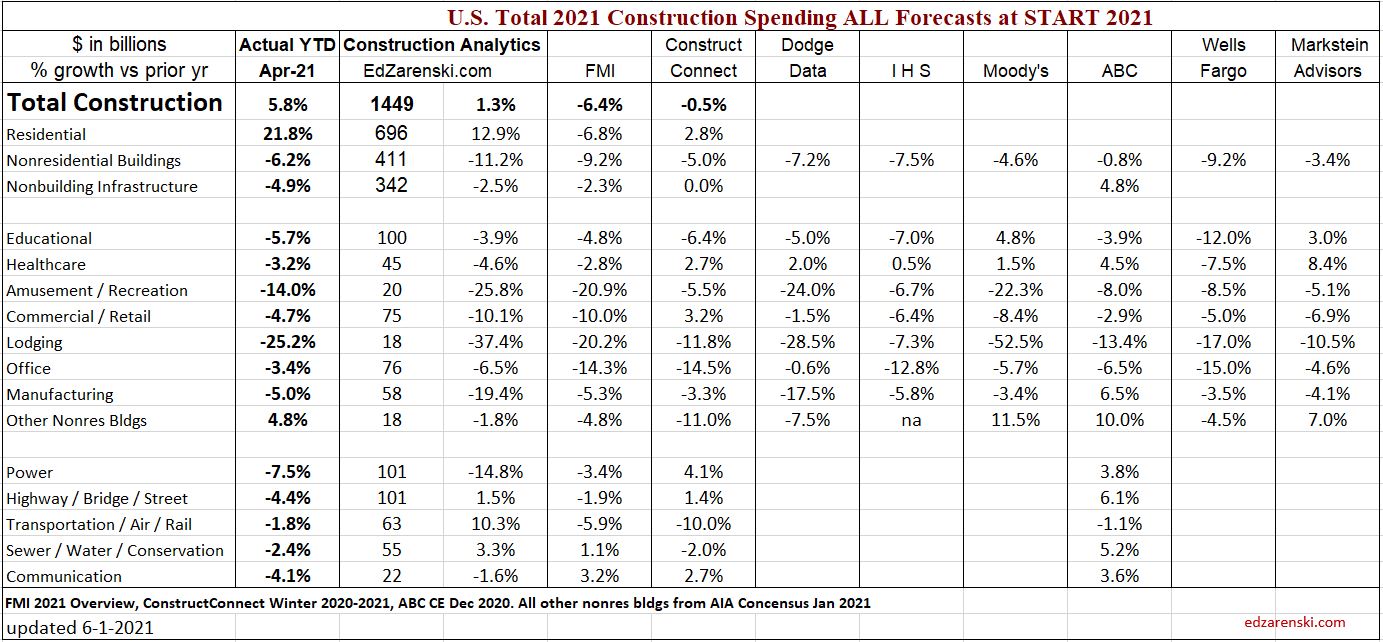
The following table shows ytd through Apr $ and forecast for 2021/2022. Almost every nonresidential market is down ytd and down compared to the average in Q1 2020 before Pandemic Recession.

The impact of reduced starts in 2020 is starting to show up in the 2021 year-to-date results. Total Nonres Bldgs starts were down 22% in 2020, Nonbldg Infrastructure down 13%. Some of these markets will be affected by a downward trend in spending for two to three years.
2020 starts for select markets:
- Amusement -38%
- Commercial/Retail -14%
- Office -20%
- Lodging -50%
- Manufacturing -57%
- Power -38%
The greatest downward impact on spending will be felt in mid-2021. Over the next 9 months, every sector will post more down months than up months, although the declines will be most noticeable in nonresidential buildings.
For the next few months the residential year-to-date comparison will be skewed. It is going to increase due to the steep fall-off in spending back in April and May 2020. Then months of strong growth, a total +38% in 7 months in residential from May 2020 onward, with no equivalent growth increase this year, will cause ytd comparisons to decrease. So, even though residential spending is not forecast to increase any more in 2021, residential spending will peak at +25% year-to-date in the May-June data (due to the steep decline in spending in 2020) before falling back to end at +15% ytd for year end.
YTD for nonresidential buildings, currently at -6.2%, will remain near this level for the rest of the year.
The following table shows two data sets: all markets spending compared to avg 1st qtr 2020 and forecast change for next 8 months. The forecast for the remainder of 2021 showing the trend, up or down, is down for almost every nonresidential market. So while most markets recovery to positive new starts growth in 2021, spending growth lags showing the downward trend in 2021 as a result of lost starts in 2020.

This next plot changes the scale of the spending plot so the nonresidential buildings data can be visualized much easier. This is the exact same data as in the Construction Spending by Sector plot above. The scale change helps immensely.
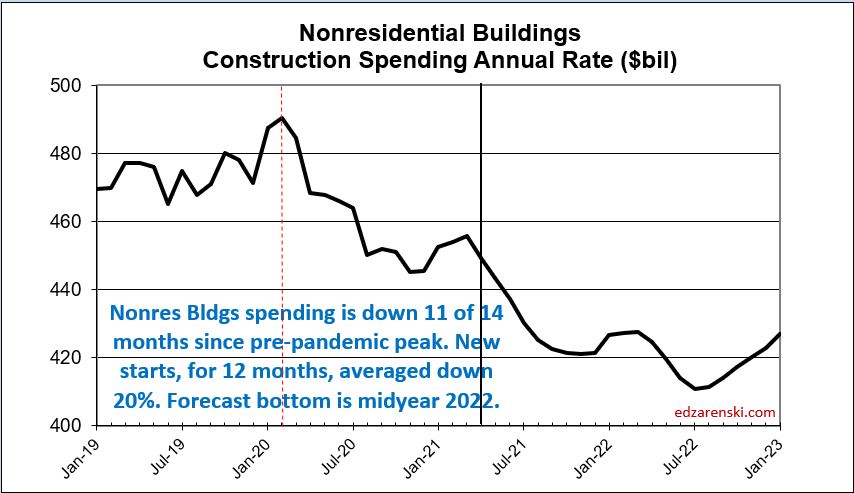
A typical batch of new construction starts within a year gets spent over a cash flow schedule similar to 20/50/30, that is, 20% of all starts in the year gets spent in the year started, 50% in the next year and 30% in years following. Total nonresidential buildings starts in 2020 were down 22% ($100bil in spending) and nonbuilding was down 13% ($50bil). Under normal conditions, we know how much of that $150 bil would have occurred in 2020, 2021 and 2022. That’s a loss of spending this year, and that loss remains a steeply downward slope as long as starts remain depressed. Nonresidential starts, down now for 12 months, posted some hint of recovery in April.
If infrastructure starts don’t begin until the 2nd half of the year, only 25% to 30% (of the 1st year 20/50/30 that is based on 12mo) gets spent in the 1st year. Therefore, even if $100 billion in new infrastructure starts begin in the 2nd half 2021, only 30% x 20% or only about 6% would get spent in 2021. That’s $6 billion, or less than 1% of annual construction spending.
This table shows the ytd 2021 compared to the initial forecasts by Construction Analytics and eight other firms. The ytd and the forecast for the remainder of 2021 (table above) provide insight into expected final 2021 performance. Up above I’ve compared ytd to my current forecast. Here, ytd$ is compared to all the initial forecasts for 2021.
6-4-21 Construction jobs report released. Down 20,000 jobs for May. Both March and April revised down slightly. Jobs have increased only 23,000 for the 1st 5 months of 2021. Construction is still down 225,000 from Q1 2020.
I’ve been calling for a slowdown or slight decline in jobs growth. Construction spending adjusted for inflation (constant $) is down 2% since Dec-Jan. The trend is down for the rest of the year.
Construction volume growth is falling due to huge volume of nonresidential starts (-22%) that disappeared in 2020. The affect of those lost starts, which would have had peak spending in mid-2021, is such that volume of work is declining throughout 2021.


It’s crazy how rapidly the cost of residential construction has gone up in the past year. The company I work for, Compassion Construction, does water damage restoration, and roofing and most of our clients are filing insurance claims so we don’t typically have to worry about the rising cost of materials. But some of our clients are having to pay out of pocket for their projects and they frequently ask us if we think the cost of materials will go back down any time soon. Do you think prices will fall or do you think these higher costs are the new normal?
LikeLike
Prices will fall. In fact, lumber is down 40% in recent weeks.
LikeLike