Construction Spending Actual through June 2021
Total Construction Spending is up 5.4% year-to-date (ytd) from the same six month period 2020. Residential is up 24.5%, Nonresidential Buildings is down -10.1% and Nonbuilding Infrastructure is down -5.4%.
The single largest impact to the change in this forecast from last month is Highway and Street. Highway spending in June fell 5%, while my forecast was predicting a gain of +3%. I then lowered my forecast for the rest of this year.
Year-to-date through June, while residential is up 24.5%+, all but one single nonresidential market is down. 15 of 16 nonresidential markets, 98% of combined total nonresidential market value, are down a total of -8%. Only Sewage/Waste Water is up 2.5% ytd. That’s half of the $ in the table item Sewer / Water / Conservation. For the remainder of the year, the rate of nonresidential decline will slow to -4%.
Construction starts are leading the way to recovery, but construction spending, which is dependent mostly on starts from previous years (nonres bldgs 2020 down -20%), will remain depressed for nonresidential construction well into 2022. New nonresidential starts could double from the current rate of growth and it still wouldn’t be enough to turn 2021 nonresidential spending positive.
It is remarkable that both total new construction starts and total construction spending are UP for 2021, but that needs further explanation.
Residential starts increased +9% in 2020 and forecast up +19% in 2021. Residential spending increased +15% in 2020 and is forecast up +18% in 2021 and up +7% in 2022. Both residential starts and spending are at all-time highs. That is what is driving the totals to new highs.
Nonresidential Bldgs starts fell -4% in 2019, -21% in 2020 and are forecast up only +2.5% in 2021. 2021 starts are still -22% below the peak in 2018. Nonresidential Bldgs spending fell only -2% in 2020 but is expected to fall -8% in 2021 and -5% in 2022.
Nonbuilding starts were flat in 2019, fell -15% in 2020 and forecast indicates +4% growth in 2021. Nonbuilding starts are 11% lower than 2019. Nonbuilding spending gained only +1% in 2020, but forecast fell -3% in 2021 and is expected to drop -5% in 2022.
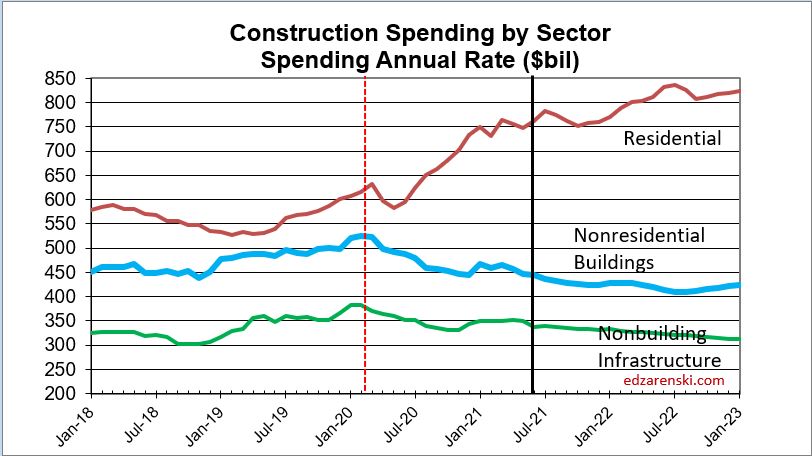
The Total Construction Spending plot doesn’t show enough detail. As described above, more detail is needed to understand what is going on. The sector plot below shows residential up and nonresidential down..

Recovery in both nonresidential buildings and nonbuilding backlog begins to build in a few markets in 2021. But overall, spending in nonresidential buildings and nonbuilding is exceeding new starts, therefore both will begin 2022 with lower backlog than 2021. Total all nonresidential 2021 starting backlog dropped -13% from 2020. Starting backlog at beginning of 2022 will be down another -8%. Backlog increases for 2023.
Aside from residential, recovery to the levels of revenue (spending) recorded in Q1 2020 or earlier won’t show up before 2024.
The following table shows ytd through June $ and forecast for 2021/2022. Almost every nonresidential market is down ytd and down compared to the average in Q1 2020 before Pandemic Recession.

Impact of Pandemic Slowdown
The impact of reduced starts in 2020 is showing up in the 2021 year-to-date results. Total Nonresidential Buildings starts were down -20% in 2020. Nonres Bldgs starts for the 1st 6 months of 2021 are level with 2020, still down -8% from the pre-pandemic high in Q1 2020. There is some good news! Nonres Bldgs starts in Q2 2021 are now back above the pre-pandemic high, indicating recovery underway. Nonbuilding Infrastructure starts were down -10% in 2020, but returned to pre-pandemic high several months ago.
Due to the large drop in new starts from Apr 2020, that continued at a level down -20% to March 2021, some nonresidential markets will be affected by a downward trend in spending for two to three years.
The greatest downward impact from a -20%, year-long loss of starts on nonresidential spending will be felt throughout 2021 and into 2022.
Over the next 9 months, every sector will post more down months (in spending) than up months, although the declines will be most noticeable in nonresidential buildings.
Overall performance by sector has changed very little since May.
While most markets recover to positive new starts growth in 2021, spending growth lags, showing the downward trend in 2021 as a result of lost starts in 2020.
This next plot changes the scale of the spending plot so the nonresidential buildings data can be visualized much easier. This is the exact same data as in the Construction Spending by Sector plot above. The scale change helps immensely to visualize the decline in nonresidential buildings spending. By midyear 2022, the annual rate of spending will be -20% lower than the pre-pandemic peak. It could take two to three years after that to recover to the pre-pandemic level of spending.

A typical batch of new construction starts within a year gets spent over a cash flow schedule similar to 20/50/30, that is, 20% of all starts in the year gets spent in the year started (or over the 1st 12 months), 50% in the next year ( next 12 mo) and 30% in years following. Total nonresidential buildings starts in 2020 were down -20% ($90 bil in spending) and nonbuilding was down -10% ($35bil). Under normal conditions, we know how much of that $125 bil would have occurred in 2020, 2021 and 2022. That’s a loss of spending this year, and that loss remains a steeply downward slope as long as starts remain depressed. Nonresidential buildings starts, depressed for 13 months, posted strong starts indicating recovery beginning in April this year.
If INFRASTRUCTURE BILL starts don’t begin until the 2nd half of 2021, only 30% (of the 1st year cash flow 20/50/30 that is based on 12mo) gets spent in the 1st year. Therefore, even if $100 billion in new infrastructure starts begin in the 2nd half 2021, only 30% x 20% or only about 6% would get spent in 2021. That’s $6 billion, or less than 1% of annual construction spending. So, there will be very little, if any, impact on 2021 construction spending as a result.
Total Public Infrastructure and Public Institutional, the total public work pool for which infrastructure investment is a potential, represents a total LESS THAN $350 BILLION, only 25% of all construction.

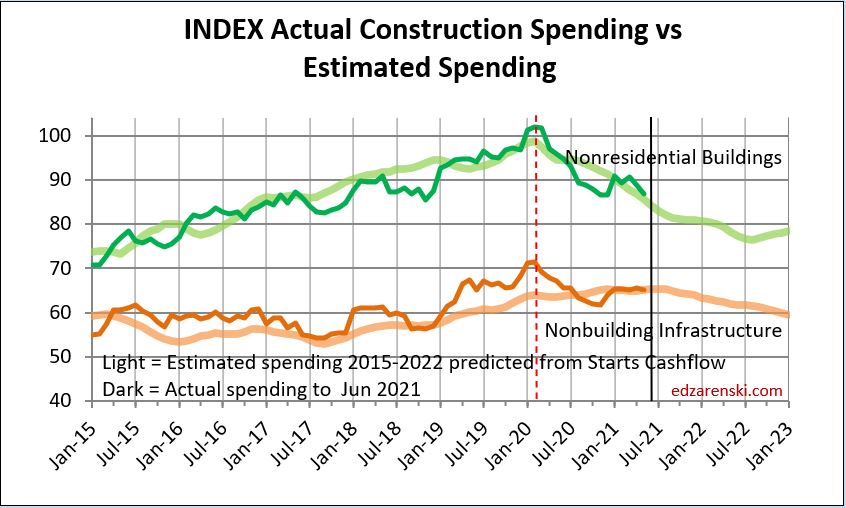
All the forecast spending in the data above is developed from monthly cash flow of new starts. This plot shows what the history looks like when comparing the cash flow forecast to the actual spending growth. Although actual spending is somewhat more uneven, the forecast accurately predicts the direction spending is headed.
JOBS DATA updated 8-6-21
Construction Jobs for July are expected to increase. Jobs are now down 3 consecutive months. Comparing jobs year-over-year in residential is strongly skewed by the rapid declines then rapid growth in 2020. That did not occur in nonresidential. July posted an increase of 11,000 jobs. Year-to-date thru July construction is up by 21,000 jobs. Jobs are down -227K (-3.0%) from Feb 2020 peak. Hours worked are down less than -1%, equivalent to about 50,000 jobs. Expect this downward trend to accelerate into year end.
Construction spending minus inflation (Volume) supports jobs. Most of the increase in residential construction spending this year is INFLATION. Nonresidential spending and volume are both down. There is no meaningful increase in total construction volume to support jobs growth.
Don’t ignore inflation. While residential spending is forecast UP 19% in 2021, 11% of that is inflation. Real volume is up only +8%. Nonres Bldgs volume after inflation is forecast down -12%, Nonbuilding volume down -7%.
If you are still measuring your business growth by change in revenue, you’re including inflation as part of your growth. Inflation is simply more paper dollars exchanging hands, not growth.
Total construction jobs through July measured from peak pre-pandemic (Feb 2020) are down 3%. Volume growth (spending minus inflation) from Feb 2020 to July 2021 is down 6%. Since the onset of the pandemic, we now have 3% more jobs than we have volume of work to support those jobs. The result is a 3% loss in productivity.
Residential change in revenue from Feb 2020 to July 2021 is up +28%. But the real change in volume after inflation is up only +13%. Residential jobs are up only 3%. This is where the greatest need is currently.
Nonresidential Buildings change in revenue from Feb 2020 to July 2021 is down -15%. After inflation, the real change in volume is down -19%. Nonres Bldgs jobs are down only -7%. This is considerable excess jobs to support the current work.
Nonbuilding Infrastructure change in revenue from Feb 2020 to July 2021 is down -10%. After inflation, the real change in volume is down -17%. Nonres Bldgs jobs are down only -6%. This is considerable excess jobs to support the current work.
The need identified in residential, and likewise the excess identified in nonresidential are not as extreme as both seem. There are a large number of jobs classified as nonresidential that actually perform residential work. Any large firm, and all it’s employees, regardless of the job they perform, if they primarily work on nonresidential buildings, is classified nonresidential for the purpose of the jobs count. However, the buildings they work on are always classified as to building type. This often occurs in several large primarily nonresidential trades such as concrete, structural steel and HVAC, when working on multifamily high-rise buildings. These crossover jobs are not separable from the major classification.
In constant $ (spending adjusted for inflation), even though residential constant $ volume is up 13% from Q1 2020, current total $ volume of all types of work, residential and nonresidential, is 6% lower than the peak average in Q1 2020. Total all $ volume will fall another 5% by year end 2021.
Construction spending is on track to increase 4.7% in 2021 over 2020. But after taking out inflation, spending minus inflation in 2021 will be DOWN 2%. Residential spending increases $115 billion (+18%), but after 11% inflation residential volume increases only $50 billion. All nonresidential spending decreases $49 billion but after adjusting for 4%+ inflation real nonresidential volume is down $86 billion. Total construction volume (spending minus inflation) is expected to decline 5% from May to Dec. Construction Jobs are expected to follow suit.
Construction volume growth is falling due to huge volume of nonresidential starts (-22%) that disappeared in 2020. The affect of those lost starts, which would have had peak spending in mid-2021, is such that the volume of work is declining throughout 2021.
Of concern is that since Feb 2020, total construction volume has recovered to a point that is down 7%, but jobs have increased back to a level that is down only 3%. Jobs are increasing at a rate that is closer to the growth in construction spending, which is substantially greater than the rate of growth of construction volume.
Jobs are increasing faster than the volume of work (which supports jobs). What are the implications of this to the construction industry? The industry as a whole now expends 4% more labor (jobs) to put-in-place every $1 billion worth of work than it did in Feb 2020. That impacts job total labor cost. That is lost productivity and impacts inflation.
Although residential jobs are currently increasing, nonresidential jobs will continue to fall, dropping another 4% over the next 12 months. If jobs growth follows more closely to volume growth, which it should, this time next year construction could be down another 200,000 jobs.

2021 Midyear Forecasts
Here’s how the current year-to-date spending performance, as of June data, compares to various firms’ Midyear Forecasts. The ytd provides insight into expected final 2021 performance. For example, the year-to-date Educational spending is -10.8% with 6 months of spending recorded. One firm has forecast educational will finish up 3.5% for the year. With only 6 months remaining (estimate to complete or etc), here’s how the remaining 6 months would need to perform for that to happen.
[(forecast% x 12) – (YTD% x 6)] /6mo etc = [(+3.5% x 12) – (-10.5% x 6)] /6 = [(+42) – (-64)] /6 = 106/6 = +17.6%.
For the next six months Educational spending would need to average +17.6% growth over last year to swing from currently down -10.8% to end the year up +3.5%. Well, Educational spending is down 16% from the 2020 high, has fallen 9 of the last 13 months and is down an average of -1.5%/mo for the last 5 months. With this performance over the past year, the probability is exceedingly low that Educational construction spending is going to flip from a negative monthly rate of spending to an avg of +17%/mo for the next six months to finish the year up +3.5%. There are numerous examples like this in the forecasts.

