Home » Construction
Category Archives: Construction
Construction Briefs Jan 2026 Data Update 2-2-26
We are still not where we should be with actual data due to government data delays caused by the shutdown. Recent releases bring BLS jobs data up to Dec, PPI data through Nov and Construction Spending data through October. Here’s a collection of tables and plots reflecting some of that data through the end of January.
Construction Spending Value Put in Place
The November 2025 release, originally scheduled for January 2, 2026, and the December 2025 release, originally scheduled for February 2, 2026, for the Monthly Construction Spending report have been rescheduled for release on February 27, 2026.
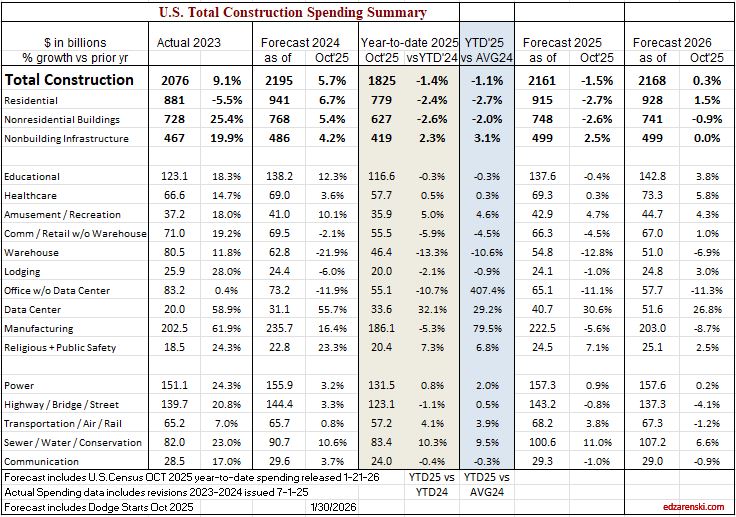
There’s is an unusually large decline in residential construction spending in Sept data, almost entirely attributed to renovation work. A closer look at the data shows it may be that Aug and Oct reno data seem out-of-sync and those may be overstated. All 2025 data still open to Jul 1 revision.
25 data center projects were canceled in 2025 amidst surging local opposition — 4X as many as in 2024.
( Personal opinion – Data Center growth will be restricted by difficulty to ramp up power generation and transmission. This in turn will slow construction spending growth in this market).
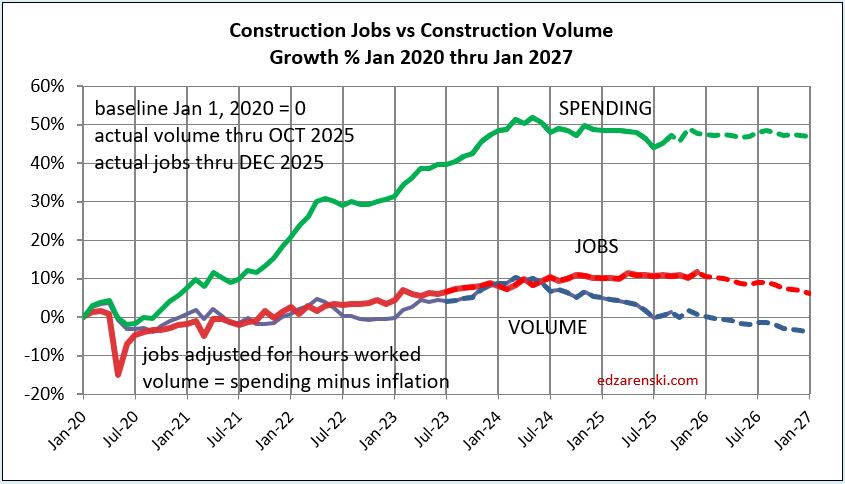
Construction Jobs increased 1.1% in 2025. Spending (actual thru Oct) fell 1.5% in 2025. But inflation ate up 4% of spending. So real volume of construction activity fell 5.3%. Therefore, productivity fell 6.4%.
Also, if your construction business revenue increased less than 5.3% in 2025, your real business growth fell in 2025.
Jobs 2025 Nonres Bldgs +1.6%, Nonbldg +2.4%, Residential -0.6%
Construction Spending – Volume – Jobs
Construction Jobs avg 2025 increased only 88k from avg 2024. Slowest jobs growth since 2011 (ex 2020). Jobs 2025 up 1.1% over 2024. Jobs have been flat (or +/- slight) since Feb.
Residential jobs down 0.6%, but rsdn spending ytd thru Aug down 3.7% from Q4’24. After adjusting for inflation rsdn volume ytd is down 6%. Nonres Bldgs jobs up 1.6%. Nonres Bldgs volume down 3%. Nonbldg jobs up 2.4%. Nonbldg volume up 1.5%.
Environment for construction jobs looking difficult. Volume of work (spending minus inflation) available is declining all through 2026. Biggest declines by far, Manufacturing and SF Rsdn.
In the 10 months period Jan-Oct’25, construction volume declined by 4%. In the same period, construction jobs increased by 0.5%. And yet some economists are saying that job openings and hires indicate a labor shortage. Jobs should follow the amount of business volume.
Don’t expect construction to add jobs in 2026. While spending may be near flat, inflation data for 2026 has volume projected to fall 3.7%.
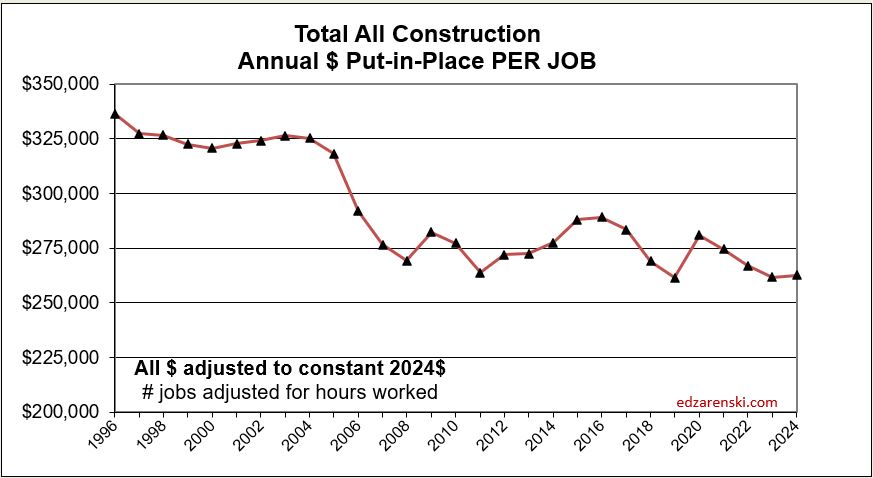
Construction Productivity
Construction spending constant $$ (volume) for 2025 is down 5.3% compared to start 2025 or same month 2024. I’m forecasting a decline of 3.7% in 2026. A 3.7% drop in volume could be a loss of 300,000 Jobs. Companies usually don’t cut # of jobs indicated by falling business volume. More jobs remain than volume. Productivity ($ pip per job) declines.
In 2026 real construction volume after inflation is expected down -3.7%. If we keep all current jobs, then volume put-in-place per job is lower, a decline in productivity of 3.7%. If we want to maintain the current level of productivity, we would need to lose 3.7% (300k) jobs. Unless the volume of work increases, I’d expect productivity to fall in 2026.
Volume of work is spending minus inflation. When jobs growth exceeds volume growth, productivity is declining. Volume has been declining for last 2 years and is expected to continue declining in 2026.
Inflation Index and Producer Price Index
If you track company revenues as business growth, without adjusting your business plan for inflation, you’re tracking register receipts, not business volume. Here’s a simple example to understand the difference in revenues (spending) vs volume. If a basket of apples 2yrs ago cost $25, but today the same basket cost $35, receipts increased 40%, but business volume has not changed.


Construction Analytics Outlook Feb 2025
2-22-25 — A PDF of this entire Outlook article has been attached at the bottom of this post. 32pages, watchout. The Outlook has quite a bit more than in the post here.
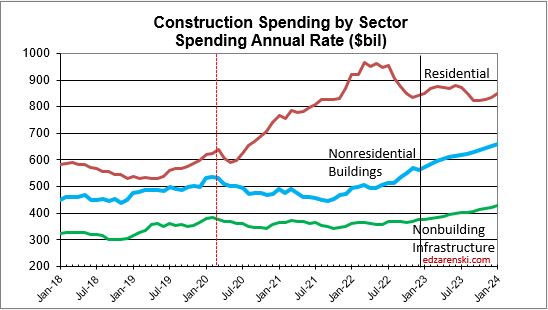
Construction Spending
for 2024 vs 2023, as of Dec 2024 data, is up 6.5%. All sectors gained between 6% and 7% over 2023. Growth is forecast at 5.5% in 2025. While Residential and Non-building Infrastructure will both gain 7%, Nonresidential Buildings will only see growth of 2% in 2025.
In February of 2025, with the Dec 2024 data in hand, my forecast for 2025 spending is $2,272 billion, 5.5% higher than my current 2024 forecast of $2,154 billion. There is strength in most markets, but Manufacturing is starting a downward slope in spending after three years of blockbuster performance.
This is the first report of a full 12 months of data from 2024. This number gets revised in Mar and Apr and again in July, when any/all months for the last two years get revised.

Last year at this time, leading into 2024, many of the Nonres Bldgs and Non-bldg line items showed Nov-Dec spending was already several points higher than the 2023 average. This year, many markets show very small gains or a decline in the rate of spending from the 1st half of the 2024 into the 2nd half. Some notable declines are Warehouse (-2.7%), Office w/o Data Centers (-3.6%) and Highway/Bridge (-2.9%). All begin 2025 down from the average in 2024.
However, Data Center spending is already up 16% in Oct-Nov-Dec vs the average of 2024, so begins 2025 on a high note, up 16% from 2024. Data Center spending increased 45% in 2023 and 56% in 2024. With spending increasing at an average 3%+ per month in 2024, and starting out at that pace in 2025, it’s easy to predict Data Center spending may reach 40% growth for 2025.
As we begin 2025, the current rate of spending (SAAR) for Nonresidential Buildings in Q4’24 is $761bil, only 2% higher than the average for 2024 ($746bil). If spending stays at the current level and no additional growth occurs, Nonresidential Bldgs spending will finish 2024 up 2%. Spending would need to have more monthly declines than increases to finish the year up less than 2%. The current forecast shows the monthly SAAR rates for Manufacturing, Warehouse and Office w/o DC are driving the downward pressure on overall spending.
Non-building Infrastructure current rate of spending is only 1% higher than the average for 2024, however the forecast is indicating steady growth of 1.5%/mo for all of 2025. Highway, Transportation and Public Utilities are all contributing to that growth in the spending rate.
Residential current rate of spending is a bit less than 2% above the 2024 average. Growth of 1%/mo will occur in the 1st half 2025, then reverse to a slight decline in the 2nd half.
My construction spending forecast for 2025 Nonres Bldgs is only an annual gain of 2%. Low growth is driven by projects ending in Manufacturing and Warehouse. In the last 3 yrs, there were $230bil Mnfg starts, most in 2022, $130bil above normal, now some are ending. Without Manufacturing, Nonres Bldgs 2025 spending would be up 6%. So while outward appearance may be that Nonres spending is declining, in large part it is due to mega spending on Manufacturing buildings (and Warehouse) tapering down upon completion, creating very large annual declines, but normal. See The Manufacturing Spending Taper
Whenever we get an unusually large increase in new construction starts and spending, the tapering off of those projects leads to a decline in spending in the 2nd half of the scheduled construction. Mnfg new starts peaked in late 2022 – early 2023, so some of these projects would now be in construction for anywhere from 24 to 30 months, well past the midpoint or peak spending. Here’s what the manufacturing spending taper may look like.

In three years, 2020-2022 Manufacturing new starts increased by over 200%. Now, even projects that started in late 2022 are more than 24 months into construction. Peak spending occurs at the midpoint of a project, so peak spending may already be behind us. The current rate of spending in constant$, with exception of Oct. which jumped 2%, remained near flat for the last 8 months. Mnfg new starts peaked in late 2022 – early 2023, so some of these projects would now be in construction for anywhere from 24 to 30 months, well past the midpoint or peak spending. It appears the slowdown in the 2nd half 2024 may be an indication that spending peaked. Although 2025 spending begins 4% higher than 2024 average, my model indicates the rate of spending drops 10% by midyear and by year-end is down 25% from current spending. I’m forecasting 2025 spending average falls 8.5% below 2024.
See The Manufacturing Spending Taper
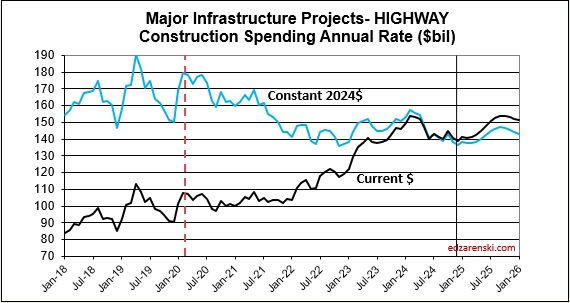
This same scenario will occur in Highway/Bridge. Normal Highway starts have consistently been about $100bil/yr, with slow growth. But actual starts were closer to $500bil total for the last three years. This strong growth in starts is expected to continue at least into 2025, totaling near $650bil for four years. Again, consider that part of that is inflation, but the remainder is government investment growth. So a decline from the taper back to normal for Highway/Bridge may not show up at least for the next few years. Once the taper begins it will have the same effect on Non-bldg Infrastructure spending that we will see from Manufacturing in Nonres Bldgs.
Residential spending is 45% SF, 15% MF and 40% Reno. So, only 60% of the total is spending on new housing units. The other 40% is Renovations. Single family construction spending reached a post-2006 high in Q4’21 thru Apr’22. From Apr’22 to the low-point in May ’23 spending dropped 25%. By year-end 2023 it had recovered most of that drop. It fell again in mid-2024, but has since recovered again to the year-end’23 level. Single Family spending is up 7% in 2024 over 2023. Multi-family in Q4’24 is down 10% from Q4’23. Renovations is up 15% from Q4’23 to Q4’24.

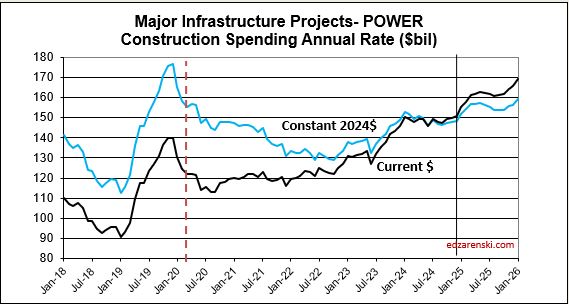
The Non-Building Infrastructure spending forecast for 2025 will be most affected by the fact that Power starts for the last 3 years range from 9% to 11%, Highway new starts range from 8% to 11% and Public Works new starts range from 13% to 17%. Starts have been greater than spending each of the last three years. Backlog increased 10% each in 2023 and 2024 and 9% in 2025. Power spending will increase $13bil (8.5%) in 2025, supported by 22% growth in starts the last 2 years. Public Utilities (Sewage and Waste, Water Supply and Conservation-Rivers-Dams) will increase $12bil (13%), with 30% growth in starts the last 2 years.
The Nonresidential Buildings spending forecast for 2025 is most affected by declines in Manufacturing and Warehouse, and increases in Educational and Data Centers. Starts in 2021 and 2022 increased at an average 14%/yr. But new starts in 2023 were only 5.5%, and in 2024 were only 2.6%. Starts in 2023, and especially 2024, have the most impact on 2025 spending. Backlog is increasing, but the rate of backlog growth has slowed from 15% in 2022 to 5% in 2024 and 2% in 2025. Although Data Center spending is expected to increase 42%, that is $12bil. Educational spending will also increase $12bil, even though that is only 9%.
Educational SAAR rate of spending begins 2025 4.5% higher than the average for 2024. Starts are up 18% over the last 2 years. Spending finished 2024 3% higher than it started. The rate of spending is increasing at 0.50% to 0.75%/month for 2025. My forecast is for 9% spending growth in 2025.


Healthcare SAAR rate of spending begins 2025 0.5% lower than the average for 2024. Starts are up 22% over the last 2 years. The rate of spending, increasing since June, is flat in Q1’25, then increases at an average of 1.5%/month for Q2 and Q3 before slowing. My forecast is for 6% spending growth in 2025.
Amusement /Recreation SAAR rate of spending begins 2025 3.0% higher than the average for 2024. Starts are up 18% over the last 2 years. The rate of spending, up 9% from Q1’24 to Q4’24, increases at an average 1.25%/month for 2025. My forecast is for 13% spending growth in 2025.
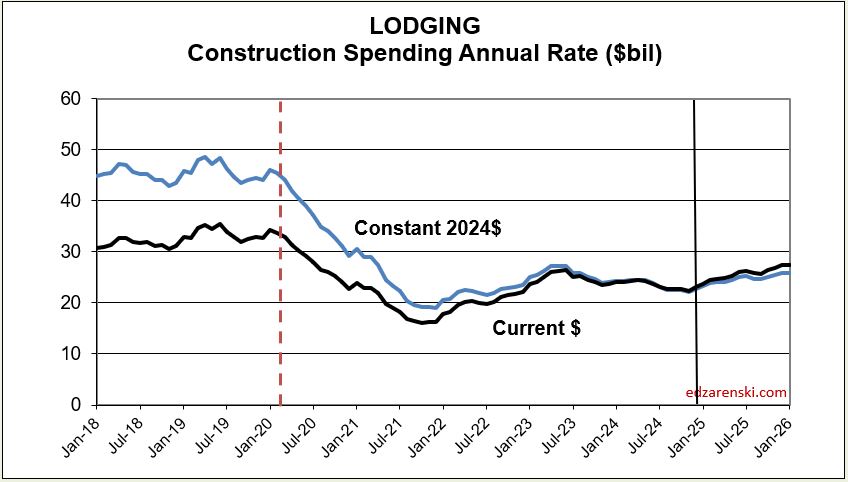
Lodging SAAR rate of spending begins 2025 3% lower than the average for 2024. Starts are up 14% in 2024 and 20% over the last 2 years. The rate of spending, lower in the 2nd half 2024, increases at an average of 1.25%/month for 2025. My forecast is for 9.5% spending growth in 2025.

Office Bldgs w/o Data Centers SAAR rate of spending begins 2025 3.6% lower than the average for 2024. Starts are down 15% over the last 2 years. Spending in the 2nd half of 2024 is down 5% from the 1st half, in fact from Q1’24 to Q4’24, the rate of spending fell 10%. The rate of spending increases 0.5%/mo in Q1’25, but then falls at 0.50% to 0.75%/month for Q2 thru Q4. My forecast is for a 4% spending decline in 2025.

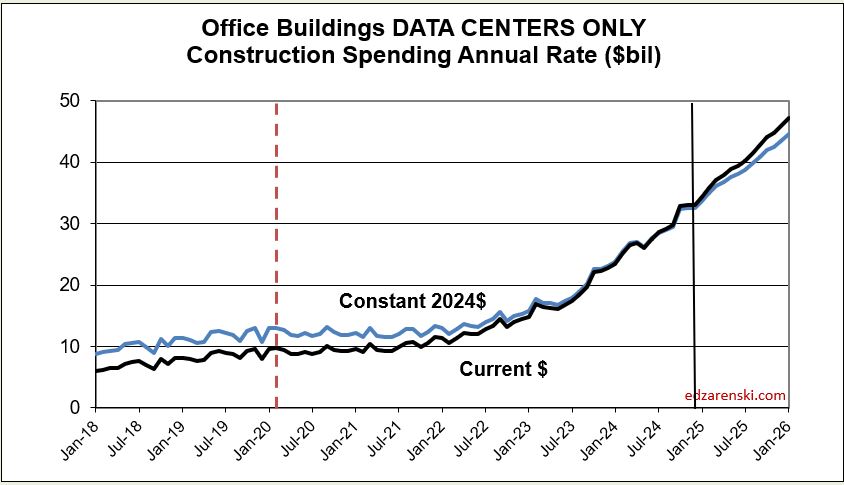
Data Centers SAAR rate of spending begins 2025 16% higher than the average for 2024. Starts are up 120% over the last 2 years. From beginning to end of 2024 spending increased 20%. The rate of spending increases at near 2%/month for 2025. My forecast is for 42% spending growth in 2025.
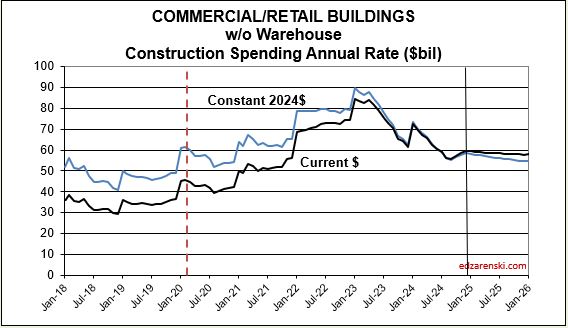
Commercial / Retail Bldgs w/o Warehouse SAAR rate of spending begins 2025 only 1.5% higher than the average for 2024. Starts are down 0.5% over the last 2 years. In 2024, the rate of spending fell 3% over the year. The rate of spending begins 2025 with a slight drop then is flat for the rest of the year. My forecast is for 1% drop in spending in 2025.

Warehouse Bldgs SAAR rate of spending begins 2025 2.7% lower than the average for 2024. Starts are down 17% over the last 2 years. Spending in the 2nd half of 2024 is already down 13% from the 1st half 2024. The rate of spending in 2025 drops at 0.25%/month. My forecast is for 4% spending decline in 2025.
Highway SAAR rate of spending begins 2025 2.9% lower than the average for 2024. Spending fell 7% over the course of 2024, but still finished the year up 4%. Starts are up 18% over the last 2 years. Monthly spending is up and down, but averages 0.8%/mo for the year. My forecast is for 3% spending growth in 2025.
Power SAAR rate of spending begins 2025 2.0% higher than the average for 2024. Starts are up 22% over the last 2 years. 2024 spending finished level with where it started and begins 2025 up 2% over avg. 2024. The rate of spending starts strong at 2%/mo in Q1, then falls back to 0.3%/mo for the remainder of 2025. My forecast is for 8.5% spending growth in 2025.
Public Utilities SAAR rate of spending begins 2025 1.7% higher than the average for 2024. Starts are up 29% over the last 2 years. From Q1’24 to Q4’24, spending increased 9%. The rate of spending slows from 1.5%/mo at the beginning of 2025 to 1%/mo by year-end. Sewage/Waste and Water Supply provide the greatest $ growth. My forecast is for 13% spending growth in 2025.
Transportation SAAR rate of spending begins 2025 4.0% higher than the average for 2024. Starts are up 9% over the last 2 years. Spending finished 2024 6% higher than it started. The 2025 rate of spending starts strong just above 1%/mo, but averages only 0.75%/mo for the whole year. My forecast is for 8.7% spending growth in 2025.

STARTING BACKLOG
Starting backlog is the estimate to complete (in this analysis taken at Jan 1) for all projects currently under contract. The last time starting backlog decreased was 2011. If new construction starts in the year are greater than construction spending in the year, then for the following year starting backlog increases. It’s when new starts don’t replenish the amount of spending in the year that backlog declines.
80% of all nonresidential spending in any given year is from backlog and could be supported by projects that started last year or 3 to 4 years ago. Residential spending is far more dependent on new starts than backlog. Only about 30% of residential spending every year comes from backlog and 70% from new starts.
The table below, Forecast Starting Backlog, is model generated by Construction Analytics. Adjusted starts are spread over time to generate cash flow. Spending each year is subtracted from starting backlog and new starts are added to get starting backlog in the following year.

Construction Backlog leading into 2025 in total is up 53% from Jan 2020. Even though several markets are down for the year, every sector (Res, Nonres, Nonbldg) is at all-time high. Since 2020, construction starts have been greater than construction spending, therefore backlog is increasing, but the spread is decreasing. From 2015 through 2019, new construction starts were steady at 4% greater than spending. In 2020, 2021 and 2022, starts exceeded spending by 8%. In 2023 it fell to 6% and in 2024 it was 5%. For 2025, starts are expected to exceed spending by only 3%, indicating the rate of backlog growth is slowing.
Reaching new highs in Backlog could mean not enough labor to support advancing growth so quickly. Future workload from new starts is piling up faster than the current workforce can complete. And the labor force has limitations to how fast it can grow. Nonresidential Bldgs and Non-building posted higher than average starts growth vs spending.
Residential new starts average only 2% greater than spending. Residential new starts in 2023 were lower than spending, so, in 2024, for the first time in 10 years, residential backlog decreased. Even then, residential backlog beginning 2025 is up 61% since 2020. However, these backlog numbers are not inflation adjusted. 45%, or about ¾’s of the 61% residential backlog growth over 5 years is inflation. Real residential backlog growth since 2020 is 16%.
Nonresidential Bldgs starting backlog for 2025 received a boost from all the starts in 2021, 2022 and 2023. Backlog is up 55% from 2020. After 36% inflation, real backlog growth over 5 years is 19%.
Non-building Infrastructure starting backlog was also boosted by strong starts in 2021- 2024. For 2025, backlog is up 49% from Jan 2020. After 38% inflation, real backlog growth over 5 years is 11%.
Manufacturing backlog increased 130% from 2020-2025, from $117bil going into 2020 to $270bil beginning 2025. Prior to tracking Data Centers separately, no other market has ever been close to that growth. But, Manufacturing is 6 times the dollar value of Data Centers. Manufacturing was responsible for 60% of all the Nonres Bldgs spending $ growth in 2023 and 85% in 2024. It was also responsible for 33% of the Nonres Bldgs Backlog growth from 2020 to 2025.
Nonres Bldgs has a total 3.7 million jobs and has never increased by more than 150,000 jobs in one year. Manufacturing is 30% of all Nonres Bldgs spending, so we can assume 30% of Nonres Bldgs jobs. That’s 1.1 million jobs supporting just Manufacturing projects. So Backlog of $270bil, at 5000 jobs per billion per year, would need 1,350,000 jobs for a year. With a 1,100,000 jobs share of the workforce, $270billion in backlog would provide support for 15 months. Of course, new starts add to support throughout the year, but the calculation of how long backlog would support that market segment is valuable.
Likewise, Highway/Bridge has 2025 starting backlog of $240billion and represents 30% of Non-bldg Infrastructure spending, so may occupy 30% of Non-bldg jobs, or 345,000 jobs. But Non-bldg work requires fewer jobs, more like 3,000 jobs/bil/yr, so $240 billion at 3000 jobs/billion/year would need 720,000 jobs for 1 year to complete. Therefore, with a pool of only 345,000 jobs supporting highway work, the backlog of $240billion would provide support for 25 months.
Backlog at the beginning of the year or new starts within the year does not give an indication of what direction spending will take within the year. Backlog is increasing if new starts during the year is greater than spending during the year. An increase in backlog could immediately increase the level of monthly spending activity, or it could maintain a level rate of market activity, but extended over a longer duration. In this case, there is some of both in the forecast. It takes several years for all the starts in a year to be completed. Cash flow shows the spending over time.
NEW CONSTRUCTION STARTS
Total construction starts for 2024 are up 5.3%. Residential starts increased 5.7%.Nonresidential Buildings starts gained 2.6% and Non-building Infrastructure starts are up 8.3%.
Total construction starts for 2025 are forecast to increase 3.8%. Residential starts are forecast to increase 6.1%. Nonresidential Buildings starts are expected to gain 2.5% and Non-building Infrastructure starts will be up only 1.6%.
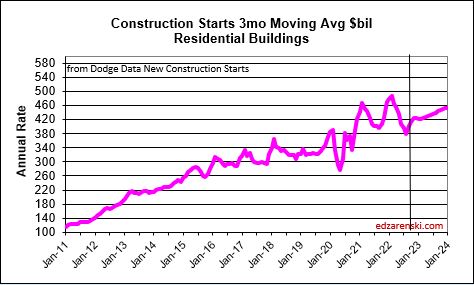
Residential starts increased 5.7% in 2024. Only about 30% of the spending in 2025 comes from 2024 starts. Most of the spending (70%) in 2025 comes from projects that starts in 2025. This is a result of short duration single-family and renovations projects. Residential starts are expected to increase 6.1% in 2025.
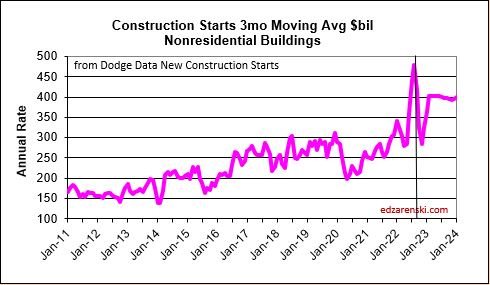
Nonresidential Buildings, starts fell 20% in the 1st half 2023 but still posted the 2nd highest 6-mo average ever. Some of these starts will still be adding to spending into 2025. Nonres Bldgs starts for 2024 gained only 2.6%, due to large declines of 7% to 8% in Manufacturing, Office w/o Data Center and Warehouse, and a moderate 1.2% decline in Commercial / Retail w/o Warehouse. Office w/o Data Center has fallen each of the last 5 years and is down 15% in the last 2 years. Manufacturing starts in 2025 are expected to drop -13%, Office w/o Data Center -4%. Strong growth in new starts in 2025 is expected from Data Centers, Lodging, Healthcare and Public Bldgs (80% of Other Nonres Bldgs). The forecast for Nonres Bldgs new starts in 2025 is +2.5%.
Non-building starts for the 6-mo period Mar-Aug 2023 posted the best 6 months on record, up 30% from the average of 2022. For 2024, Power, Highway/Bridge and Public Works have the strongest gains. These same three markets had the strongest gains in 2023. Power starts are up 22% the last two years. Highway starts are up 19% the last two years. Environmental Public Works are up 29% the last two years and up 50% the last three years. Total Non-building Starts for 2024 are up 8.3%. Non-building starts for 2025 are forecast up only 1.6%.

Data Center starts are up 300% since 2020, up 53% in 2023 and up 44% in 2024, and are expected to increase 27% in 2025. In 2014-2015, Data Centers was less than 5% of total Office+DC construction spending. Today it is approaching 30%. Next year it will approach 40%.
Warehouse starts have dropped 17% in the last two years. Warehouse spending will now slow after climbing 100%+ since 2019. In 2015, Warehouse was 25% of total Commercial spending. By 2022 it had climbed to 54%. In 2025, it will fall back to 45%. But spending will remain near the current level at least for the next three years. Warehouse starts will remain flat in 2025.
Manufacturing starts, the market with the largest $ movement, fell 8.7% in 2024, but still gained 115% from 2019 to 2024. Manufacturing projects can have a moderately long average duration because some of these are multi-billion $ projects and can have schedules that are 4 to 5 years, so some of these projects are still contributing a large volume of spending in 2025. However, as earlier projects begin to taper off, spending will begin to decline.
Manufacturing starts hovered near $80bil/yr from 2014 through 2019. By 2023 new starts had increased to $206bil/yr. Starts fell 9% in 2024 and are predicted to fall by $20bil/yr to $30bil/yr (10% to 15%) over the next three years. Spending is predicted to decline by approx. 10%/yr for the next three years.
Public Works project starts have increased on average 15%/yr for the last four years. Project starts are up 75% in the last four years. Spending is predicted to climb for the next three years.
CURRENT $ SPENDING / INFLATION / CONSTANT $ VOLUME
Volume = spending minus inflation. Spending includes inflation. Inflation adds nothing to volume.
Many construction firms judge their backlog growth by the remaining estimate to complete of all jobs under contract. The problem with that, for example, is that Nonresidential Buildings spending (revenues) increased 14% in 2022, but after adjusting for 12% inflation the actual volume of work was up only 2%. By this method, firms are including in their accounting an increase in inflation dollars passing through their hands. Spending includes inflation, which does not add to the volume of work.
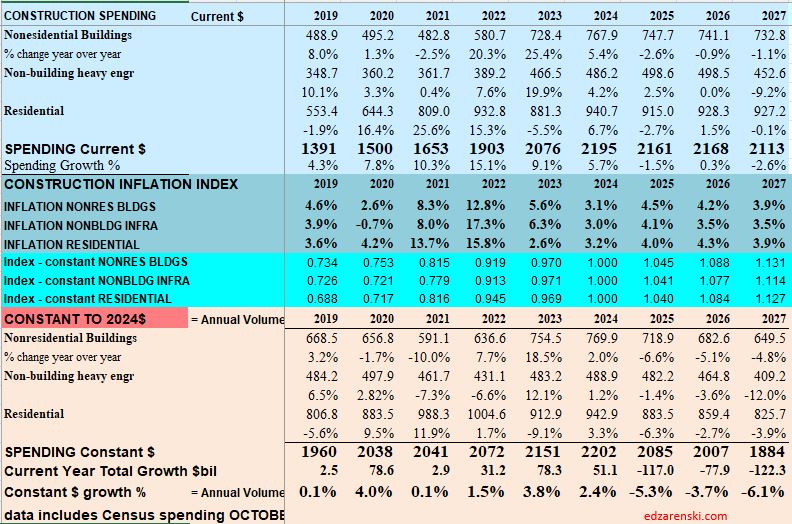
Total volume for 2024 is up 3.1%. Residential +2.7%, Nonres Bldgs +3.3%, Non-bldg +3.5%.
Total volume forecast for 2025 is +1.3%. Residential +2.9%, Nonres Bldgs -1.9%, Non-bldg +3.0%.
Since 2019, spending has increased 55%. Volume has increased only 10%. The difference is inflation.
Inflation adjusted volume is spending minus inflation, or to be more accurate, spending divided by (1+inflation). Inflation adds nothing to volume growth. The following table shows spending, inflation and volume (spending without inflation) for each year. Spending is current to the year stated. The values in the constant table are indexed to a constant value year, now using 2024. This shows business volume year to year, can be a lot different than spending would indicate. When inflation is positive, volume is always less than spending by the amount attributed to inflation.
Caution: the following table, showing Constant$ analysis, now shows Constant$ with base year at 2024. Since Q1-2020 I have used the base year at 2019. This update changes the Constant$ amount, but not the Constant$ percent growth. Slight changes in prior years inflation resulted in some minor changes in Constant$ growth.

Spending during the year is the value of business volume plus the inflation on that volume. When inflation is 12%, volume plus 12% = total spending. Revenue is generally measured by spending put-in-place during the year. Therefore, Revenue does not measure volume growth. In 2022, Nonresidential buildings inflation was 12%, so business volume was 12% less than spending, or 12% less than revenue. Residential volume was 15% less than spending.
Construction spending includes inflation, which adds nothing to the volume of work put-in-place. Construction Volume is a measure of business activity. It eliminates inflation as a variable and shows Constant$ growth. As an example, 2021-22 posted some of the biggest spending increases we’ve seen in 20 years, up over 25% in two years. But, if you look at the bottom row in the table above, we see constant$ growth, or volume, increased only 1.6% in those two years. The inflation rates for those years confirms that almost all of the spending increases were inflation, not added business volume. Construction volume, (spending minus inflation) will finish 2025 up 1.3%, but up only 12% since 2019.

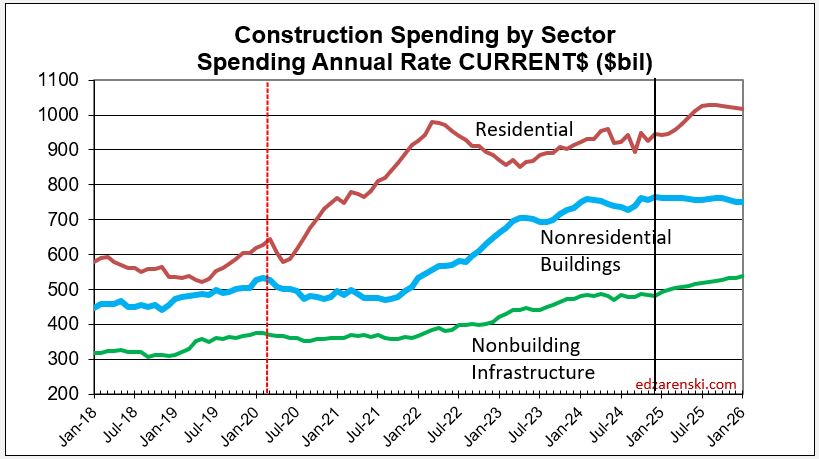
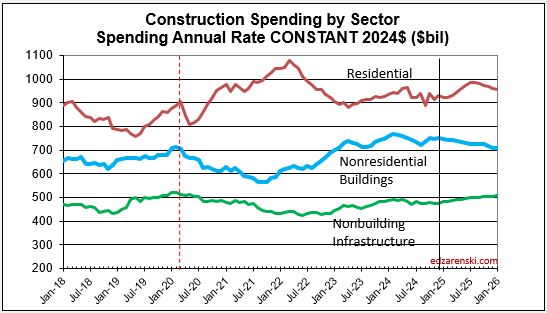
Compare this following Spending by Sector Constant$ plot to the Sector Current$ plot at the beginning of this article.
CONSTRUCTION JOBS
Construction Jobs should not get compared to construction spending. Spending includes inflation, which adds nothing to business volume. Compare Jobs growth to Volume growth. If volume is declining, there is little to no support to increase jobs. And yet, we’ve seen historically that jobs increase at an approximately 3.5%/yr, even when volume does not increase.

Construction Jobs increased 204,000 jobs or 2.5% in 2024. There are currently 8,291,000 construction jobs reported by BLS. The largest annual increase post 2010 is 321,000 jobs (+4.6%) in 2018. The average jobs growth post 2010 is 200,000 jobs per year.
From 2012-2019, we added an annual average 245,000 jobs/yr (+3.9%). From 2021-2024, we added 240,000 jobs/yr (3.1%). In 2024 we added only 204,000 jobs (2.5%). Since 2011, there have been only 3 years in which we added fewer than 200,000 jobs, 2012, 2020, 2021. Also, since 2011, there have been only 3 years in which we added more than 300,000 jobs, 2015, 2018, 2022. Seldom do jobs increase by 400,000 or by 5%/yr. Excluding down years, since 2012, average annual growth is 3.6%/yr.
Here’s an enlarged view of just Jobs/Volume. Removing Spending enhances the vertical scale.

From 2012-2019, we added an annual average 245,000 jobs/yr (+3.9%). From 2021-2024, we added an average of 240,000 jobs/yr (3.1%). In 2024 we added only 204,000 jobs (2.5%). Since 2011, there have been only 3 years in which we added fewer than 200,000 jobs, 2012, 2020, 2021. Also, since 2011, there have been only 3 years in which we added more than 300,000 jobs, 2015, 2018, 2022. Seldom do jobs increase by 400,000 or by 5%/yr. Excluding down years, since 2012, average annual growth is 3.6%/yr.
January jobs report shows we added 4k jobs in Jan, but the unemployment rate went up from an average 4.7% in Q4 2024 (5.2% in Dec), to 6.5% in Jan.
3-7-25 Construction gained 19k (+0.2% mo/mo) jobs in Feb, BUT total hrs worked fell -0.3%. Total jobs have increased but hrs worked has gone down in each of the last 5 months. We’ve posted minor jobs gains in both Jan and Feb, and yet unemployment has gone up from 5.2% in Dec to 7.2% in Feb.
The unemployment rate in construction goes UP in the 1st qtr every year, by at least 2% to 3% (data since 2011). Now, your 1st thought may be, if unemployment is increasing, that is probably because jobs are falling. Well, construction has ADDED jobs in the 1st qtr. every year since 2011 (excluding 2020), by an avg of nearly 30% of all jobs added annually. Construction unemployment is not going up in winter months because we lose jobs in winter. So how can the unemployment rate still go up? The numerator (jobs) is increasing. There’s only one number left in the equation, the denominator (workforce). The result goes up because the entire workforce increases. In this case, the workforce is increasing by greater than the number of jobs added. So, when the unemployment rate increases in Q12025, don’t assume it is because we are losing jobs.
The plot below shows how consistent jobs growth has been over the last 14 years. After the 2020 dip, the slope (annual rate of growth) of jobs growth is about the same as Jan2011-Jan2020. Jobs increase at about 3.5%/yr to 4%/yr., regardless of what volume is doing. In fact, since 2016, the last time volume increased by more than 4%, jobs are up 22%. Volume is up only 11%.

Since Jan 2011, average jobs growth is 3%/yr. Average volume of work growth since 2010 is 2.3%/yr. This plot above shows Jobs and Volume growth closely match from 2011 to 2018. With few exceptions for recession periods, this pattern can be seen throughout the historical data.
What’s remarkable about the growth is this; since 2016, spending has increased 77%, volume after inflation increased only 11% and jobs increased 22%. Volume and jobs should be moving together.
It takes about 5000 (Nonres) jobs to put-in-place $1 billion of volume in one year. It could easily vary from 3000 to 5000, depending on the type of work. So, on average, an add of $100 billion+ of Nonres Bldgs in one year would need 500,000 new jobs. Jobs should track volume, not spending growth. Volume = spending minus inflation. Normal construction jobs growth is about 250,000 jobs per year and maximum prior annual growth is about 400,000.

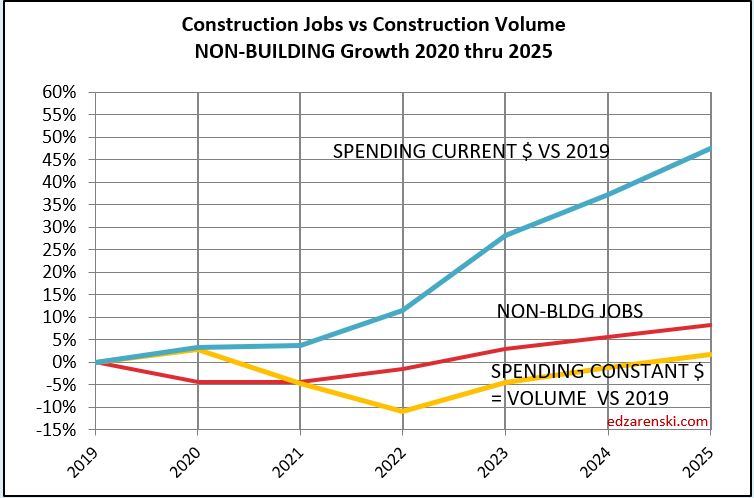
Non-building, over the next two years, could experience the same kind of growth spurt as Nonres Bldgs., a forecast increase in volume the next two years without an equal increase in jobs. Volume which was lower than jobs since 2021, is now increasing faster than jobs. Non-bldg volume is forecast up 6% to 8%/year the next 3 years. Jobs increase at an avg. 3.5%/year.
Residential volume has exceeded residential jobs all the way back to 2011. The recent decline in volume brings the two even, if the jobs hold the pace.

For as long as I can remember, the construction industry has been complaining of jobs shortages. And yet, as shown in the data mentioned above, jobs have increased greater than volume of work. With an exception for recession years, (2007-2010 and 2020), jobs increase at a rate of 2.5% to 3% per year. The greatest disparity between jobs and volume occurred in late 2022, when jobs growth had already resumed normal pace, but volume of work was still reeling from the effects of new construction starts that were canceled dating back to late 2020 and early 2021. Recent volume growth at a much faster rate than jobs growth is now closing the gap.
For the 4yr period 2021 thru 2024, jobs are up 13%, but volume of work put-in-place is up only 6%.
Don’t be surprised if 2025 construction jobs growth slows a bit. Jobs are slightly ahead of volume growth, particularly in the Non-building Infrastructure sector. Since 2019, both Jobs and Volume increased 10%. But that includes 2020, when volume increased 4% but jobs fell by 250k, or 3%.
When jobs increase without an equal increase in the volume of work, productivity declines. This recent increase in volume and the projected increase in volume in 2024, several points stronger than jobs, will offset some of the disparity which has been negative for a long time.
The Harvard Joint Center for Housing Studies recently posted that In Texas, California, New Jersey, and the District of Columbia, immigrants make up more than half of construction trade workers. This analysis will make no effort to discuss the potential impact of immigrants in the workforce, but we must recognize the makeup of who is filling these jobs. Keep in mind after this analysis reaches some conclusions that this aspect may weigh heavily on the outcome.
INFLATION
To properly inflation adjust the cost of construction, use a Final Cost Inflation Index.
General construction cost indices, that do not address labor, productivity or margins and Input price indices, don’t reflect whole bldg final cost and therefore do not capture the full cost of escalation in construction.
Final cost indices represent total actual cost to the owner and are usually higher than general indices. Producer Price Index (PPI) INPUTS to construction reflect costs at various stages of material production, may not represent final cost of materials to the jobsite and do not include labor, productivity or margins. That’s why a PPI Inputs index +20% for a material could be only a +5% final cost. PPI Final Demand indices include all costs and do represent actual final cost.
Construction Analytics Building Cost Index is a weighted average of eight final cost indices.
The following Construction Inflation plot (for Nonresidential Buildings only) shows three elements: 1) a solid grey bar reflecting the max and min of the 10 indices I track in my weighted average inflation index, 2) a solid black line indicating the weighted average of those 10 indices, and 3) a dotted red line showing the Engineering News Record Building Cost Index (ENR BCI). Notice the ENR BCI is almost always the lowest, or one of the lowest, indices. ENR BCI, along with R S Means Index, unlike final cost indices, do not include margins or productivity changes and in the case of ENR BCI has very limited materials and labor inputs.

The solid black line (above) represents the Construction Analytics Building Cost Index for Nonresidential Bldgs and is a final cost index.
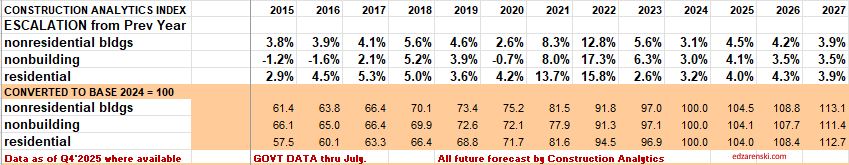
This short table shows the inflation rate for each year. Useful to compare to last year, but you would need to mathematically do the compounding to move over several years. The plot below shows the cumulative inflation index, or the cumulative compounded effect of inflation for any two points in time.
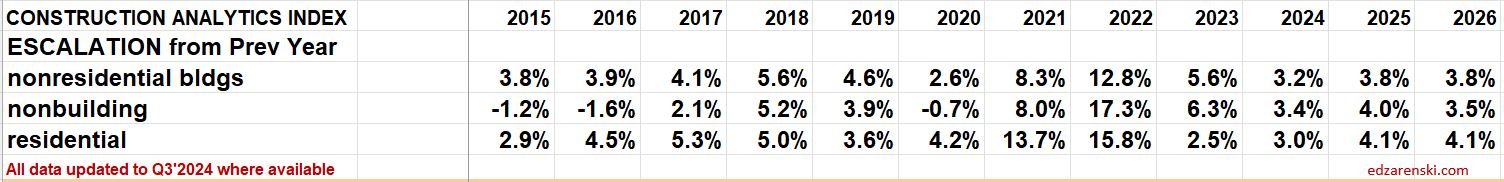
30-year average inflation rate for residential and nonresidential buildings is 4.1%. But when excluding deflation in recession years 2008-2010, for nonresidential buildings the long-term average is 4.7% and for residential is 4.9%. For Non-bldg Infrastructure the 30-year average is 3.6%. When excluding deflation in recession years 2008-2010, Non-bldg long-term average inflation is 3.9%.
Since 2011, Nonres Bldgs inflation is 4.8%, Residential is 5.4% and Non-bldg is 4.3%.
Reference Inflation Data Construction Inflation 2024

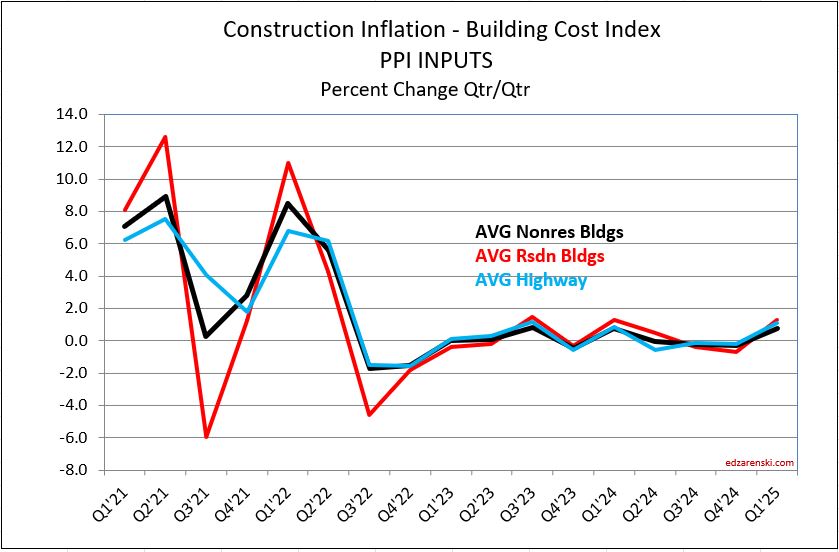
Construction Analytics Nonres Building Cost Index is a weighted average of eight final cost indices. It is compared below to the PPI Inputs (not final cost) and PPI Final Demand (yes final cost).

Final cost indices represent total actual cost to the owner and are usually higher than general indices.
Producer Price Index (PPI) INPUTS to construction reflect costs at various stages of material production, generally do not represent final cost of materials to the jobsite and do not include labor, productivity or margins. Even with that, a PPI Inputs index +20% for a material could be only a +5% final cost. PPI Final Demand indices include all costs and do represent actual final cost.
We can’t always tell what affect changes in the cost of construction materials will have on the final outcome of total construction inflation. PPI materials index does not account for productivity or margins and varies on stage of input.
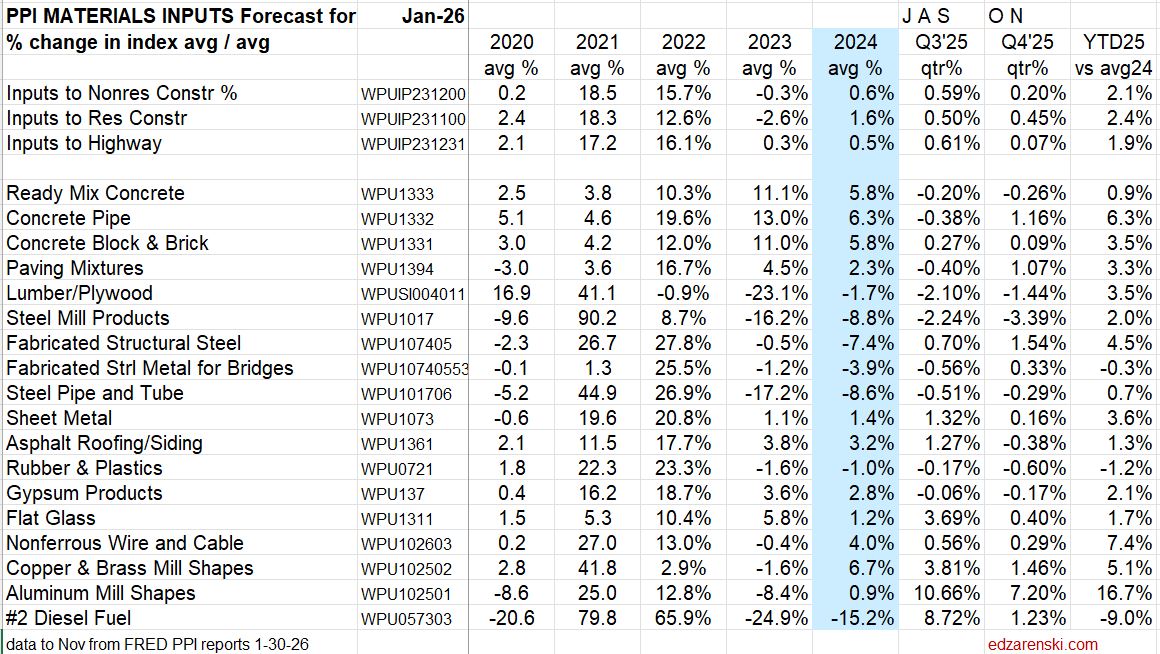
Jan’25 Inputs are up, +0.8% to Nonres, +1.2% to Residential and 1.2% to Highway, the largest increases since Jan’24. The largest Input item increases in January are Paving Mixtures (up 14.6%), Diesel Fuel (up 3.6%), Concrete Brick, Block & Pipe (up 2.2%), Copper & Brass Shapes (up 1.9%) and Flat Glass (up 1%). Steel Pipe & Tube is down 1.3%. Both Lumber/Plywood and Fabricated Structural Steel are down 0.5% or less.
The PPI Final Demand index (for Nonresidential Bldgs only) is one of several that does account for labor and margins, hence it is defined as a final cost index. In this plot, Jan’25 closes out Q4’24. Total growth in 2024 was only 0.4%.

A Check on Measuring Methodology
And finally, here’s one of the markers I use to check my forecast modeling, my forecasting performance tracking index. The light plot line is forecast predicted from my modeling. The dark plot line is actual construction spending. Even after any separation in the indices, the plots should move at the same slope. Almost without fail, the forecast model, estimated spending from cashflow, predicts the changes in direction of actual spending. The nonresidential buildings plots (and the residential plot prior to 2020) are remarkably close, providing an indication the method of analysis employed, cash flow of all construction starts to get spending forecast, is reasonably accurate.

Note the divergence of residential in Jul-Dec 2020. Actual residential spending finished much higher than predicted. Even the cash flow from an all-time high in new residential starts does not predict spending to increase so rapidly. But residential project spending was fully back to prior levels by August 2020, within 3 months from the May 2020 bottom. In 3 months, the actual spending pushed 15% higher than starts predicted. A part of the spending was the resumption of delayed projects, but another big part was renovations, which surged, and reno is 40% of all residential spending.
Construction Inflation 2025 – 2-21-25 PPI data, INDEX TABLES, Inflation History
Construction Briefs – As We Begin 2025 jobs and unemployment, PPI and tracking edz
Construction – Brief Thoughts Dec’24 thoughts on jobs and when spending mega ends
Compare 10 Construction Forecasts Jan 2025 Jan and Midyr Forecasts compared to actual at end of yr
The Next Forecast Challenge written Apr 2023. Nonres volume did climb much faster than Jobs.
This analysis does not take into consideration the inflation impact of a recession or significant new tariffs. Nor does it assume losing any portion of the workforce to deportation. These are all possible. Construction starts may be negatively affected, and if so, then construction spending will also be affected. Some business will be negatively affected. All will lead to higher inflation.
You can print the Summary report by selecting/printing just the first 5 pages.

Construction Data Briefs APR 2023
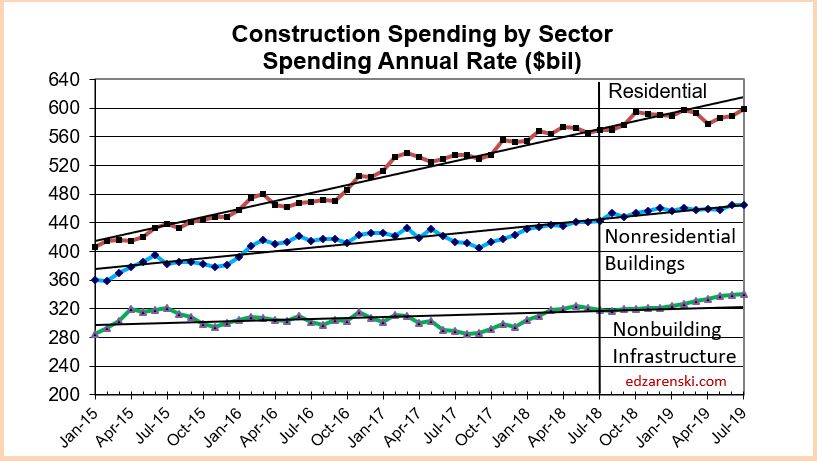
Construction is booming. Nonresidential buildings is leading growth. For the first two months of the year, total construction spending year-to-date (ytd) is up 5.9%, but nonresidential buildings spending is up 23% ytd, the fastest rate of nonres bldgs growth in over 20 years. Nonresidential buildings annual rate of spending has increased 19% in the last six months. Nonbuilding spending ytd is up 8%. Nonbuilding annual rate of spending increased 10% in the last four months. Residential spending peaked in March 2022. Since then the annual rate of residential spending has dropped 11%.
Total Construction Spending in 2023 is now forecast to reach $1,894 billion, an increase of 5.3% over 2022.
Nonresidential Buildings spending in 2023 is now forecast at $629 billion, an increase of 20.3% over 2022.
STARTS
The rate of construction spending in 2023 will be influenced predominantly by a 40% increase in new nonresidential building starts in 2022. In recent years, new nonres bldgs starts averaged $300 billion/year. In the 2nd half of 2022, starts averaged over $500 billion/year. Many of those projects will have peak spending in 2023. Some will occur in 2024.
Residential construction (Dodge) starts posted the five highest months ever all in the 1st 6 months of 2022. In the second half of 2022, residential starts fell 15%. In Jan and Feb 2023, starts dropped another 20% below 2nd half 2022. Starts are now down 25% in 12 months.
Nonresidential Bldgs starts in 2022 posted the largest ever one-year increase in new nonresidential buildings construction starts, up 40%. Starts were also up 15% in 2021. Nonres Bldgs new starts in the 2nd half 2022, averaged 67% higher than any other 6mo period in history.
Growth in Manufacturing construction starts for 2022 far surpasses growth in any other market, up over 150%. Office is up 36% (datacenters), Healthcare up 17%, Comm/Rtl up 23% (warehouses).
Non-building starts increased more than 100% in July 2022. The 2nd half 2022 was up 50% over 1st half 2022. Starts for 2023 are forecast up 15%. For 2022, Highway up 25%, Transportation up 45%, Power up 30% and Public Works up 15%.

SPENDING FORECAST
Construction Spending through February 2023 is up 5.9% ytd. Spending is forecast to finish 2023 up 5.3%.
While residential falls back nearly 7% in 2023, Nonresidential buildings is leading with a forecast of 20% spending growth.
Total construction spending for 2023 is on track to increase +5.3%. Residential -6.7%, Nonres Bldgs +20.3%, Nonbldg +13.5%.

SPENDING BY SECTOR CURRENT $ AND INFLATION ADJUSTED CONSTANT $
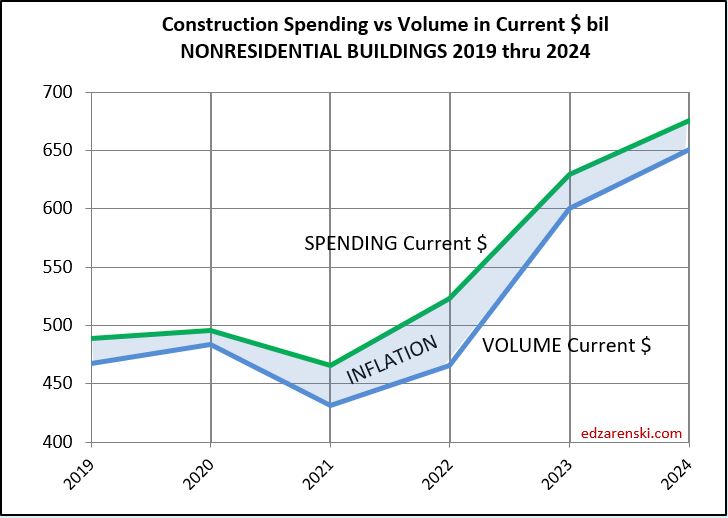
In 2023, it’s Nonresidential Buildings leading growth. In 2024, it will be Nonbuilding Infrastructure leading spending growth. Both are expected to grow greater than the inflation index.
See also Construction Spending Outlook – Feb 2023

Current $ Spending, Inflation and Volume SEE Construction Inflation 2023
Inflation adjusted volume is spending minus inflation, or to be more accurate, spending divided by (1+inflation). The following table shows spending, inflation and volume (spending without inflation) for each year. All $ are current to the year stated. This table shows that inflation adds nothing to volume growth. All values in this table are current to the year stated. The values in this table are not indexed to a constant value year. This is an attempt to show that business volume in any given year is not as high as spending would indicate. When inflation is positive, volume is always less than spending by the amount attributed to inflation.

Spending during the year is the value of business volume plus the inflation on that volume. When inflation is 12%, volume plus 12% = total spending. Revenue is generally measured by spending put-in-place during the year. In 2022, Nonresidential buildings business volume was 12.2% less than spending, or less than revenue. Residential volume was 15.7% less then spending.

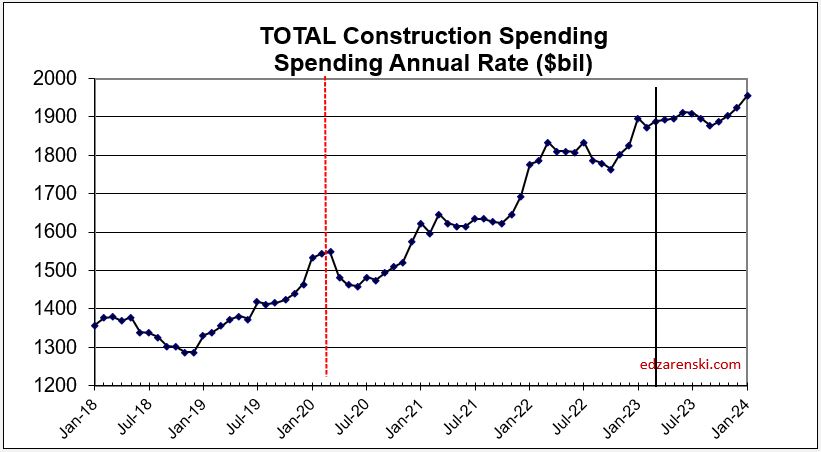
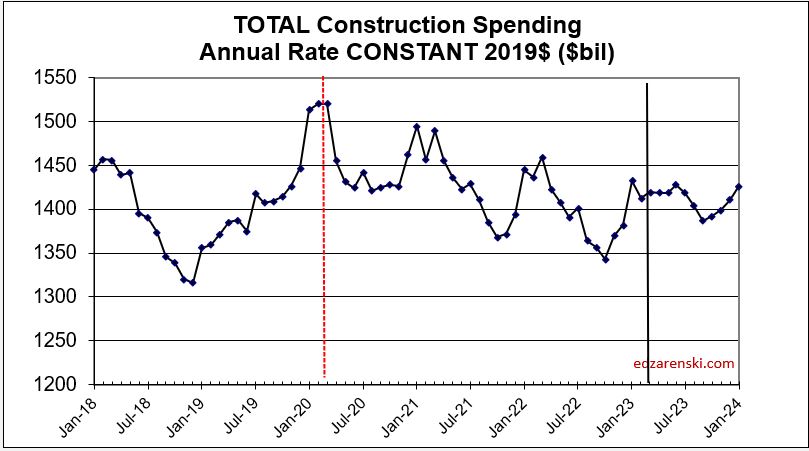
SPENDING TOTAL CURRENT $ AND INFLATION ADJUSTED CONSTANT $
Overall Construction Spending is up 22% in the 36 months since the onset of the pandemic, but, during that same period inflation increased 31%. After adjusting for 31% inflation, constant $ volume is down 7%. So, while the plot on the left shows three years of increases in spending, the actual change in business volume is still down and has not yet returned to the pre-pandemic peak in Feb-Mar 2020.
NONRESIDENTIAL SPENDING (CURRENT $) AND VOLUME (CONSTANT $)
Nonresidential Buildings spending in 2023 is forecast at $629 billion, an increase of 20.3%, or $100 billion and add another $50 billion in 2024.
In 2022 we realized the largest ever one-year increase in new nonresidential buildings construction starts, up 40%. Starts were also up 15% in 2021.
The AIA Consensus Construction Forecast, December 2022 predicts only a 5.8% increase in spending for nonresidential buildings in 2023. My beginning of year forecast for comparison was 15.8%. My current forecast is +20.3%.
We began the year with record new starts indicating an increasing spending rate. The monthly rate of spending is up 12 of the last 14 months, has increased for 6 consecutive months and is up 20% in the last 6 months. The rate of spending is predicted to increase 10 out of 12 months in 2023, a total increase of 11% over the year. Barring any unforeseen negative occurrence, the trajectory in the rate of spending is increasing.
Year-to-date nonresidential buildings spending for Jan+Feb is up 23%. This is driven by Manufacturing, up 53% ytd, but also supported by Lodging up 38% ytd and Commercial/Retail up 23% ytd. Every nonresidential building market except Educational (up only 8%) is up greater than 10% ytd.
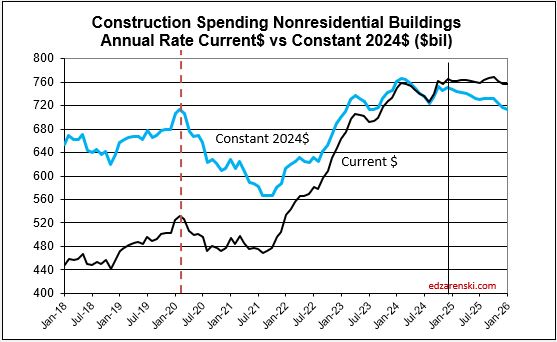
Nonresidential buildings spending fell 17% from March 2020 to Sept 2021, then increased 36% from Sept 2021 to Feb 2023. Currently, as of Feb 2023, spending is 14% higher than the pre-pandemic peak in Feb 2020. But nonresidential buildings inflation over that same 36 months increased 26%. Business volume in constant $ actually fell 25% from Feb 2020 to Sept 2021, and hit a secondary low in mid-2022. Since then, the actual change in business volume has increased 18%, but that still leaves volume nearly 10% lower than the pre-pandemic high.
Non-building Infrastructure spending for 2023-24 is forecast up 25%, up $50 billion/year for two years. Non-building Infrastructure will post the 1st year of sizable gains since 2019, forecast at $415bil, up 13.5% in 2023. In 2022, Highway and Public Utilities posted strong gains of 9.1% and 16.6%, but those gains were offset by a 8.7% decline in Power. For 2023, Highway and Transportation recorded the strongest starts in five years. All markets post spending gains in 2023, with Highway up 26%, Transportation up 9% and Public Utilities up 8%.
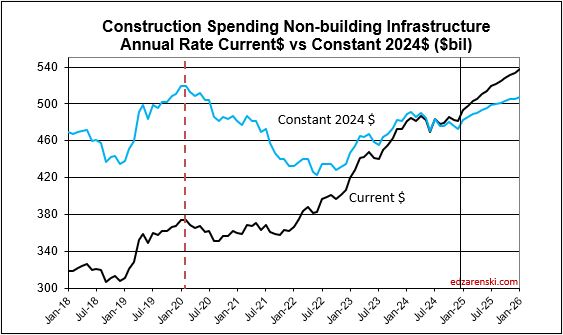
Non-building Infrastructure spending is up 4% in 36 months since Feb 2020. After adjusting for 26% inflation, constant business volume is down 17%.


RESIDENTIAL SPENDING SF-MF-RENO CURRENT $ AND CONSTANT $
Residential starts are forecast down or flat in 2022 and 2023. Spending grew 44% in the last 2yrs, but inflation was 30% of that 44%. With no growth in starts forecast for 22-23, spending will struggle to keep up with inflation. Residential spending is forecast to fall 7% in 2023. Most of the decline is single family. Single family is down a total of 23% over 10 consecutive months. Multifamily is up 22% over 13 consecutive months. Renovations gained 25% in 2022 but spending varies +/- 10% throughout the year. Midyear there is potential for 6 consecutive down months in residential spending.


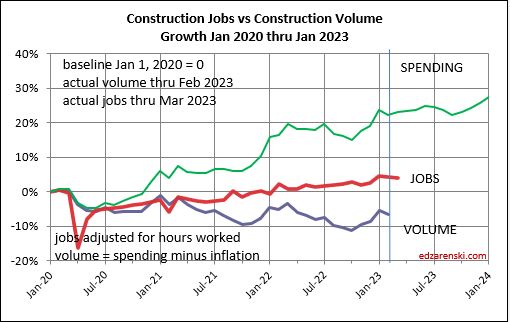
DOES VOLUME OF WORK SUPPORT JOBS GROWTH? or, Can jobs growth support volume of work?
Jobs should track volume, not spending growth. Volume = spending minus inflation. Volume is down, although now increasing, while jobs are up. Nonres Bldgs volume, in constant $, fell 25% from Feb 2020 to Sept 2021, and hit a secondary low in mid-2022. Since then, the actual change in nonres bldgs volume has increased 18%. Yet nonres bldgs jobs increased only 3.5%. That still leaves volume nearly 10% lower than the pre-pandemic high. If the same production levels ($ put-in-place per worker) as 2019 were to be regained, theoretically, nonresidential volume would need to increase 10% with no increase in nonresidential jobs. For now, productivity is well below that of 2019.
Nonresidential Buildings spending in 2023 is forecast at $629 billion, an increase of 20.3%, or $100 billion and another $50 billion in 2024. Non-building Infrastructure spending for 2023-24 is forecast up 25%, up $50 billion/year each year.
This growth amounts to an increase of $150 billion in 2023 and $100 billion in 2024. It takes 5000 jobs to put-in-place $1 billion. So $100 billion in 2024 would need 500,000 new jobs. 2023 would need 750,000 new jobs.

If we were to grow the labor force to meet the newly identified workload added from new starts, we would need to double the prior maximum rate of construction jobs growth. Normal growth is about 250,000 jobs per year and maximum prior growth is about 400,000. The workload discussed above would require 750,000 + 500,000 new jobs back to back. That’s an expansion of the industry by 15%, in an industry that normally grows 3%/yr. This industry can’t grow that fast. (Which means I need to account for over-capacity growth as a potential reduction in future forecast. You can’t increase spending that fast if you can’t expand the industry that fast).
4-16-23 update- Everything forecast above is predicated on the normal cash flow of forecast new starts. As of yet, this forecast has not been reduced to reflect the inability of the industry to expand jobs fast enough to absorb the volume of spending generated from forecast starts. Whether new starts get canceled or delayed, spending needs to be reduced annually for at least the next two years simply because jobs cannot increase fast enough to put-in-place the forecast spending. This impediment needs to be accounted for and could reduce overall construction spending forecast by approximately $40-$60 billion in 2023 and $25-$40 billion in 2024. The most likely markets where a reduction would occur are Manufacturing, Highway, Commercial/Retail and Office.
SEE more discussion on Volume and Jobs
here 2023 Construction Volume Growth
and here Infrastructure Construction Expansion – Not So Fast
2021 Construction Economic Forecast – Summary
Initial Construction Outlook 2021, 2-5-21, based on data from:
- Actual Jobs data includes BLS Jobs to Jan 16th, issued 2-5-21
- Forecast includes US Census Dec 2020 year-to-date spending as of 2-1-21
- Forecast includes Dodge Outlook 2021 and Dec construction starts 1-19-21
SUMMARY – CONCLUSIONS
Construction Spending drives the headlines. Construction Volume drives jobs demand. Volume is spending minus inflation. Current outlook shows the most recent peak volume was 2017-2018. Total Volume is forecast to decline every year out to 2023, but Residential is rising, Nonresidential is falling.
When spending increases less than the rate of inflation, the real work volume is declining. Nonresidential buildings spending for 2020 is down -2%, but with 3% to 5% inflation, volume is down 5% to 7%. The extent of volume declines would impact the jobs situation.
STARTS – BACKLOG – SPENDING
By far the greatest impact of the pandemic on construction is the massive reduction in new nonresidential construction starts in 2020 that will reduce spending and jobs in that sector for at least the next two years. Residential continues to increase.
- 2020 new starts declined -8%. Res +7%, Nonres Bldgs -24%, Nonbuilding -14%.
- New starts for residential reached an all-time high in 2020. Expect up +5% in 2021.
Nonresidential construction starts in backlog at the beginning of the year provide for 75% to 80% of all spending in 2021. New starts in 2020 were down 24% for buildings and 14% for non-buildings, so backlog is down. It would be difficult to show any scenario that has these sectors up in 2021.
Construction has yet to experience the greatest downward pressure from the pandemic. After hitting a post-pandemic spending high in December, spending and jobs losses won’t hit bottom until 2022. Nonresidential declines outweigh Residential gains.
- Spending forecast for 2021 is up +1.4%, but nonresidential buildings is down -11%.
- Almost all gains in spending are due to large 12%/yr gain in residential.
The largest declines in 2021 spending are Lodging -37%, Amusement/Recreation -26%, Manufacturing -19% and Power -15%.
PROJECT COST ESCALATION – INFLATION
- Inflation for nonresidential buildings near 4% the next few years. Residential 5% to 6%.
VOLUME – JOBS
Construction Jobs annual average for 2020 is down 220,000 jobs. The current spending forecast is indicating that December 2020 was the highpoint for jobs. Residential jobs will be up in 2021, but Nonresidential Buildings jobs are down steep. Net jobs will be down 15 of next 18 months. Forecast 2021 net annual average jobs losses of -200,000. Nonresidential Buildings 2021 jobs losses will outweigh residential gains.
Selected slides from Feb 2021 Construction Outlook Presentation
EdZ Econ Feb 2021 SAMPLE SLIDES PDF
Read More 2021 Construction Economic Forecast

Construction Analytics Voted Best Construction Blog 2019
Ed Zarenski’s Construction Analytics blog
won the 2019 Best Construction Blog competition.

“Sometimes patience and quality count more for success than razzle dazzle and pushy marketing. These observations seem appropriate for the 2019 Best Construction Blog winner, Ed Zarenski’s Construction Analytics.”
“His blog’s uniqueness and success results from its detailed analysis and data about the construction economics topic, including forecasts and projections — with a Google search leadership relating to construction inflation.”
“Zarenski’s blog, effectively, provides a solid overview of the construction industry’s economic picture. That knowledge is useful for contractors, suppliers and professionals seeking to benchmark performance and plan their business’s future based on industry-focused but larger economic trends.”
Construction Analytics wins 2019 Best Construction Blog competition

Who Reads Construction Analytics?
Construction Analytics provides in-depth and unique analysis and future forecasting of construction data valuable to a wide variety of users. Construction Analytics data has been referenced by construction firms, university graduate studies, real estate firms, online educators, investment firms, school district planning boards, public agencies for developing infrastructure budgets and news agencies around the country.
Construction Analytics has consulted for and provided special reports and presentations to Construction firms, real estate developers, national construction organizations and industry conferences.
National agencies, universities, construction firms and conference planners have reached out to Construction Analytics for presentations to large and small groups. A sampling of some construction economic presentations: American Institute of Architects; Associated General Contractors; Project Management Institute; McGraw Hill Construction; Georgia Tech Civil Engineering; Worcester Polytechnic Institute Civil Engineering; Hanson-Wade Advancing Building Estimation Conference.
Construction Analytics has appeared in interviews by Bloomberg TV and ConstructechTV and has been widely quoted in Bloomberg News, Washington Post Business, WaPo Fact Checker, Financial Times, CNBC, Marketwatch Economy, Newsweek, Los Angeles Times, Ontario Construction News, strategy+business, Yahoo!Finance, STEEL Market Update, BuildingConnected, Constructiondive, BuildZoom and a host of other blogs and news sources.
Contact:
Construction Analytics
Ed Zarenski
edzarenski@gmail.com

Construction Spending July 2018
9-4-18
U. S. Census posted Construction Spending for July at a seasonally adjusted annual rate (SAAR) of $1,315 billion, up only 0.1% from May.
Year-to-date, July construction spending is up 5.2% from the same period in 2017.
June was revised down slightly, -0.2%, and May was also revised down, -0.6%, but May remains up 1.7% from the 1st May release.
Here’s the link to the Sept. 4 release of July data
Construction Spending for the 1st 7 months of 2018, in Current $, by Census formulas averages $1,306 billion. By my formulas the 1st 7 months average stands at $1,321 billion. Either way, this is an all-time high, well above the pre-recession high spending of $1,205 billion posted in the 1st quarter of 2006. Spending has been above the 2006 high since the 4th quarter 2016, but since 2006, no other 6-month period has averaged above $1,250 billion. Spending is expected to total $1,335 billion for 2018.
Constant $ shows volume reached peak during the 2nd half 2005 and 1st half 2006, with 2005 posting the peak year. 2018 constant $ inflation adjusted spending is still 14% below the 2005-2006 peak.

Total spending year to date through June is $740 billion. Historically, 56% of annual spending occurs in the 1st 7 months. Jan, Feb and Mar are the weakest months of the year, while Jul, Aug and Sep are the strongest spending months. This would indicate a 2018 total annual spending of $1,321 billion, 1% less than my forecast.
Top performing construction spending markets 2018 year-to-date through July are Transportation +15.8%,Water Supply +14.1%, Public Safety +13.1%, Conservation 10.3%, Lodging +10.1%, Sewage and Waste Disposal +9.1%, Residential +7.6% and Office 7.2%.
The only markets down year-to-date are Religious -11.8% and Manufacturing -7.5%. Religious building as a percent of total is so small (1/4 of 1%) it has negligible effect on total annual performance. However, Manufacturing is about 5% of total construction.
Residential, Office, Commercial/Retail, Lodging, Highway and Environmental Public Works (Sewage, Water, Conservation) are all ahead of my expectations for the 1st half of 2018.
Last month, June construction spending showed an unusual $9 billion (SAAR) monthly decline (-9.3%) in Educational spending. At that time I said, “This is several billion greater than the largest decline reported during the recession, so this looks like an anomaly in the data. There has never been a monthly decline like this in the Educational market since I’ve been tracking data, back to 2001. It is double the largest non-recession decline. I expect it will be revised up substantially at some point in the future.” That anomaly in the June data was revised up this month, erasing about half of the decline that was first reported.
Transportation is another market that appeared to be unusually low for June. Last month I said this, “Transportation (terminals and rail) new starts in 2016 increased 34% and then in 2017 increased 120%. Even with long duration cash flow spreading out the spending for big projects, my analysis still predicts Transportation spending up 30% in 2018. Year-to-date through June, Transportation spending is up only 14%. I’ve forecast it should be up 18%. That’s a total shortfall of about $1 billion (SAAR ~$12 billion), or about 7%/month, for 3 months. April, May and June spending are all below expectations.” In the July data, both May and June spending were revised UP by a total of $2 billion. With that revision Transportation spending is up 18% YTD through June, as expected.
Manufacturing spending as of June was reported down 8.7% year-to-date from 2017. Spending through July is now down only 7.5%. I previously reported that I expect the decline to slowly turn positive in the second half of the year to finish up 2%. Spending is currently at an SAAR just above $66 billion and expected to increase to $70 billion by December. In 2017, spending started the year above $70 billion but decreased to $60 billion by year end. Increasing values in the 2nd half 2018 compared to decreasing values in 2017 will continually increase the year-to-date performance in the 2nd half of 2018.
Power, similar to manufacturing, posted the highest spending for 2017 early in the year, then declined. In 2018, the 1st half posted the lowest spending, so the year-to-date is currently low. Increased spending in the 2nd half 2018, compared to the lowest values of the year in 2017, will boost year-to-date spending every month through year end. Although year-to-date spending through July is up only 0.7%, I expect the total for the year will finish up 8%.
Manufacturing and Power highlight one of the biggest shortfalls of judging expected performance based on year-to-date change. It is important to look at the trend line expected in the current year versus the trend line in the previous year. If they diverge, then year-to-date change will not give a clear indication of expected performance in the current year. Manufacturing data as an example follows. Note, SAAR data shows performance trend but NSA$ is needed to get YTD$.

![]()
Public spending increased 5% in 2015, but has been depressed since since 2009. 2017 finished still 7% lower than 2009. For 2018 we should see a gain of $16 billion, +5.7% over 2017 to $308 billion, the highest finish since 2009. Highway and Street is the largest share of public work, but adds very little to 2018 gains. Educational spending makes up about 25% of all public spending gains. Public Works (Sewage/Waste Water, Water Supply and Conservation), only 14% of all public spending, accounts for about 25% of the gains this year. Public Transportation, at only 12% of public spending, accounts for $8 billion in increases in public spending, half of all the gains in public spending this year.
Total spending has increased from an average of $1,254 billion in Q4’17 to $1,292 billion in Q1’18 to $1,321 billion in Q2’18, growth of 3.0% and 2.25% the last two quarters. I’m expecting the rate of monthly spending will be above $1,360 billion by year end. The total spending forecast for 2018 is $1,335 billion.
Residential single family spending is up 8.5% YTD. Multifamily is down 0.9%. Total residential spending is forecast to reach $570 billion in 2018, growth of 7.2% over 2017.
Nonresidential Buildings spending YTD totals $246 billion, up only 1.7% from 2017. It is being held down by Manufacturing which is currently down 7.5% from 2017. 2018 forecast is $445 billion, 6.1% growth over 2017, with best growth in Lodging 13%, Office 11% and Amusement/Recreation 9%.
Non-building Infrastructure will post the best year of growth since 2014 to reach a new all-time high at $308 billion. Transportation, by far, will show the best growth, 25% above 2017.
Cash flow from backlog supports a 2018 spending forecast of $1,335 billion, a spending increase of 7.2% over 2017. The forecast for 2019, based on a modest 3% increase in new starts in 2019 is $1,400 billion, an increase of 5% over 2018. The strongest growth in spending for 2018 and 2019 is forecast to occur in Non-building Infrastructure with Transportation being by far the strongest market.
July Construction Starts Fall but 3moAvg at New High
Construction Spending June 2018
June Construction Starts Reach New Highs

2018 Construction Spending Forecast – Mar 2018
3/15/18
Preliminary data is in for total year 2017 construction spending, 2017 construction starts and 2018 starting backlog. The following forecast is developed using the current data.
2018 Construction Spending Forecast – Mar 2018
A brief note on 2017.
2017 Spending Wrap Up
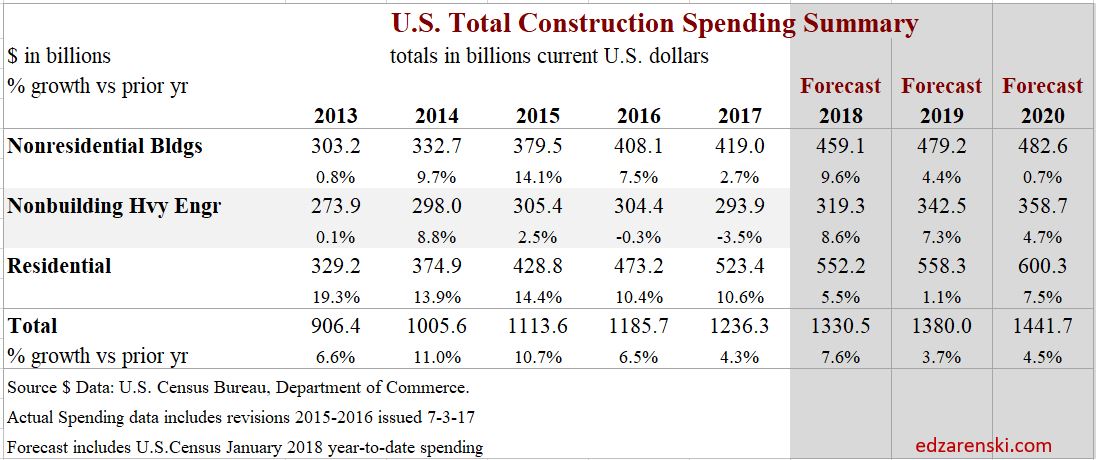
Total construction spending in 2017 now stands at $1.233 trillion, an increase of 4.0% over 2016.
Residential spending, up 10.5% for the fifth consecutive year above 10% growth, leads all construction spending in 2017 for the seventh consecutive year. Nonresidential Buildings finished the year up 2.3%. Only Non-building Infrastructure did not improve over 2016, down 3.8% for the year. However, Non-building Infrastructure had been at an all-time high for the previous two years.
2017 spending finished below my forecast due to performance in Educational, Office, Power and Highway, four of the five largest markets which together make up half of all nonresidential spending. All came in lower than forecast. However, some of these markets are prone to very large post-annual upward revisions and that has the potential to add to 2017 spending when those revisions are released in July 2018. For instance, in the July 2017 revisions, Power spending for the previous year, 2016, was revised up by 10%.
History shows spending has been revised up 53 times in the last 60 months. I expect to see future revisions smooth out spending in unusually low periods and increase total 2017 spending above this forecast. Both April and July preliminary spending appear statistically too low. The average post-annual total spending revision for the last five years is +2.8%. The post-annual revision to 2016 was only 2.2%. Revisions due for release on July 1, 2018, if even only a +1% revision to 2017, would adjust total 2017 spending up to $1,245 billion. This would slightly alter the 2018 forecast.

2018 Spending Total All Construction
Total All 2018 construction spending is forecast to increase 7.6% to $1.330 trillion.
Nonresidential Buildings spending forecast for 2018, up 9%, will be supported by Manufacturing and Educational. Non-building Infrastructure returns to strong growth of 8%, with potential to hit a new all-time high due to very large projects in Power and Transportation. Residential spending in 2018 slows to growth under 6% after six years all over 10%/year.
Dodge Data 2017 construction starts increased 3% from 2016. However, starts are always revised upward in the following year. I expect revisions will show 2017 starts increased by more than 6% over 2016. Even with that revision, 2017 starts posted the lowest growth since 2011, weighted heavily by the slowdown in residential starts.
Total starting backlog for 2018, currently at an all-time high, has increased on average 10%/year the last three years. 80% of all Nonresidential spending within the year will be generated from projects in starting backlog. Public share of new construction starts are up only 10% in 3 years. But due to long duration job types, 2018 starting backlog is up 30% in the last 3 years.
None of this spending forecast includes any projections for potential work from future infrastructure stimulus.
Current$ vs Constant$
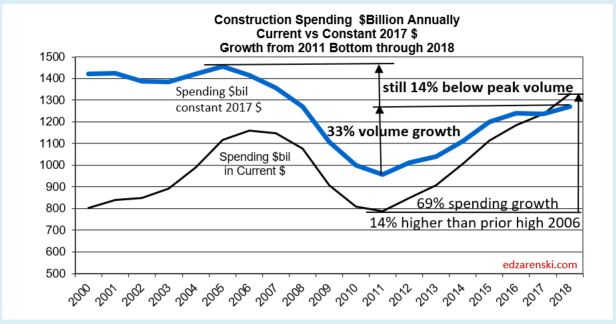
Construction spending reached a new current $ high in 2017 at $1,236 billion. The previous high in current $ was $1,161 in 2006. Spending first surpassed that in 2014 and has been increasing since. But that is in current $, which includes inflation.
Comparing current $ spending to previous year spending does not give any indication if business is increasing. The inflation factor is missing. If spending is increasing at 4%/year in a time when inflation is 6%/year, real volume is declining by 2%.
Although 2018 current $ spending will reach $1,330 billion, after adjusting for 4.5% to 5% inflation, 2018 constant $ volume will increase to only $1,270 billion. When comparing inflation adjusted constant dollars, 2018 spending will still be lower than all years from 1998 through 2007. In 2005 constant $ volume reached a peak at $1,450 billion. At current rates of growth, we would not eclipse the previous high before 2022.
While spending in current $ is 7% higher than the previous high spending, volume is still 14% lower than the previous high volume.
For more on Inflation Adjusted spending see Construction Spending is Back
Jobs and Volume
The period 2011-2017 shows both spending and jobs growth at or near record highs.
A spending forecast of 7%+ in 2018, or nearly $100 billion in construction spending, demands a few words on jobs growth. Construction requires about 5000 workers for every added $1 billion in construction volume. Construction jobs have never increased by 500,000 in one year. However, $100 billion in added spending is not the same as $100 billion in volume, and jobs growth is based on volume.
Although spending will increase 7%-8%, construction inflation has been hovering near 4.5% to 5% for the last five years. Real volume growth in 2018 after inflation is expected to be near 3% or $40 billion. That would mean the need, if there are no changes in productivity, is to add only about 200,000 additional workers in 2018, a rate of jobs growth that is well within reach. That is less than the average jobs growth for the last seven years.
Construction added 1,339,000 jobs in the last 5 years, an average of 268,000/year. The only time in history that exceeded jobs growth like that was the period 1993-99 with the highest 5-year growth ever of 1,483,000 jobs. That same 1993-99 period had the previous highest 5-year spending and volume growth going back to 1984-88.
Construction added 185,000 jobs in the last 4 months, Nov17-Feb18. That’s happened, for any 4-month period, only 5 times since 1984. The last time was 2005-06, during the fastest rate of spending increases since 1984.
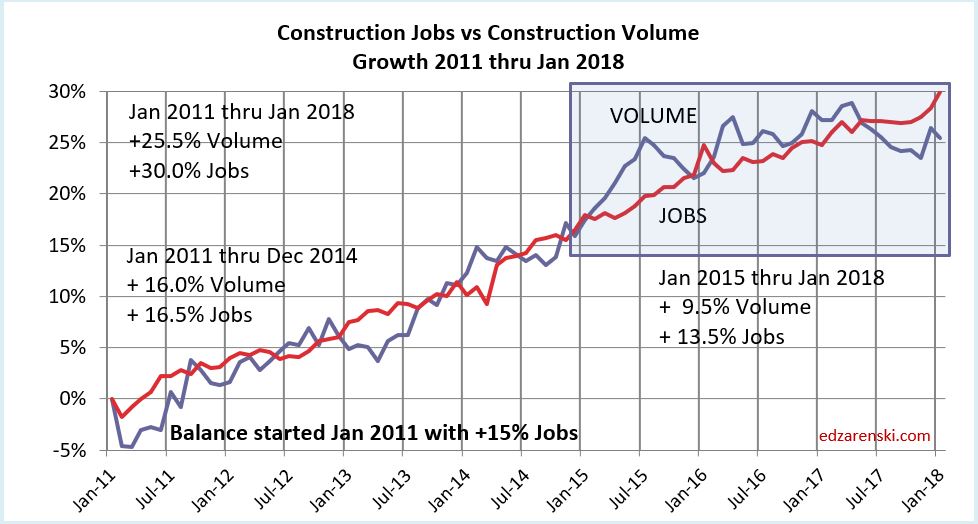
Total all spending increased 55% since 2010, but there was 30% inflation. Real total volume since 2010 has increased by only 25%. Jobs increased by 30%, 5% in excess of volume growth. But the results are much different for Residential than Nonresidential.
Nonresidential spending increased 43% since 2010, but there was 30% inflation. Real nonresidential volume since 2010 has increased by only 12%. Jobs increased by 27%, 15% in excess of volume growth.
Residential spending increased by 110% since 2010, but after inflation, real residential volume increased by only 57%. Jobs increased by only 37%, 20% short of volume growth.
For more on Jobs see Construction Jobs and Residential Construction Jobs Shortages
Residential Buildings Spending
Total Residential spending in 2017 finished at $523 billion, up 10.6% from 2016. This is the 5th consecutive year that residential spending exceeded 10% annual growth. Average spending growth the last six years is 13%/year.
Residential spending in 2017 was 50% single family, 13% multi-family and 37% improvements. In 2011, improvements was 48% of residential spending.
Census does not include flood damage repairs (house shell remains intact but gut renovate) in improvements but does include full flood damaged structure replacements (structure rebuild permit classified as new) in improvements.
Residential spending is more dependent on new starts within the most recent 12 months than on backlog from previous starts. Total starts for the last 6 months are the highest since 2006, but % growth has slowed considerably. New starts in 2017 posted only 2% growth, but I expect that to be revised up to at least 4%. Similar growth of 6%-7% is expected for 2018. Slower growth is now expected after 5 years (2012-2016) of new starts increasing at an average 20%/year.

Residential 2018 spending growth is forecast to increase only 6% after five years over 10%. Total residential spending in 2018 is forecast at $552 billion.
Residential spending will reach a 12-year high in 2018. Residential spending reached its current $ peak of $630 billion in 2005. Current 2018 pending is still 13% below that peak. In constant $, adjusted for inflation, all years from 1998 through 2007 were higher than 2018. In constant $, 2018 spending is still 27% below the 2005 peak.
Residential buildings construction spending in constant $ reached $523 billion in 2017. Previous spending adjusted to equivalent 2017$ shows that all years from 1996 through 2007 had higher volume than 2017. Volume reached a peak $748 billion in 2005. Only the years 2004-2006 had higher spending in current $. The 2005 current $ peak of $630 billion is still 17% higher than 2017, but 2017 volume is still 30% lower than peak volume.

Nonresidential Buildings Spending
Nonresidential Buildings spending in 2017 finished at $419 billion, up only 2.7% from 2016.
2017 spending finished below my forecast due to performance in Educational and Office. Educational starts increased 6%+/year for the last three years, but spending increased only 4%/year the last two years. Office starts increased nearly 30% in 2016, but spending increased only 3% in 2017. I suspect either big upward revisions to 2017 spending or large increases in backlog will boost 2018 spending in these two markets.

Nonresidential Buildings new starts are up 60% in four years. 2018 starting backlog is the highest ever, up 15% from 2017. Nonresidential Buildings 2018 starting backlog is 50% higher than at the start of 2014, the beginning of the current growth cycle.

Starting backlog has increased for five years at an average 10%/year. Spending from starting backlog, up 10% in 2018, increased for five years at an average 9%/year.
For 2018, Educational spending is projected to increase 14%, the best increase since 2007. Starting backlog increased 10%/year for the last three years. Manufacturing posted several very large project starts in 2017. Spending is projected to increase 12% in 2018.
Nonresidential Buildings spending in 2018 is forecast to reach a new high, $459 billion, an increase of 9.5% over 2017, surpassing the previous 2008 high. Educational and Manufacturing make up 55% of the growth.
For the Full Expanded 2018 Construction Spending Forecast – Nonresidential Bldgs
Nonresidential buildings construction spending in constant $ (inflation adjusted $) reached $419 billion in 2017. In 2018 it will reach $439 billion. Constant $ spending shows all years from 1996 through 2010 had higher volume than the 2018 forecast. Volume reached a peak $536 billion in 2000 and went over $500 billion again in 2008. In constant $ 2018 is still 18% below that 2000 peak.

Non-building Infrastructure Spending
Total non-building infrastructure spending in 2017 dropped to $293 billion, down 3.7% from 2016.
Non-building Infrastructure spending, always the most volatile sector, dropped to yearly lows from June through September, the lowest since November 2014. However, this short dip was predicted. Cash flow models of Infrastructure starts from the last several years predicted that dips in monthly spending would be caused by uneven project closeouts from projects that started several years ago, particularly in Power and Highway markets.

Current backlog is at an all-time high and spending is expected to follow the increased cash flows from the elevated backlog. Environmental Public Works (Sewage/Waste disposal down 14%, Water Supply down 9% and Conservation/Dams & Rivers down 7% in 2017) posted the largest declines in 2017 and accentuated the declines in the infrastructure sector. The sector was expected to increase in the last quarter 2017. All three markets posted increases in the 4th quarter, up 8% over the 1st nine months of 2017.
Non-building Infrastructure 2018 starting backlog is the highest ever, up 10%+ each of the last 3 years. Transportation terminals new starts in 2017 jumped 120%. Rail project starts increased more than 100%. Starting backlog for all transportation work is the highest ever, up 100% in the last two years. Transportation spending is projected to increase 20-25%/year for the next two years.
No future growth is included from infrastructure stimulus and yet 2018 spending is projected to increase by 8%.

Non-building Infrastructure will reach a new high for spending in 2018. Spending reached an all-time high in 2015 and stayed within 0.3% of that high for 2016. A 3.5% decline in 2017 was more of a decline than expected, but there may still be upward revisions to the preliminary total.
Non-building Infrastructure spending in 2018 is forecast to reach $319 billion, an increase of 8.6% over 2017.
My forecast for 2018 is predicting every infrastructure market will post gains, but it is the Power and Transportation markets that account for most of the growth in 2018. Transportation new starts in 2017 grew 120% due to massive new air terminal and rail projects. Spending growth in the Power market is not quite so apparent. Combined Power new starts are down for both 2016 and 2017, but the spending gains are coming from projects that started in 2015, a year in which starts were up over 120%.
Adjusted for inflation, spending in 2018 will be nearly equal to the all-time highs reached in 2015 and 2016.
Non-building Infrastructure construction spending in constant $ reached $294 billion in 2017. Recent highs were posted in 2015 and 2016 at $305 billion and $304 billion and 2018 is expected to reach $319 billion. Previous spending adjusted to equivalent 2017$ shows that 2008 and 2009 were both just slightly higher than $300 billion. Constant $ volume reached a peak $313 billion in 2016. Spending in current $ hit new highs in 2015 and 2016. This is the only sector that has current $ and constant $ at or near all-time highs.

Public Infrastructure and Public Institutional
Only 60% of all Non-building Infrastructure spending, about $170 billion, is publicly funded. That public subset of work averages growth of less than $10 billion/year.
Only about 25% of all Nonresidential Buildings spending, about $100 billion, is publicly funded, mostly Educational.
- Infrastructure = $300 billion, 25% of all construction spending.
- Infrastructure is about 60% public, 40% private. In 2005 it was 70% public.
- Public Infrastructure = $170 billion. Private Infrastructure = $130 billion.
- Power and Communications are privately funded infrastructure.
- Nonresidential Buildings is 25% public (mostly institutional), 75% private.
- Educational, Healthcare and Public Safety are Public Nonres Institutional Bldgs
- Public Commercial construction is not included.
- Public Institutional = $100 billion, mostly Education ($70b).

Public Infrastructure + Public Institutional = $270 billion, 23% of total construction spending.
Public Infrastructure + Institutional average growth is $12 billion/year. It has never exceeded $30 billion in growth in a single year.
See also Publicly Funded Construction
See also Down the Infrastructure Rabbit Hole

Public Spending
Public construction is a subset of Nonresidential Buildings and Non-building Infrastructure and about 1% of Residential.
The two largest markets contributing to public spending are Highway/Bridge (32% of total public spending) and Educational (26%), together accounting for nearly 60% of all public construction spending. At #3, Transportation is only about 10% of public spending. Environmental Public Works combined makes up almost 15% of public spending, but that consists of three markets, Sewage/Waste Water, Water Supply and Conservation. Office, Healthcare, Public Safety and Amusement/Recreation each account for about 3%.
2017 spending was down 1%, but has been at or near the all time high for three years.
Total public spending for 2017 finished flat at $284 billion with most major public markets down for the year. By far, the largest Public spending declines in 2017 are Sewer and Waste Disposal which is 7% of public markets, it was down 16% and Highway/Bridge, down only 3.5%, but Highway is 32% of all public spending.
Public spending hit a low in June 2017. It has been increasing since then, Public Educational, in the second half 2017 up 10% from the low point, now at a post recession high. We can expect to see another six months of growth before spending levels off in mid-2018.
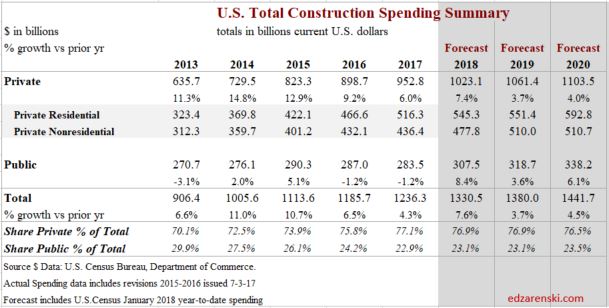
Due to long duration job types, 2018 starting backlog is up 30% in the last 3 years. In 2018, 40% of all spending comes from jobs that started before 2017. Leading 2018 growth are Educational (+15%) and Transportation (+35%), with a combined total forecast 20% growth in public spending.
Current levels of backlog and predicted new starts gives a projection that Public Non-building Infrastructure spending will reach an all-time high in 2018 and again in 2019.
Total Public spending in 2018 is forecast to reach $307 billion, an increase of 8% over 2017, the best growth in 10 years.
Educational and Transportation will contribute equally and together account for almost 60% of the Public spending growth in 2018. Transportation new starts in 2017 grew 120% due to massive new air terminal and rail projects. Educational new starts total for the last three months posted the highest quarter in at least seven years. The 2nd highest quarter was also within the last 12 months, so still contributes fully to 2018 spending. 2018 signifies a turn-round in Public spending which has not posted significant growth since the recession.

Public spending is 10%, $30 billion, below 2009 all-time highs, most of the deficit coming from declines in Educational, Sewage/Waste Water and Water Supply. In 2018, Highway and Transportation are at all-time highs.
Click here for a formatted printable PDF Construction Spending Forecast – Summary Mar 2018
See these posts for additional info
2018 Construction Spending Forecast – Nonresidential Bldgs
Starts Trends Construction 2018 Forecast – Fall 2017 11-8-17
Backlog Construction 2018 Forecast – Fall 2017 11-10-17
For more on Jobs see Construction Jobs / Workload Balance 11-7-17
For effects of inflation see Constant Dollar Construction Growth 11-2-17
Construction Activity Notes 4-25-18
Notes on March 2018 Construction Spending
US Historical Construction Cost Indices 1800s to 1957
Historical Cost Indices Dating Back to 1800s
See pages 379-386 for indices
See page 387 for start of Housing
Chapter on Housing Historical Data
U S Census Historical Construction Spending Annual totals 1964-2002 USE Table 1
