Home » 2017 (Page 5)
Yearly Archives: 2017
Office Buildings Lead 2017 Construction Spending
New construction starts in 2016 for Office Buildings is setting up a very strong spending growth pattern for the next 2 years.

The five largest metropolitan areas comprise more than one third of total national new starts in commercial-multifamily construction. Total commercial-multifamily starts are up 7%. Commercial starts alone are up 11%. New starts for office projects increased more than 30% in 2016. The following percentages are growth in starts for new Office Buildings. Reference Dodge Data & Analytics New Commercial and Multifamily Construction Starts.
- New York City-Northern NJ-Long Island -2%, but from 2015 that was up 138%
- Los Angeles-Long Beach-Santa Ana +67%
- Chicago-Naperville-Jolliet +22%
- Washington DC-Arlington-Alexandria +87%
- Dallas-Fort Worth-Arlington +31%
Office construction starting backlog for 2017 (projects under contract as of Jan 1, 2017) is the highest in at least 8 years, more than double at the start of 2014 when the current growth cycle of office construction spending began. Also, the share of spending in 2017 from starting backlog is increasing.
Office spending since 2013 has increased every year by an average of more than 20%/year and is expected to continue or exceed that rate of growth in 2017.
Office construction spending reached a new all-time high in September 2016. Growth in office buildings will lead all 2017 commercial construction spending. Spending will be near +30% year over year growth for 2017 with total expected to come in at $91 billion.
Regardless what market fundamentals change for 2017, this work is already under contract and will be the driving force for 2017 nonresidential buildings spending.
See Also these related articles
Nonresidential Bldgs 2017 Forecasts Vary
Nonresidential Bldgs Construction Spending 2017
Behind The Headlines – Construction Backlog
Construction Spending vs Jobs
2-9-17
A few days ago I tweeted, “Last 16 months construction jobs growth outpaced growth in work put-in-place. Hard to see worker shortage from that perspective.”
The imbalance between construction spending and construction jobs is nothing new. It’s been going on for years. It reflects more than just worker shortages. In part it reflects hiring practices. It also captures changes in productivity due to activity. It also helps explain why sometimes new jobs growth rates do not follow directly in step with spending growth. That imbalance can be affected by either over/under-staffing or inflation.
This post presents a series of graphics that show the data that is compared and the percentages of increases (or declines) in balance between workers and output.
What data is available?
We get construction spending from Census and jobs from Bureau of Labor Statistics. For both we can break down the numbers by major construction sectors, Residential, Nonresidential Buildings and Non-building Infrastructure. Inflation is gathered from a number of sources and is specific to sector.
How to look at the data.
Construction spending must be adjusted for inflation to get real volume of work completed. Inflation (or deflation) can vary up or down by 2% to 10% but averages about 4%/year. The adjustment gives us what is referred to as “constant dollars.” Jobs must be adjusted for hours worked. Hours worked can change total workforce output by 2%-3%/year. Everything is converted to the most recent year for comparison.
The inputs:
This Building Cost Index plot shows inflation/deflation by sector. Note that it can vary dramatically from one sector to another. It is often driven by the amount of work activity within the sector. These indexes represent the actual final cost of buildings.

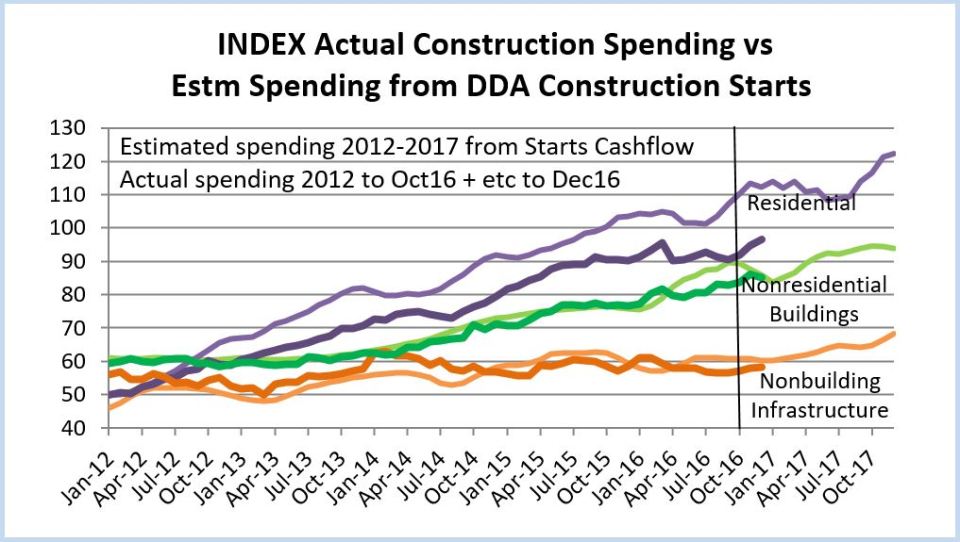
The inflation factors are applied to the annual spending within each sector. This plot shows the combined affect of inflation on total construction output. Current dollars is actual construction spending as reported by U.S. Census. Constant $ is inflation adjusted to 2016. Jobs adjusted for hours worked must be compared to constant dollars.

This plot breaks down the construction spending in constant dollars by sector. This provides the total work completed annually within each sector. This will allow tracking jobs by sector to constant $ by sector.

This plot shows U.S.Census CES jobs by sector. These are adjusted by the hours worked average per year. Hours worked doesn’t change by much within a single year but has varied by 4.5% from maximum to minimum and that has a significant affect on overall output. Adjusted jobs provides us with the total work output.

Those are all the inputs, adjusted to a constant point in time, 2016. Now we can look at how adjusted jobs growth compares to real spending output. I’ve often referred to this as productivity. When spending output is growing faster than jobs, productivity is increasing. When jobs are growing faster than spending output, productivity is decreasing.
The Outputs:
The difference between real spending output and jobs growth is more than simply explained as a change in productivity. It reflects the combined impact of hiring practices, hours worked, worker and skills shortages (or excesses) and changes in productivity on inflation adjusted spending. It does not provide a means to differentiate among these causes. However, regardless the cause, imbalances can be thought of as annual productivity gains or losses because they do indeed reflect the total real labor output required to perform the amount of real work put in place.

Leading up to and during the recession there appeared to be far more workers on hand than needed to get the work done. Prior to the recession, I expect a greater portion of the losses were over-hiring and worker productivity losses. It is not uncommon when work is plentiful that productivity declines (2005-2006). When spending started to decrease significantly it took a bit longer for companies to downsize their workforce. During that time (2007-2008) the greater portion of losses might be attributed to insufficient staffing reductions. As we approached the depths of the recession (2009-2010) staffing cuts exceeded the declines in actual work being put in place. Also, people who still had jobs were concerned about keeping their jobs and during such times at first productivity increases. At some point the insufficient staff becomes overworked and productivity declines (2010-2011). Post recession, spending increased faster than companies were replenishing their staff. That led to several years of productivity gains (2012-2015).
Another way to look at this same comparison is to plot the dollars of inflation adjusted volume of work per worker. Here I’ve plotted that by sector.

Some analysts prefer to report this as the number of jobs required to put-in-place $1 billion worth of work. Regardless how it is reported, it is imperative that the comparison be made to constant $, in this case adjusted here to 2016.

Finally we can look at the data for each sector and compare the work being completed each year to the total workforce output to complete that work. There are obviously significant differences in the data by sector.


The data outputs show some things that otherwise are not readily apparent. Note for instance that residential (constant $) spending peaked in 2005, but residential jobs peaked in 2006 when spending was already on the decline. That could be an indication that staffing patterns lag changes in work volume. From the 2005 peak to the 2008 bottom, residential spending declined from $700 billion to $300 billion, almost 60%, but jobs dropped from 3.5 million to 2 million, only about 45%. That would indicate that firms were significantly overstaffed at that time. That explains the several years of deep red bars on the residential productivity plot. That also helps explain in part the slow regrowth on residential jobs. For the real volume of work that was being completed at the time, which was real low, there was already excess staffing remaining on hand.
Work completed and worker output to complete the work will probably continue to be out of balance. It would be difficult to identify any abnormalities in the data releases, for example workers improperly classified to a sector. Any missing workers not captured in the survey would lower productivity. Real productivity gains and losses due to activity will always be a part of the mix. Hiring of less qualified workers due to skilled worker shortages is in the mix. And finally, companies delayed decisions on staffing adjustments will remain part of the issue.
Nonresidential Bldgs 2017 Forecasts Vary
2-5-7
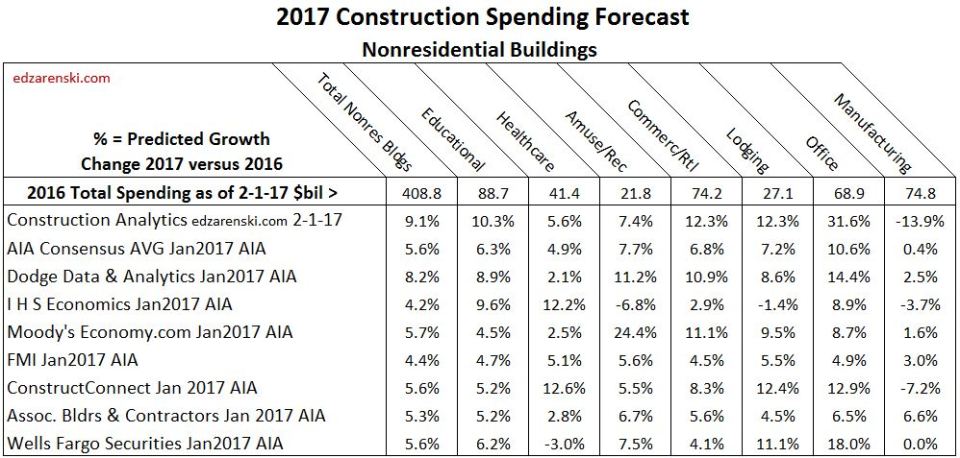
The following table includes my 2017 growth forecast for construction spending in nonresidential buildings compared to the recently published AIA Consensus Forecast which includes individual forecasts from seven economists.
The AIA Jan. 2017 Nonresidential Consensus Forecast can be found here
My 2017 Nonresidential Buildings Spending Forecast can be found here
Construction Analytics (edzarenski.com) forecast is based primarily on scheduled cash flow of construction starts in backlog. About 75% to 80% of all nonresidential buildings construction spending in 2017 will be generated by projects that are already underway. Only 20% to 25% of all spending in 2017 will come from new projects that start in 2017.
See my recent blog post on 2017 Starting Backlog here describes in part how I use backlog starts data to generate future spending forecast.
Nonresidential buildings 2017 starting backlog is 45% higher than at the start of 2014, the beginning of the current growth cycle. Spending in 2017 from that starting backlog has increased every year and it will be up 35% over 2014.
This comment I made two weeks ago in a post on Dodge Data 2016 Construction Starts helps explain in part the level of new starts in 2016 that established the pattern I see going into 2017:
“Nonresidential Building new starts in December remained consistent with October and November. Although well below the yearly highs reached in August and September, the final three months helped carry 2016 totals to an 8-year high. Nonresidential Buildings starts for the last six months averaged the highest since the 1st half of 2008.”
Nonresidential Buildings spending for 2016 totaled $409 billion, UP 8.1% from 2015.
Nonresidential Buildings spending in 2017 is forecast to increase to $447 billion, 9.1% over 2016.
The most recent 3-month average seasonally adjusted annual rate (SAAR) is already leading into 2017 starting at $420 billion only 5.5% below the peak in 2008. By midyear 2017 the SAAR will reach a new all-time high.
The widest variances between my forecast and the AIA panel forecasts are in Office, Manufacturing, Educational and Commercial. Here are explanations to support my forecast.
Office project starts at the end of the year increased more than 30% for 2016. Office construction 2017 starting backlog (projects under contract as of Jan 1, 2017) is the highest in at least 8 years, more than double at the start of 2014 when the current growth cycle of office spending began. More importantly, the share of spending from starting backlog is also increasing for 2017. This is setting up a very strong spending growth pattern for the next 2 years.
Manufacturing buildings new starts dropped 33% in 2015 and 38% in 2016. A disproportionately large portion of both 2015 & 2016 spending was generated from starts in 2014. In 2014, starts had jumped 80%+, but now almost all of that work is completed. For 2017, the amount of spending from starting backlog has dropped 25% from the level of 2016. Even an increase of 50% in new 2017 starts would not make up for that loss.
Educational buildings new starts increased 11% in 2016. But more important is that the total value of starting backlog has been increasing for several years. In 2015, the value of starting backlog increased only 5% over 2014. In 2016 it was 9% and in 2017 it is 13%. Even if new educational starts in 2017 decline by 10% to 20%, 2017 spending is being driven higher by the work already in backlog.
Commercial spending increased 11% in 2016. For 2017, spending from starting backlog will increase 10%, and starting backlog is at the highest level since pre-recession. In fact, spending from starting backlog will be 40% higher than 2014. Since starting backlog generates about 75% of spending within the year, most of the growth in 2017 is coming from very strong starting backlog.
Once again,”Simply referencing total backlog does not give a clear indication of spending within the next calendar year. The only way to know how much of total backlog that will get spent in the current year and following years is to prepare an estimated cash flow from start to finish for all the projects that have started in backlog.”
With few exceptions over the last three years, Construction Analytics, Dodge Data & Analytics and ConstructConnect have provided the most accurate forecasts. We’ll see in Feb. 1, 2018 how we all did when the total 2017 spending report gets released.
Constant Dollars – Impact of Inflation
2-4-17
Current $ vs Constant $
This clearly shows the impact of inflation on comparing Construction Spending data. Reports commonly compare current $1.166 trillion 2016 total spending today back to the (then) current $1.150 trillion at 2006 peak. Of course that seems to establish a new high. But that is so misleading.
Constant $ adjusted for inflation converts all past spending into 2016$ for an equalized comparison. From the low point in 2011 we’ve increased spending by 51% but in constant 2016$ we’ve added only 31% in volume and we are still 16% below the 2005 peak.
As measured in comparable constant dollars, No, we are not back to previous levels of spending. We will probably not return to previous highs before 2020.
The widening gap from right to left, as we look back in time, is the cumulative affect of inflation. It might be only 2% or 4% looking back one year, but back to 2003 it’s 40%.
Impact of Inflation
In all projections, the affect of inflation must be considered. Why is tracking inflation important? Well, as an estimator it’s necessary to assign the appropriate cost to items over time. And it’s needed to properly interpret construction economics. But it’s also important for business management.

Due to construction inflation, a company that was building $700 million in nonresidential buildings in 2005 needs to build $1 billion today just to remain the same size as in 2005. Increasing revenues by 5% annually in a period when inflation is increasing by 5% is not increasing annual volume. While revenue may be increasing, volume would be static. Over a period of years, if this were to occur, since some companies will grow, the amount of volume available to bidders could potentially restrict growth in the number of bidders able to secure new work or in the growth in the size of companies.
In this table, both the index values and the resultant annual escalation are shown. The index value gives cumulative inflation compared to 2016$.

SEE ALSO these other posts
Are We at New Peak Construction Spending?
Infrastructure – Ramping Up to Add $1 trillion
1-30-17
How long would it take to accommodate adding $1 trillion of new infrastructure construction spending?
I read this in another recent article on the topic; “If passed, the ripple effect of an estimated $100 billion a year in new infrastructure construction would undoubtedly be felt throughout the industry.”
The article seems to imply the industry could absorb $100 billion in new infrastructure work and maintain that $100 billion added spending for 10 years. The infrastructure sector could not accommodate that massive amount of instantaneous growth. Let’s look at maximum historical rates of growth to understand why.

To really understand construction growth rates we need to look at all historical spending in constant dollars (inflation adjusted).All constant dollars in this analysis are converted to 2016$.The following spending historical data goes back to 1993. Jobs data goes back to 1970.
- Construction Industry total spending fastest rates of growth:
- Maximum growth one year, 2015, +$107 billion, in 2016$= $87 billion
- 2011 – 2015, 4 yrs, +$324 billion, in 2016$ = +$240 billion = $60bil/yr.
- 1995 to 1999, 4 yrs, +$200 billion, in 2016$ = +$200 billion = $50bil/yr.
- Infrastructure Sector spending fastest rates of growth:
- Maximum growth one year, 2007, +$40 billion, in 2016$= $36 billion
- 2005 – 2008, 3 yrs, +$87 billion, in 2016$ = +$52 billion = $17bil/yr.
- 1997 – 2001, 4 yrs, +$50 billion, in 2016$ = +$46 billion = $15bil/yr.
- Construction Industry Jobs fastest rates of growth:
- Maximum growth one year, 1999, 397,000 jobs
- 4 years from 1995 to 1999, average 317,000 jobs/year.
- 3 years from 2012 to 2015, average 266,000 jobs/year.
- Infrastructure Sector Jobs fastest rates of growth:
- Maximum growth one year, 2004, 65,000 jobs
- 3 years from 2003 to 2006, average 48,000 jobs/year
- 3 years from 2011 to 2014, average 26,000 jobs/year
The fastest one-year growth for the entire construction industry is $87 billion in 2015, but the fastest growth rate is never maintained for long. The period 2011-2015 is the highest average rate of growth at $60 billion/year. The entire industry has had jobs growth of more than 300,000/year only 6 times since 1970. 1995 to 1999 is the only period to average over 300,000 jobs/year longer than 2 years.
Infrastructure is only 25% of all construction work. The entire construction industry best growth rate ever achieved (in 2016$) absorbed $1 trillion in new spending over 5 years. Infrastructure has not absorbed $1 trillion newly added work in 25 years. The fastest one-year growth for the Infrastructure sector is $36 billion in 2007, but the highest average rate of growth is $17 billion/year. The current rate of growth since the recession is $10 billion/year.
The infrastructure sector has had jobs growth of more than 40,000/year only 3 times since 1993. Maximum jobs growth hit 65,000 in 2007. The best average jobs growth is 48,000 jobs/year and that has not occurred in the last 10 years. It’s the only period with average growth more than 26,000 jobs.
Let’s assume the fastest rates of growth can be duplicated once again. Let’s also assume that longer term growth will come closer to the long term average highs. So, infrastructure growth might reach $36 billion in a given year but could fall back to an average growth of $17 billion/year. Jobs could grow by 65,000/year but would probably average less than 48,000/year.
However, even with the addition of a new influx of infrastructure work, most of the other growth, which has been fairly constant for the last 25 years, is not going to go away. Since the recession, infrastructure has been increasing at $10 billion/year and jobs have been increasing 20,000/year. Assuming we maintain that level of normal infrastructure growth, then the remainder is what we might expect to accommodate in growth from new infrastructure stimulus.
If we could achieve maximum rates of growth we could increase infrastructure additionally through new stimulus by $26 billion/ year and increase jobs by 45,000/year.
If we could maintain long term best average rates of growth we could increase infrastructure through new stimulus by $7 billion/year and increase jobs by 28,000/year. Even if a portion of the normal growth goes away, it looks like the infrastructure sector could only accommodate adding about $10 billion/year in new stimulus work.
It must be noted that a large portion of infrastructure spending is private work, not publicly funded. Power is 90% private, 10% public. Highway is 100% public. Transportation is 30% private, 70% public. Sewage, Water and Conservation are 100% public. Communication is 100% private.
Fully 35% of all infrastructure work is private. Most of the huge increases in spending over the years are associated with the Power market. So this analysis counters any argument that publicly funded infrastructure can grow much faster. In fact, if only public works were taken into account, spending targets here would need to be reduced by 35% and the total duration to complete would be increased by 50%.
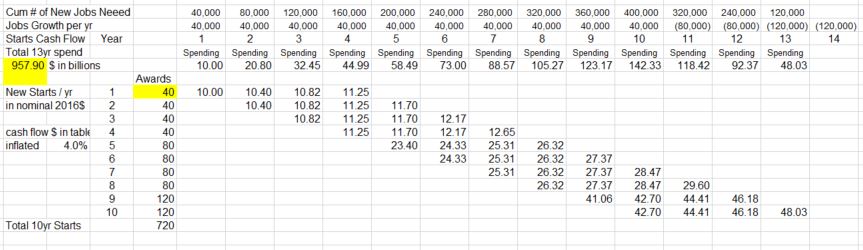
A cash flow schedule of all newly added work provided the plan needed to balance spending. All new work is assumed to take 4 years to complete. In the first year, $40 billion of new work starts, but only $10 billion gets spent. Spending flows at the rate of $10 billion/year for 4 years. New starts are added at a rate to continuously increase spending by $10 billion/year. By the 5th year we need to add $80 billion in new starts to get $20 billion in spending since all of year 1 work is now completed.
This table gives an indication of how cash flows. The full 13 year table is below.

I have assumed that inflation will add 4%/year to future spending. Five years from now the equivalent to adding $10 billion a year will be $12.2 billion a year. Due to inflation, we would spend $1 trillion to build the equivalent of $750 billion in today’s dollars. Increasing spending by the inflation adjusted equivalent of $10 billion per year, it would take 12 to 13 years to spend $1 trillion.
This scenario would push total infrastructure spending to the highest rates of long term growth on record. It’s not very likely growth like that could be sustained for very long. So, it’s possible total growth would fluctuate yet that we still keep our sights on achieving those long term growth rates. This allows for no economic downturn at any time in the next 10 years.
Another restraint to maximum growth rates is jobs. Infrastructure is only 25% of all construction. Maximum all construction jobs growth has exceeded 300,000/year a few times, but infrastructure jobs have increased by more than 40,000 only rarely and only once averaged over 40,000. While it takes about 5,000 to 6,000 workers to put-in-place $1 billion in construction, it takes only about 3,000 to 4,000 workers to put-in-place $1 billion of infrastructure. To reach maximum growth of $36 billion in infrastructure would require 110,000 to 140,000 new jobs per year, two to three times the long term growth. This analysis does not take into consideration any shortfall in jobs due to labor availability.
Setting spending growth to $10 billion/year results in 10 years of continuous record jobs and spending growth. Expectations of increasing infrastructure spending (not to be confused with starts) by $40 billion/year or $50 billion/year have not taken into consideration the maximum sustained growth rates in the industry. Talk of increasing infrastructure spending by $100 billion in a year is fantasizing.
added 2-2-17
In recent reading I came across a comment that both Educational and Health Care markets potentially could be included in Infrastructure funding. I take that to mean the public portion of those markets. Educational could be considered infrastructure and is 80% public ($70/$88bil). I would guess also Public Safety and Public Power could be included. Educational public spending is $70 billion/year. The others are $8 billion each. The short version of all the explanation above is that new infrastructure investment can grow a market at about half of the best total long term average growth of 10%/year. So these markets could absorb growth of about 5% or about $5 billion/year more.

More about Infrastructure written 3-6-17 Calls for Infrastructure Problematic
Behind The Headlines – Construction #s
1-28-17
Stuff you won’t read in the headlines.
- Total Construction spending for the last 3 months is at a 10 year high. However, in constant inflation adjusted dollars, construction spending is still 16% below 10 years ago. Are We at New Peak Construction Spending?
- In the last 36 months, there were 16 Census construction spending releases that initially showed a decline vs the previous month. Five months showed a decline vs the previous year. After revisions every month was revised up from the original posted amount. There remained only 2 significant mo/mo declines. There were no remaining year/year declines. Construction Spending Gets Revised UP
- Nonresidential Bldgs new starts (by Dodge Data) in the 2nd half of 2016 posted the best #s since the pre-recession boom. New Construction Starts 2016
- Nonresidential construction spending within the year is far more dependent on construction starts from previous years than on new starts within the year. Only 20%-25% of all spending within the year comes from new starts within the year. Behind The Headlines – Construction Backlog
- If Nonresidential New Starts for 2017 fall short of projections by 10%, it would reduce total 2017 nonresidential spending by 2.0% to 2.5%.
- 25% of all spending on nonresidential bldgs in 2017 comes from projects that started in 2015.
- 25% of all spending on non-building infrastructure in 2017 comes from projects that started between July 2014 and May 2015. That unusually high period contributes more to 2017 spending than all new infrastructure starts in 2017. Infrastructure Outlook 2017
- Monthly rate of spending for nonresidential bldgs will reach a new all-time current dollar high by midyear 2017. Behind The Headlines – Nonres Bldgs Construction Spending
- In constant inflation adjusted dollars, 2017 nonresidential bldgs spending will still be lower than any year from 1995 to 2009, 16% below the 2000 peak. Behind The Headlines – Nonres Bldgs Construction Spending
- New construction starts in 2016 for Office buildings as compared to 2015 went from -1% year-to-date in July to +30% ytd in September. Good example that we need to be careful because monthly variation sometimes messes up those comparisons. New Construction Starts 2016
New Construction Starts Leading Into 2017
1-24-17
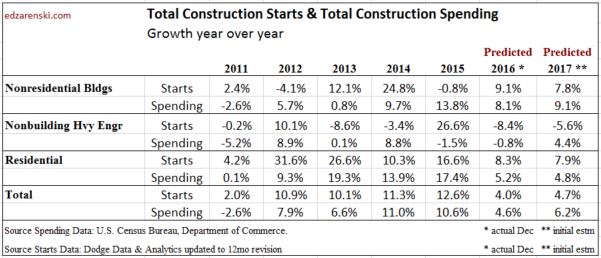
Dodge Data New Construction Starts in December fell off the pace of growth we had in the previous few months due entirely to a large drop in Energy Infrastructure starts. Total of all starts for 2016 finished as the highest year since 2005. Un-adjusted 2016 totals are only 1% higher than 2015, but 2015 totals have already been adjusted up, so this is an unequal comparison. Annual adjustments are always UP and average about +4% per year. After 2016 totals get adjusted up we might see 2016 growth of 4% to 5% over 2015.
Residential starts in 2016 posted the best year since 2005-2006. Residential starts bottomed in 2009 and have now posted the 7th consecutive year of growth. New starts show an increase of only 6% for 2016, but that follows several years of growth averaging more than 20%/year. I expect after adjustments 2016 residential starts will be revised to 8% growth. Spending has bounced 90% off the bottom in large part due to 17%/year average growth in 2013-2014-2015. Because both starts and spending growth have been so strong, recent percent growth rates are smaller. Expect only 5% spending growth in 2017.
Nonresidential Building new starts in December remained consistent with October and November. Although well below the yearly highs reached in August and September, the final three months helped carry 2016 totals to an 8-year high. Nonresidential Buildings starts for the last six months averaged the highest since the 1st half of 2008. Total starts as posted are up only 4% from 2015 but nonresidential buildings has been subject to the largest adjustment of all sectors. I expect after adjustment nonresidential buildings will show a 2016 increase of about 8% to 9%.
These six Nonresidential Buildings markets, which make up 80% of all nonresidential buildings spending, posted the following growth in starts leading into 2017: Office +37%, Lodging +40%, Educational +11%, Healthcare +21%, Commercial Retail +11% and Amusement/Recreation +21%. For the last 3 years spending combined growth in these six markets has ranged between 9%/yr and 12%/yr. For 2017, expect spending growth of 14%.
Manufacturing, which has an 18% market share of nonresidential buildings, saw new starts decline by 38% in 2016. However, in 2014 and 2015 this market posted the fastest growth of any market in a decade and posted the two highest years on record. In 2015 spending increased 33% to the highest ever recorded for manufacturing buildings. Spending is down 4% in 2016 and is expected to decline 13% more in 2017, but 2017 will still be the 3rd highest year of spending on record.
Non-building Infrastructure monthly new construction starts in December fell to a 10-year low. However, due to strong performance throughout the year, and even though total starts fell 11% from 2015, total Infrastructure starts for 2016 came in at the second highest year on record. 2015 was up 27% from 2014. So, even though headlines will point to an 11% decline in 2016, due to the distribution of spending from backlog, 2017 will post the largest spending increase in 3 years. I expect after adjustments the 2016 decline will be revised up by 3 points to -8%.
Power and Highway/Bridge/Street make up two thirds of non-building infrastructure spending. Power project starts dropped 33% in 2016, but from the highest annual total of starts on record. In 2015, Power starts increased 150% to an all-time high and Highway/Bridge/Street finished just shy of a 6-year high. In the 1st five months of 2015, a years worth of Power projects started and they are not yet completed. That volume is still contributing to infrastructure spending in 2017. It was not unexpected that starts in these markets would be down for 2016. The amount of monthly spending from projects started in 2014 and 2015 in this sector will contribute to spending for several years to come. Spending in 2017 will be the highest ever in this sector, up 4% from 2016.
2/24/17 UPDATE
Dodge Data published new construction starts for January 2017 on Feb 22. Starts are up 12% from December; +1% in residential, +16% in nonresidential buildings and +44% in non-building infrastructure. December was revised slightly. Among the major changes for this January: electric utility +285%; misc public works +222%; transportation terminals +768% (mostly LaGuardia airport terminal); offices +26%; manufacturing -69%; educational -18%.
A major revision was posted to January 2016 starts. They were revised up in total by 23%, a huge move equal to about 1/3 to 1/2 of what we would normally see for a total annual revision. For the last 4 years the annual revision to new starts has averaged +4%. January 2016 residential starts were revised up 9%, nonresidential buildings up 21% and non-building infrastructure up 49%. Even with that, current January 2017 starts are up 10% from January a year ago.
Prior to the data release on Feb. 22, non-building infrastructure 2016 starts were down 11% from 2015. You will note in my commentary above I predicted that would be revised to show only an 8% decline. After one month it has already been revised to only an 8.6% decline. I now expect after all months of 2016 infrastructure starts are revised 2016 will show only a 6% decline from 2015.

Behind The Headlines – Construction Backlog
1-16-17
tables updated 2-1-17
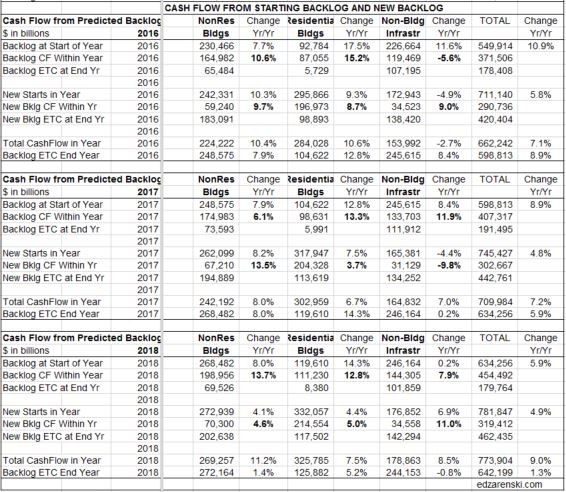
New Backlog is the total value of project revenues under contract that are about to start construction, or new starts. The entire value of a project is considered in backlog when the contract is signed. Projects booked in December 2016 or before are in backlog at the start of 2017. Simply referencing total backlog does not give a clear indication of spending within the next calendar year. Just because backlog is up going into a new year does not necessarily mean revenues will be up that year. You must understand some very important distinctions about backlog to determine how much revenue will occur within the next year.
Projects, from start to completion, can have significantly different duration. Whereas a residential home may have a duration of 8 or 9 months, an office building could have a duration of 18 to 24 months and a billion dollar infrastructure project could have a duration of 3 to 4 years.
Backlog at the start of 2017 could include revenues from projects that started last month or as long as several years ago. For a project that has a duration of several years, the amount in starting backlog at the beginning of 2017 is not the total backlog amount recorded for the project at its start date, but is the amount remaining to complete the project or the estimate to complete (ETC).
The only way to know how much of total backlog that will get spent in the current year and following years is to prepare an estimated cash flow from start to finish for all the projects that have started in backlog. Then add up the amounts from all projects in each month to find the cumulative cash flow in that month, or in that year.
Construction Starts provide the values entering backlog each month. Except for residential, new project starts within the year contribute a much smaller percentage to total spending in the first year than all the backlog ETC on the books at the start of the year. New residential projects contribute the most to spending within the year started because generally residential projects have the shortest duration. Residential projects started in the first quarter may reach completion before the year is over. New infrastructure projects generally have the longest duration and may contribute some share of project value to backlog spread over the next several years.
The distinction between backlog, backlog ETC and cumulative cash flow is necessary to predict spending. For example:
We start the year with $100 billion of residential projects in backlog and $100 billion of infrastructure projects in backlog. All of the residential projects could have durations of 12 months or less. Therefore residential spending could total $100 billion within the year. However, the infrastructure projects could have durations of 2 years, 3 years or 4 years. Spending from infrastructure backlog this year might total only $50 billion with $30 billion in spending occurring next year and $20 billion the following year. Although both sectors start the year with the same total amount in backlog, we can see the amount spent within the year is determined by the duration of the projects and the cash flow schedule.
Backlog totals may not be a good indicator of total revenue spending within the year. In fact, backlog could be up and total revenues for the year could end up lower than the previous year. Unless you have a clear picture of the types and duration of projects that make up the backlog, you will not have a clear picture of spending activity in the coming year.
See Also Construction Backlog 2017 3-21-2017
Infrastructure Outlook 2017 – Construction Spending
1-12-17
2-1-17 Upated to include Decmber data
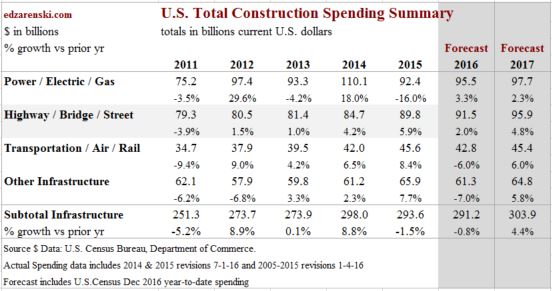
Non-building Infrastructure spending in 2016 will finish at $291 billion, down less than 1% from 2015. Spending based on projected cash flow from Dodge Data Starts predicted this drop. The negative drivers were Transportation, Sewage/Waste Disposal, Communications and Water Supply. Power, the largest infrastructure market at 34% of total sector spending, will finish up 3.3%. Highway/Street, 31% of total sector, will finish up 2%.
In 2017, Non-building Infrastructure, following two down years, will increase by 4.4% to $304 billion, due to growth in the highway and transportation markets. In the most recent quarter spending began to recover from 2016 lows posted in August and September. 2017 will be a record year for Infrastructure spending supported by spending generated from the Fixing America’s Surface Transportation Act and potentially the Water Resources Development Act.
Annual percent growth in new starts (backlog), by itself, is not necessarily a good indicator of spending in the following year. The duration of backlog must be known to forecast spending.
At the beginning of 2016, work in backlog had increased 9% over 2015, but because a large percentage was very long duration work, the amount of cash flow (work put-in-place) in 2016 from that backlog decreased from 2015.
At the beginning of 2017, work in backlog increased only 6% over 2016. What is significant though is that the amount of cash flow in 2017 from that backlog will be up 10%. That is being caused by long duration work-to-complete backlog from 2014 and 2015, which is dominated by spending in the power market. In the 1st five months of 2015, a years worth of Power work started and it’s not yet completed. It’s still contributing to infrastructure spending in 2017.
Although new starts in 2016 will finish down 6% from 2015, starts in 2015 were so strong that 2016 will still be a high volume of new starts. 2015 was up 25% from 2014. So, even though headlines will point to a 6% decline in new infrastructure starts in both 2016 and 2017, due to the distribution of spending from backlog, 2017 spending will post the largest growth in 3 years. 2017 will be a record year for spending on infrastructure, up more than 4% from 2016.
Infrastructure construction starts and spending is dominated by movements in Power and Highway markets. Power/Electric/Gas and Highway/Bridge/Street, about equally, comprise 65% of all infrastructure spending. Transportation/Air/Rail accounts for 15%. Sewage/Waste 8%, Communication 6%, Water 4% and Conservation 3%.
Power is 90% private, 10% public. Highway is 100% public. Transportation is 30% private, 70% public. Sewage, Water and Conservation are 100% public. Communication is 100% private.
Power project starts dropped 25% in 2016 but from the highest annual total of starts on record in 2015. In addition, power had very strong starts in late 2014. All of those very strong starts in late 2014 and all of 2015 are still ongoing in backlog and will contribute to strong spending in 2017. Almost half of all the spending in 2017 is generated from projects that started in 2014 and 2015. Power spending in 2017 will increase 2% over 2016 for a 6th consecutive year of near $100 billion in spending.
Highway/Street, the second largest public market, reached all-time highs in spending from the 3rd quarter 2015 through the 1st quarter 2016. After a 6 month slow down, spending in November again reached a new all-time high. Highway spending in 2017 will grow 5% over 2016.
Transportation hit all-time highs in spending all during the 2nd half of 2015. Spending declined by 6% in 2016 but is still the second highest year on record. It will again equal those 2015 highs throughout all of 2017. Transportation spending in 2017 will grow 6% over 2016.

Projected impact of proposed infrastructure stimulus:
- None of the starts or spending detailed above includes any projections of potential work from future stimulus.
- Infrastructure spending, about 25% of total construction spending, increased more than $25 billion in a single year only once. The average annual growth for the past 20 years is less than $10 billion/year. Although infrastructure growth is always erratic with no growth some years, the average growth for the last six years (post-recession) has averaged $10 billion/year. Some of those years included prior stimulus growth.
- The annual growth in PUBLIC Infrastructure has never exceeding $20 billion in a single year and averages only $7 billion.
- The average growth in infrastructure jobs (excluding all recessionary years because those years would make the result approach zero) is about 25,000 jobs per year.
- Based on infrastructure proportion of all construction, and on both all construction and infrastructure historical maximum rates of spending and jobs growth, it may be unrealistic to anticipate more than $10 billion/year growth in the infrastructure sector. ie., (from current total add $10bil yr1, $20bil yr2, $30bil yr3, etc.) See Infrastructure – Ramping Up to Add $1 trillion for more detailed explanation.
-
Also See Infrastructure & Public Construction Spending
Forecast 2017 Construction Spending
1-7-17
This is my initial forecast for 2017. Census final revisions to Oct., Nov. and Dec. 2016 spending will not be posted until February, March and April. I will then update the 2017 forecast to reflect better input. Then, with the June 1, 2017 release of spending, Census will post revisions to all 2016 spending. The 2016 record will then be updated.
2-1-17 Updated to include Dec 2016 data
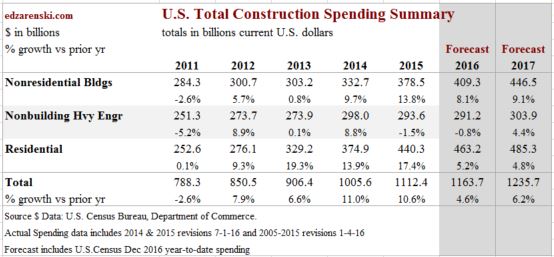
Total construction spending in 2017 will reach $1,236 billion supported by a 4th consecutive year of strong growth in nonresidential buildings. The monthly rate of spending will range from near $1.2 trillion in January to $1.3 trillion at year-end.

Nonresidential Buildings spending in 2017 will increase to $447 billion, 9.1% over 2016. The most recent 3-month average seasonally adjusted annual rate (SAAR) is $420 billion, only 5.5% below the peak of $444 billion in 2008. By midyear 2017 the SAAR will reach a new all-time high and it will finish the year near a SAAR of $460 billion. Office spending will lead 2017 with 30%+ growth. Commercial, Lodging and Educational markets are all expected to post strong gains over 10%.
For details on Nonresidential Buildings, See Behind The Headlines – Nonres Bldgs Construction Spending and Nonresidential Bldgs 2017 Forecasts Comparisons
Non-building Infrastructure, following two down years, will increase by 4.4% to $304 billion, due to growth in the highway and transportation markets. In the most recent quarter spending began to recover from 2016 lows posted in August and September. 2017 will be a record year for Infrastructure spending supported by spending generated from the Fixing America’s Surface Transportation Act and potentially the Water Resources Development Act.
For Non-building Infrastructure details see Infrastructure Outlook 2017
Residential will increase only moderately to $485 billion, adding 4.8% over 2016. That follows on three years of substantial growth averaging 17%/year. More than any other sector residential work is more dependent on new starts within the current year to generate spending, approximately two thirds of all spending within the year.

Office building new starts through August were up only 6% year-to-date but starts in September reached the highest in years. The 2016 starts finished at +37% providing the highest amount of work in backlog going back at least 8 years. Lodging starts in 2016 finished up nearly 40%, Healthcare up 20% and Amusement/Recreation up 35%.
Power project starts dropped 30% in 2016 but from the highest amount of starts on record in 2015. In addition, power had very strong starts in late 2014. All of those very strong starts in late 2014 and all of 2015 are still ongoing in backlog and will contribute to positive spending in 2017. Almost half of all the spending in 2017 is generated from projects that started in 2014 and 2015.
See Also 2016 Construction Spending 1-3-17
